5 Indicators for Confirming Support and Resistance

Support and resistance are the price areas where a market has repeatedly stopped falling or stopped rising. StockCharts' ChartSchool defines support as the level at which demand is thought to be strong enough to prevent further decline, and resistance as the level at which selling is thought to be strong enough to prevent further advance, and notes that neither always holds: a break signals that one side has won. Because reversals rarely print at the same tick twice, the LuxAlgo Library's S/R Zone entry recommends drawing the level as a band spanning the scatter of wicks and bodies around the defining swings. A zone on its own is a hypothesis. This guide covers five indicators that test it, each described from the Library's documentation with its known weaknesses, how they combine into confluence, how a level fails, and how to plot, score and backtest all of it in Quant Charts.
Why Zones, Not Lines
The Library's identification method for a zone is to mark at least two swing reversals that printed in roughly the same area, run the outer edge through the extreme wick of the touches and the inner edge through the nearest candle bodies, and scale the width to the timeframe and volatility, often sanity-checked against ATR. StockCharts gives the practical rule for when a single level is better: tight ranges of under two months suit exact levels, while ranges spanning many months with a wide price range suit zones. The trigger is then a reaction at the zone, such as a rejection wick or an engulfing close, rather than the first touch of a single level, and stops belong beyond the far edge plus a noise allowance. The indicators below are ways of asking whether a reaction at the zone is backed by anything.
1. Moving Averages
A moving average acts as dynamic support or resistance because it is a running estimate of where the trend has been. The Library's SMA entry describes the simple average as the reference smoother of technical analysis, with the 200-day among the most watched trend benchmarks in any market, and is explicit about the cost: on a steadily trending series the average runs roughly half its window behind price, and the oldest bar dropping out of the window can move today's value even while price sits still. The EMA weights recent bars more heavily, with a smoothing factor of 2 divided by length plus 1, so it responds faster at the same nominal length.
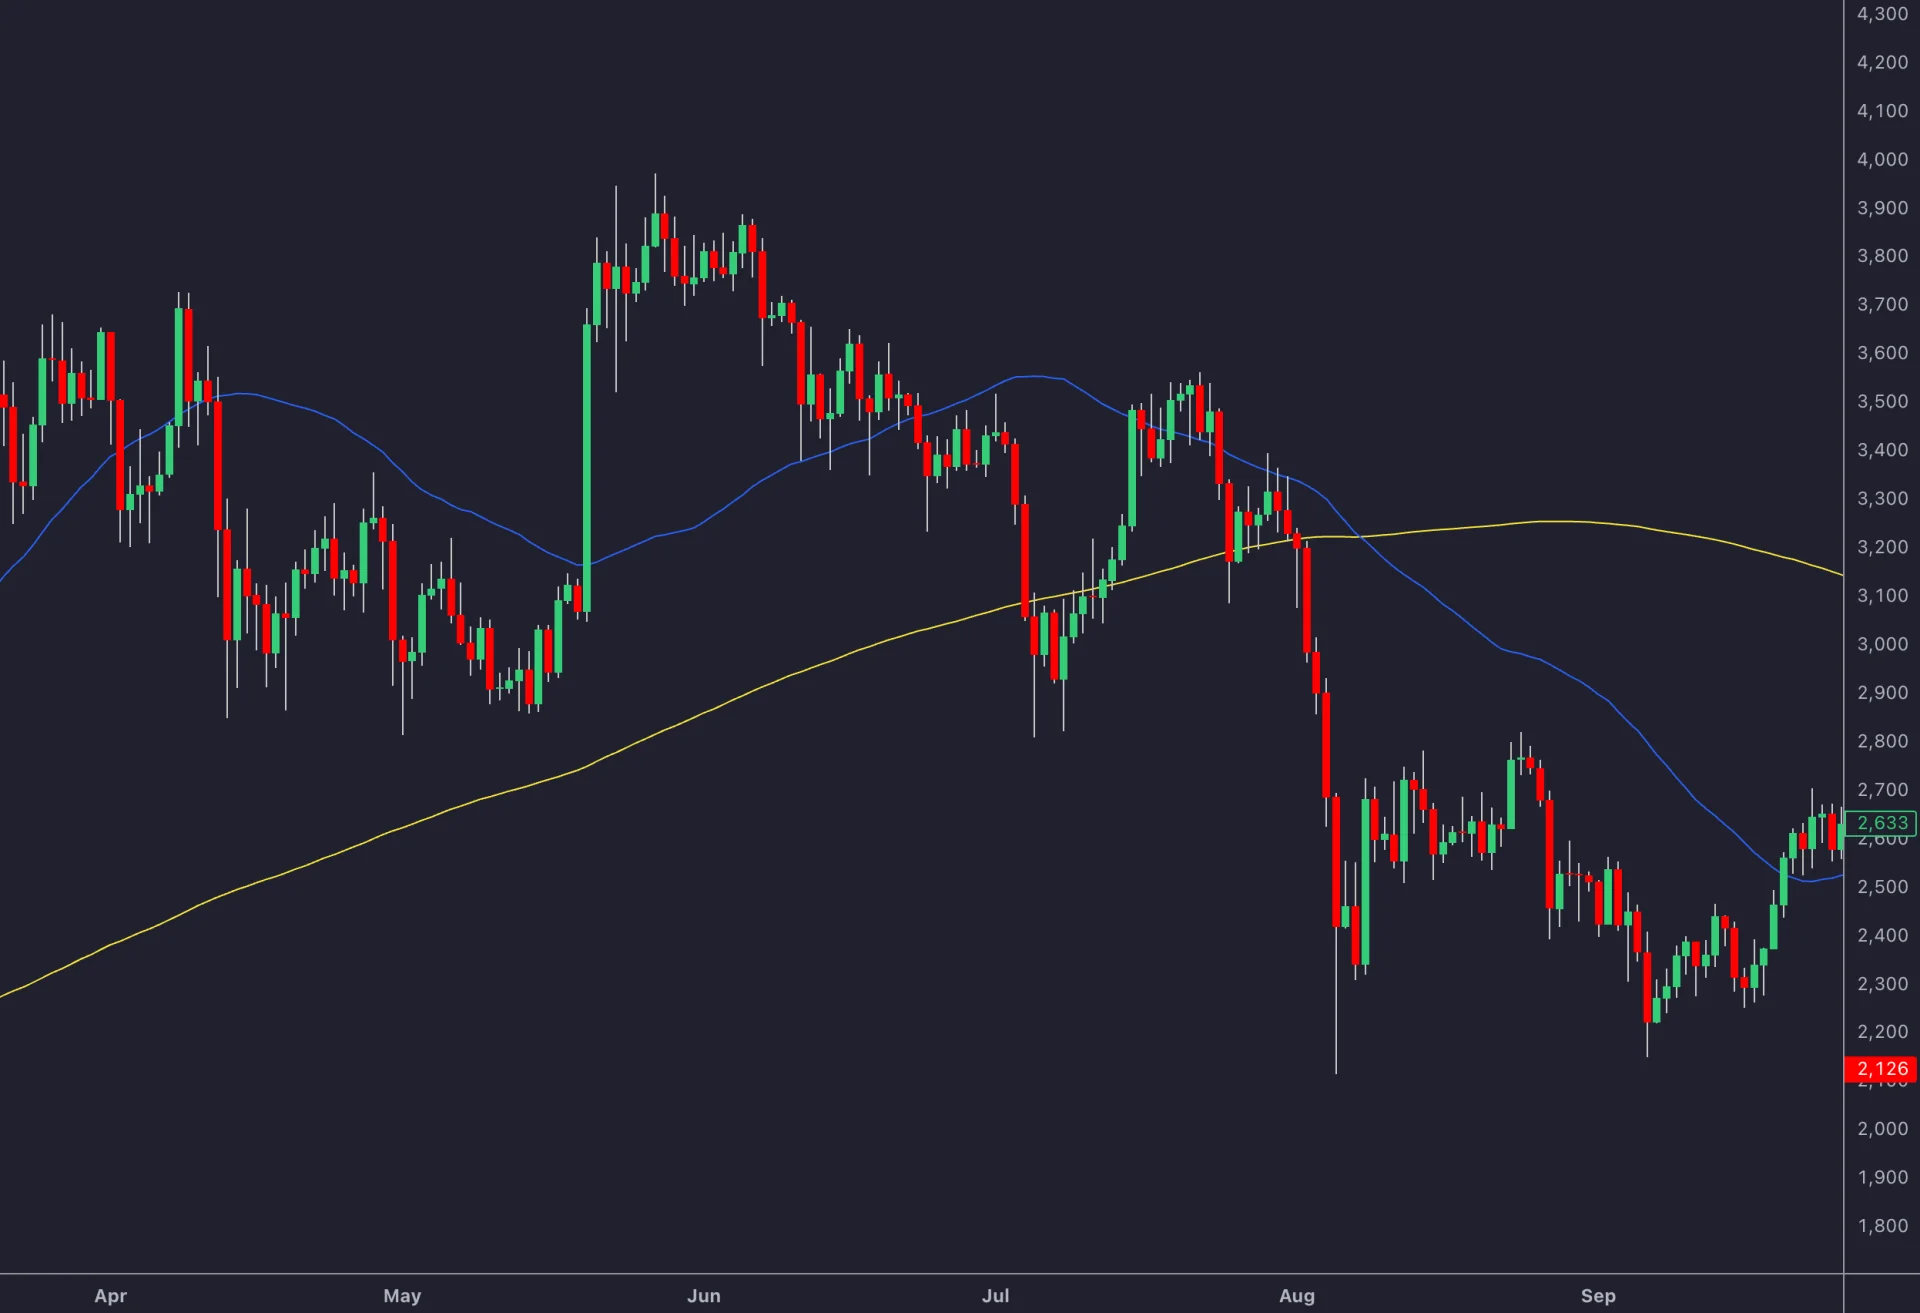
As confirmation, a moving average is most useful where it coincides with a horizontal zone: a pullback that reaches the 50-day average and a prior swing low at the same price is two references agreeing. The golden cross, the 50-day crossing above the 200-day, is a lagging, regime-level statement that the larger trend has turned up rather than a timing signal, and the Library's crossovers entry warns that in a trading range the averages flatten and braid around each other, generating whipsaw after whipsaw. A flat average through a zone confirms nothing; a sloped one that price respects on successive touches does.
2. Relative Strength Index
The Library's RSI entry describes Wilder's 1978 oscillator: average gains against average losses over 14 periods by default, mapped to a 0 to 100 scale, with readings above 70 called overbought and below 30 oversold. Two uses bear on support and resistance. The first is the range rule: in uptrends RSI tends to hold a higher band and in downtrends a lower one, so an oversold reading arriving at a support zone during an uptrend is the combination trend traders look for, while the same reading in a downtrend is normal behaviour rather than a floor.
The second is regular divergence: price prints a lower low into support while RSI prints a higher low, meaning the push that made the new extreme was weaker than the one before it. The Library's caveats are important. Divergence is measured between confirmed swing points, and sloppy anchoring manufactures divergences that were never there; it is famously early, strong trends can print several before turning, and serious treatments demand confirmation from price itself. A divergence at a zone therefore raises the odds that the zone holds; it does not replace the reaction candle.
3. Volume
Volume is the public record of participation, and the Library's Volume Spike entry sets out the honest reading: a bar trading far more than its recent norm, commonly twice the 20-bar average, certifies that something happened on that bar but does not certify direction. Heavy volume on a rejection at support says buyers showed up in size; heavy volume that produces almost no progress suggests absorption; and heavy volume pushing through the level reads as participation behind a breakout. Intraday, spikes must be judged against the time of day, since opens and closes are loud by default.
The Library's Breakout Confirmation entry gives the filters that separate a break from a head-fake: a close or several beyond the level rather than an intrabar tick, penetration by a minimum buffer such as a fraction of average true range, volume expansion at the break, or waiting for the retest that holds. It traces the volume requirement to Edwards and Magee, who treated upside breaks without a volume expansion as suspect and used a penetration convention of around three percent for mid-century daily stock charts, a number that does not transfer literally but whose logic has aged well. Every filter buys information with price: waiting costs entry on the breakouts that run and saves losses on the ones that fail.
4. Fibonacci Retracements
A Fib retracement maps horizontal levels across a completed price leg at fixed fractions of its range, conventionally 23.6, 38.2, 50, 61.8 and 78.6 percent, anchored from swing low to swing high for an up leg. The Library is precise about the mathematics and the folklore: 0.618 is the reciprocal of the golden ratio, 0.382 is 0.618 squared, and the 50 percent level is not a Fibonacci ratio at all but persists by convention from older halfway-back rules. Since the grid depends entirely on its anchors, anchor selection is the real skill: use the most recent completed impulse leg, keep one wick-or-body convention, and redraw once price sets a new extreme.
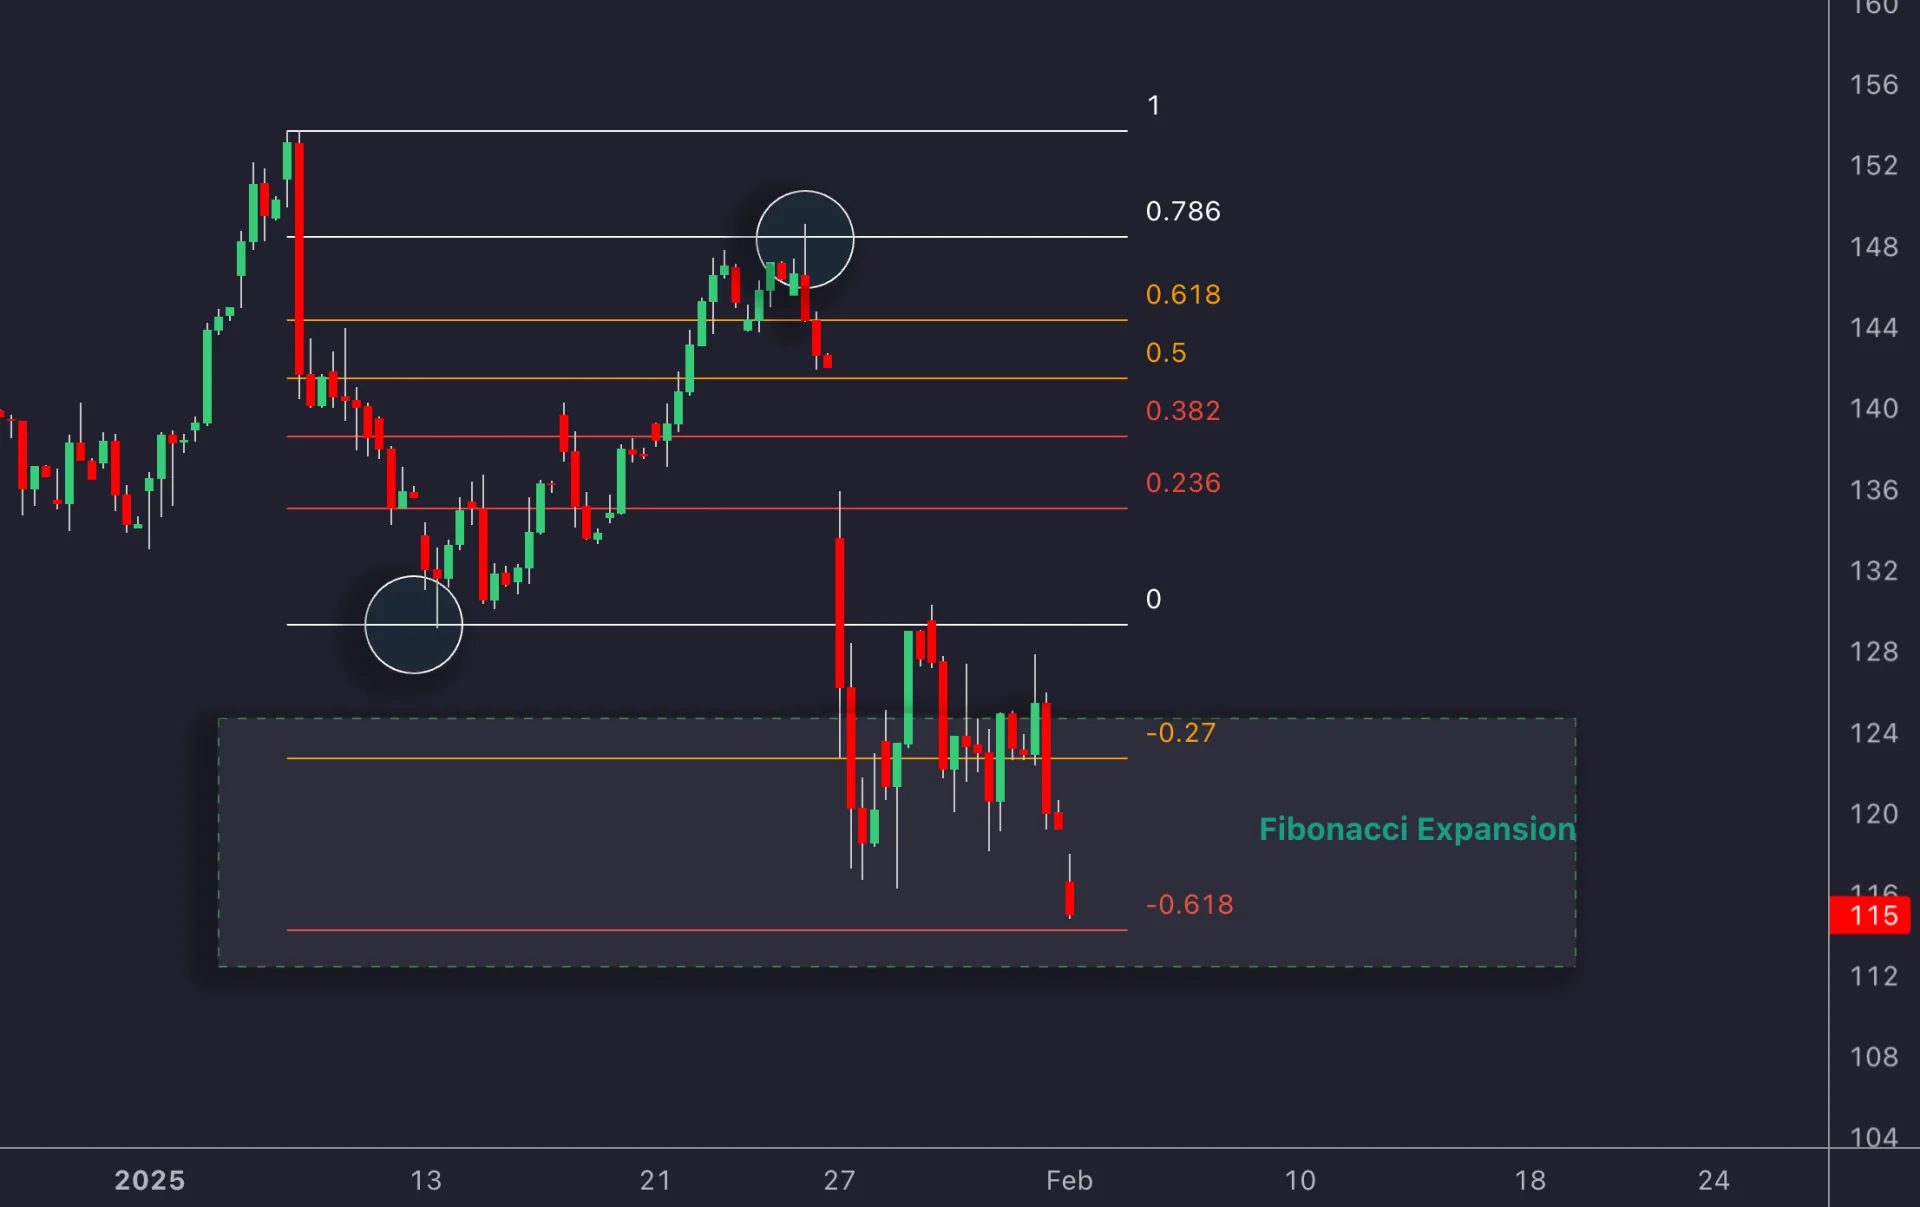
As a confirming tool, a Fibonacci level matters when it lands inside a zone drawn from price memory. The Library's Golden Pocket entry, the band between 0.618 and 0.65, makes the point directly: a pocket that overlaps a prior consolidation shelf or a mapped demand zone is a location two methods agree on, while a pocket floating alone is one ratio's opinion. Retracement depth also grades the pullback, with shallow holds near 23.6 to 38.2 percent reading as trend strength and deep ones near 61.8 to 78.6 percent as fading momentum. Price cuts through fib levels constantly, so they are attention areas that still require structure or a reaction.
5. Anchored VWAP and Volume Profile
The fifth indicator replaces guesswork about where participants are positioned with a measurement. The Library's Anchored VWAP as Level entry describes the volume-weighted average price measured from a chosen event forward, such as a major swing low, an earnings gap or a breakout bar, as the running break-even of everyone positioned since that event. While price holds above a rising anchored VWAP, the average buyer since the anchor is in profit and pullbacks into the line are where that cohort can defend break-even; acceptance below it leaves the same cohort trapped, and retests from beneath become resistance, a volume-weighted form of role reversal. The line keeps moving as new volume folds in, and its sensitivity decays as the anchor ages.
A volume profile asks the same question about a window rather than a cohort: how much traded at each price. Its point of control is the price with the most volume and the value area the band holding a set share of it, conventionally 70 percent. A horizontal zone that coincides with a high-volume node is a place the market has already done business and accepted; a zone in a low-volume gap is thinner and more easily traversed. Smart Money Concepts traders reach a related conclusion from a different direction with the order block, the last candle that closed against a move before it took off, validated only when the move away shows displacement; the Library notes these fail routinely and are the start of a checklist rather than the end of one.
| Indicator | What it adds at a zone | Confirming read | Main weakness |
|---|---|---|---|
| Moving average | Trend location and slope | Sloped average coinciding with the zone and respected on touches | Lags by about half its window; whipsaws in ranges |
| RSI | Momentum behind the test | Oversold in an uptrend, or divergence anchored to confirmed swings | Early; needs price confirmation |
| Volume | Participation on the reaction or break | Spike on the rejection; expansion with a full-bodied close on the break | Direction-agnostic; time-of-day effects |
| Fibonacci retracement | Depth of the pullback | Level inside the zone, ideally the golden pocket | Entirely anchor-dependent; levels are cut through constantly |
| Anchored VWAP and volume profile | Where participants are positioned | Zone at the cohort's break-even or a high-volume node | Anchor choice and window choice drive the result |
How a Level Fails
Confirmation cuts both ways, and the Library documents the failure modes. Role reversal is the classical rule that broken support tends to act as resistance and broken resistance as support, because the traders trapped by the break and those who missed it cluster at the old boundary from the other side; StockCharts states the same principle, that support can turn into resistance and vice versa. The classic expression is break, retest, continuation, and a failed flip, where price re-enters its old range and holds, is itself evidence that the break was false. Level freshness and decay adds the dimension of touch count, and honestly presents both readings: the classical view that repeated defences prove participation, and the order-flow view that each test consumes the resting interest that made the level hold, so a third or fourth test into a tightening market is widely read as a prelude to the breakout. Touch count is information to weigh, not a dial that turns one way.
Where Quant Charts Fits
Plot the levels natively. The LuxAlgo Library is built into the Quant Charts Indicators picker as its own section, and its Support/Resistance and Levels family carries indicator implementations for zones, support and resistance levels, Fibonacci retracements and anchored VWAP levels. Click Indicators, open LuxAlgo Library and add them alongside Basic studies such as RSI and moving averages. On the Free plan you can add five indicators per chart plus one Quant script.
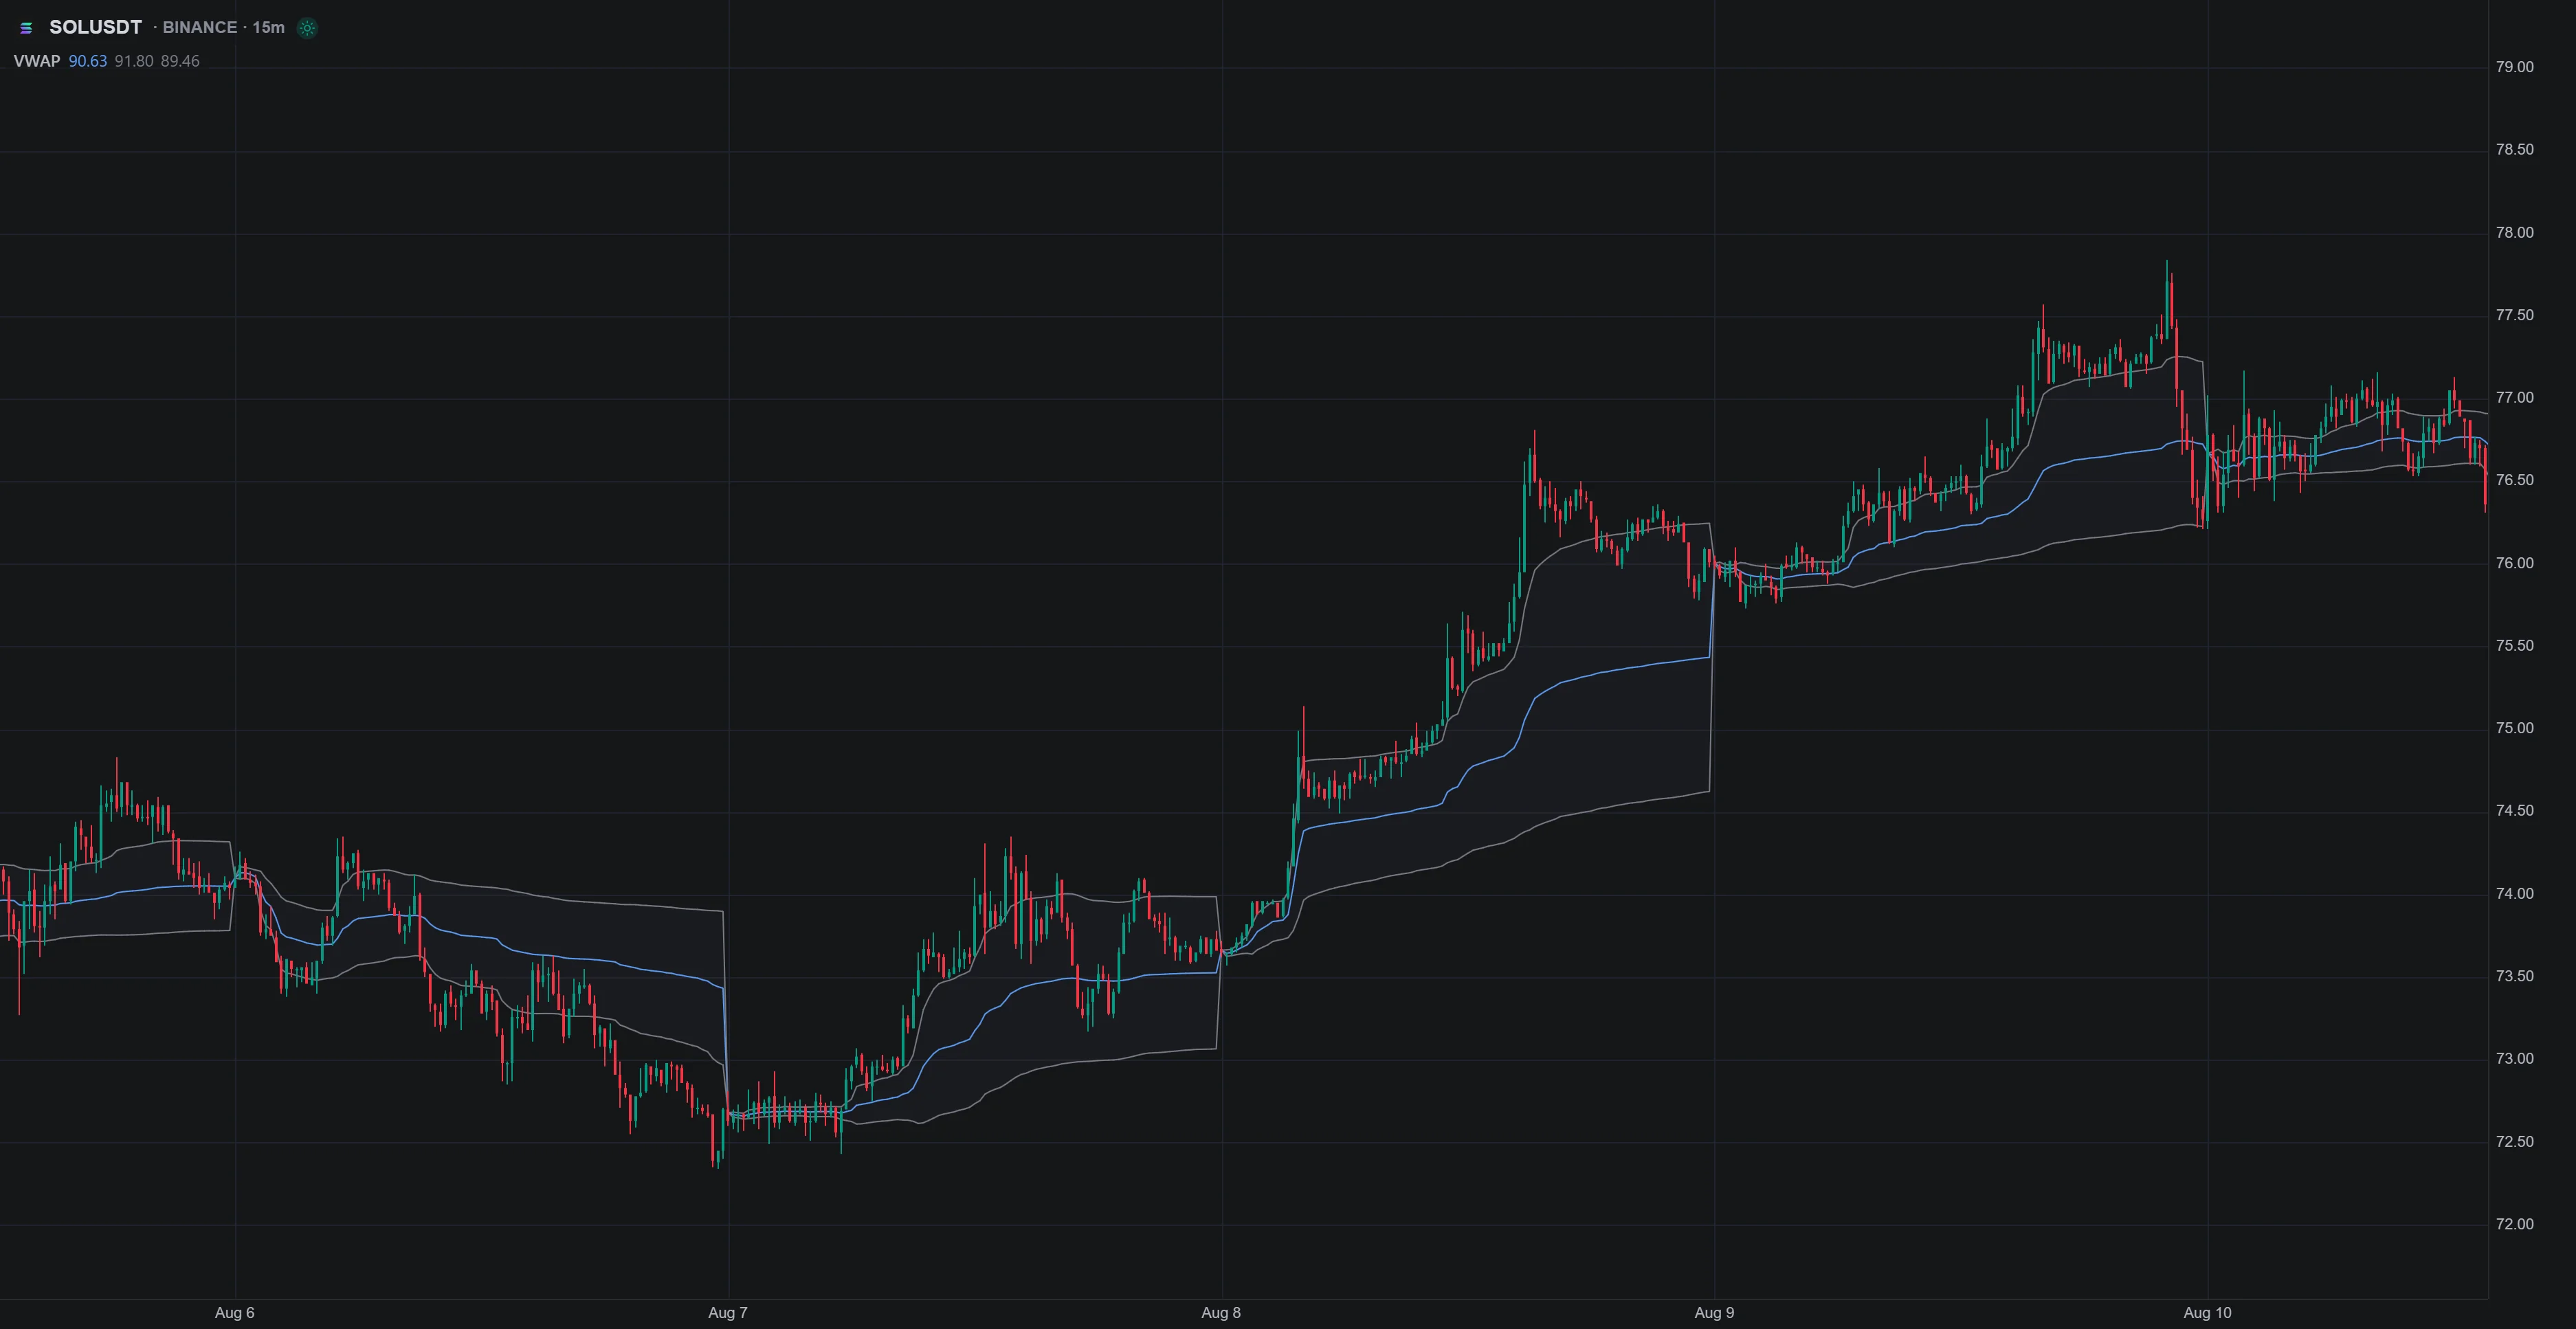
Use the order-flow tools for positioning. VWAP Bands, under Indicators and Orderflow, plots the anchored volume-weighted average price with up to three standard-deviation band pairs, anchored by day, week or month, and works on every market because it uses candle price and volume. Volume Profiles adds session, rolling and visible-range profiles with the point of control and value area; the session and rolling variants keep the buy/sell split from footprint data on crypto and US equities, while the visible-range profile works everywhere.
The video below shows how an indicator is added from the picker in Quant Charts.
Turn confluence into a rule and test it. Describe the combination to Quant, our coding agent, in plain language: for example, buy when price closes back above a prior swing low after a lower wick through it, with RSI below 40 and the bar's volume above twice its 20-bar average, stop beyond the zone's far edge. Quant writes the Pine Script; open Code to inspect it, then click Run. The Backtest Summary reports net profit, trade count, win rate, max drawdown and profit factor, with commission and slippage set in the strategy's Properties. Sweep the RSI or volume thresholds from the inputs and watch the summary strip react; a rule whose result collapses when a threshold moves slightly was fitted, not found.
Journal the reactions. Every plan includes the Journal, which turns broker fills or imported trades into round trips and reports win rate, profit factor and drawdown with a breakdown by hold time, day, time of day, symbol and side. Noting which confirmations were present on each level trade turns the table above into your own evidence over time.
What the platform does not do. No LuxAlgo tool places orders, and no indicator can tell you in advance whether a zone will hold. The tools plot the levels, measure the participation and positioning around them and record the outcomes; the read is yours.
FAQs
What are support and resistance?
Support is a price area where demand has repeatedly stopped a decline; resistance is where supply has repeatedly stopped an advance. Because reversals scatter, the Library recommends drawing them as zones spanning the wicks and bodies of the defining swings, and both StockCharts and the Library stress that a level is a tendency that fails when one side wins.
How do moving averages confirm support and resistance?
A sloped moving average that coincides with a horizontal zone is two references agreeing, and price respecting it on successive touches confirms the trend is intact. The average lags by about half its window and whipsaws in ranges, so a flat average through a zone confirms nothing.
How does RSI confirm a level?
Through range rules and divergence: an oversold reading arriving at support during an uptrend, or a lower low in price against a higher low in RSI anchored to confirmed swing points. Divergence is early and can repeat before a turn, so it raises the odds without replacing a reaction at the zone.
What does volume confirm at a level?
Participation, not direction. A volume spike on a rejection shows buyers or sellers appeared in size; expansion with a full-bodied close beyond the level supports a breakout. The Library's confirmation filters are a close, a penetration buffer, volume expansion or a retest that holds, each trading entry price for fewer false breaks.
Are Fibonacci levels support and resistance?
Only when they coincide with something else. The grid depends entirely on its anchors, price cuts through fib levels constantly, and the 50 percent level is not a Fibonacci ratio. A retracement level inside a price-memory zone, especially the 0.618 to 0.65 golden pocket, is a location two methods agree on.
How do I test support and resistance confluence in Quant Charts?
Add the Library's zone, level, Fibonacci and anchored VWAP indicators from the picker, plot VWAP Bands and Volume Profiles from the Orderflow group, then describe the confluence rule to Quant and run the backtest with realistic commission and slippage. The Journal records how your level trades performed.
References
LuxAlgo Resources
- S/R Zone, Support Level, Role Reversal and Level Freshness and Decay concepts (LuxAlgo Library)
- SMA, EMA, Golden Cross, Moving Average Crossovers, RSI and Regular Bullish/Bearish Divergence concepts (LuxAlgo Library)
- Volume Spike, Breakout Confirmation, Fib Retracement, Golden Pocket, Anchored VWAP as Level, Volume Profile, Point of Control and Bullish/Bearish Order Block concepts (LuxAlgo Library)
- Indicators, VWAP Bands, Volume Profiles, Making strategies with Quant and Journal Breakdown (LuxAlgo Docs)
External Resources
- Support and Resistance (StockCharts ChartSchool)
This article is educational and is not trading advice. Support and resistance are tendencies, not guarantees, and every confirming indicator described here fails in some conditions.
Read next