5 SMA Filters for Intraday Trading
Simple moving averages can filter intraday trades by trend, price location or the relationship between several lookback periods. The five approaches below cover 5-8-13 alignment, a 20/50 crossover, the 130-period average on a 15-minute chart, a ribbon and volume context. Each is a hypothesis to test, not a complete or guaranteed profitable strategy.
LuxAlgo’s charting and AI platform lets you inspect these conditions on Quant Charts and develop explicit rules with Quant, our coding agent. Keep the average type, bar interval, session and execution assumptions consistent before comparing results.
Quick Comparison
| Filter | Question it addresses | Main limitation |
|---|---|---|
| 5-8-13 SMA | Are shorter averages ordered above or below the slower one? | Fast alignment can reverse repeatedly in a range. |
| 20/50 SMA crossover | Has the faster average crossed the slower average? | A cross follows earlier price movement and can arrive late. |
| 130 SMA on 15-minute bars | Where is price relative to a longer intraday reference? | Its calendar span depends on the trading session. |
| SMA ribbon | Are several averages ordered, separating or intertwined? | The curves use overlapping price data. |
| SMA plus volume | Does participation or a volume-weighted reference meet an additional condition? | Volume depends on the feed and does not reveal trader identity. |
Before You Start: Bars, Days and Average Type
An SMA averages the selected source across a fixed number of bars. A 20-period SMA on a five-minute chart uses 20 five-minute observations, not 20 daily closes. A daily SMA displayed on an intraday chart is a different, higher-timeframe input.
An EMA weights recent observations more heavily. A 5-8-13 EMA setup is therefore not the same calculation as a 5-8-13 SMA setup. As explained in StockCharts’ moving-average guide, both types lag price and crossover systems can suffer repeated reversals.
The LuxAlgo Moving Average tool supports standard average types and an optional second average. Set the type to SMA for the tests here. Its primary default is a 20-bar SMA on close; do not assume the defaults already match your intended filter.
1. 5-8-13 SMA Filter Setup
Trend Identification
A bullish ordering is SMA 5 above SMA 8 above SMA 13. A bearish ordering reverses that relationship. The numbers belong to the Fibonacci sequence, but that mathematical origin does not establish an advantage in market data.
Ordering describes a state. The first bar that changes from an unordered state to bullish ordering is an event. Decide whether you want an entry only on that transition or whether the alignment simply permits a separate pullback or breakout setup.
Entry and Exit Rules
One illustrative long rule could require completed-bar bullish ordering, close above SMA 5 and no existing position, followed by entry at the next open. An exit might occur after SMA 5 closes below SMA 8, at a protective stop or before the session ends. Specify which exits take priority.
Price reacting near the 8- or 13-period average can be studied as a pullback, but neither curve is guaranteed support. In flat, intertwined conditions, a filter may reject trades instead of trying to force an interpretation.
Timeframe Suitability
| Chart interval | Five-bar lookback | Thirteen-bar lookback | Research consideration |
|---|---|---|---|
| 1 minute | 5 minutes of bars. | 13 minutes of bars. | High turnover makes spread and slippage especially important. |
| 5 minutes | 25 minutes of bars. | 65 minutes of bars. | Define whether averages carry prior-session observations. |
| 15 minutes | 75 minutes of bars. | 195 minutes of bars. | Fewer intraday signals and potentially larger stop distances. |
These totals describe included bar time, not uninterrupted elapsed time across overnight closures. Historical examples also need dates and fills. Two reported moves of 2.59 and 2.64 points in QQQ, with spans of 51 and 35 five-minute bars, do not establish a strategy’s profitability without that context. Those spans total 430 minutes of bars, exceeding one standard 390-minute U.S. equity regular session if they are non-overlapping.
For a labeled arithmetic example, a move of $2.59 from $328 is about 0.79%, and $2.64 from $330 is 0.80%. Those percentages describe price movement before costs, not verified returns from the filter.
2. 20/50 SMA Crossover
Identifying Trends
A bullish cross occurs when SMA 20 moves from at or below SMA 50 to above it; a bearish cross is the reverse. On an intraday chart, both lengths count intraday bars unless you explicitly request daily data.
Name this the 20/50 crossover. Golden cross and death cross most commonly refer to the 50-day and 200-day averages. Calling every 20/50 intraday cross by those names obscures the actual settings.
Separate Trigger from Filter
A crossover can trigger a candidate entry, while the condition SMA 20 above SMA 50 can merely permit other long setups. These produce different trade counts. Price above both curves and rising volume can be additional conditions, but two averages do not automatically make signals reliable.
For example, require the completed bullish cross and a positive slope in SMA 50 over five bars, then test entry at the next open. Compare that with the unfiltered crossover on the same sample. The extra slope condition may remove both losing and winning trades.
In a sideways market, repeated crosses are evidence that the rule is turning over frequently, not an instruction to keep reversing without regard to costs. High or low volatility alone does not identify a universally best timeframe.
3. 130 SMA on 15-Minute Charts
What the Lookback Represents
130 × 15 minutes equals 1,950 minutes, or 32.5 hours of bars. With complete 6.5-hour regular sessions, there are 26 fifteen-minute bars per session, so 130 bars span five such sessions. Extended-hours data, shorter sessions, missing bars and continuous markets change that relationship. It is not a universal five-calendar-day average.
Price distance from the SMA can be expressed as 100 × (price − SMA) ÷ SMA, provided the denominator is nonzero. At a price of $102 and an SMA of $100, the distance is +2%. This is distance from the average, not the percentage change in price over a previous period.
A positive distance means price is above the average; it does not necessarily mean the average is rising. A crossing occurs between sampled observations and need not include a bar with a distance of exactly zero.
Entry and Exit Interpretation
For a trend-following study, a completed close above the average could permit longs, while a close below it could end them. A countertrend trade that anticipates a return to the average is a separate mean-reversion hypothesis. Do not combine their outcomes under one undefined signal.
Pairing SMA 10 with SMA 130 creates a convergence or “pinch” idea. Define closeness numerically, such as an absolute percentage difference below a chosen threshold. Compression does not predict breakout direction; require a separate price trigger and an expiry for the candidate.
4. SMA Ribbon Analysis
A ribbon displays several moving averages together. For an SMA-only experiment, one possible set is 5, 10, 20, 30 and 50 bars. Record the exact set and source rather than treating every ribbon as the same indicator.
Ordered averages that spread apart can accompany a strengthening directional move. Compression and interweaving can accompany slowing movement or consolidation. Expansion does not automatically mean weakening momentum, and contraction does not guarantee that a new trend is starting.
A candidate rule might require every shorter SMA above the next longer one and a minimum normalized spread between the fastest and slowest averages. Decide whether that is an entry event or an ongoing permission condition. More lines do not represent independent votes because their price histories overlap.
Compare Ribbon Implementations Carefully
The Madrid Moving Average Ribbon is an external TradingView script whose description covers exponential or standard averages. Verify the selected implementation before using it for an SMA test.
LuxAlgo GMMA / MA Ribbon is a different, explicitly EMA-based study. It plots short lengths 3, 5, 8, 10, 12 and 15 and long lengths 30, 35, 40, 45, 50 and 60. The documented build fixes those lengths and exposes group colors. It should not be relabeled as a configurable SMA ribbon.
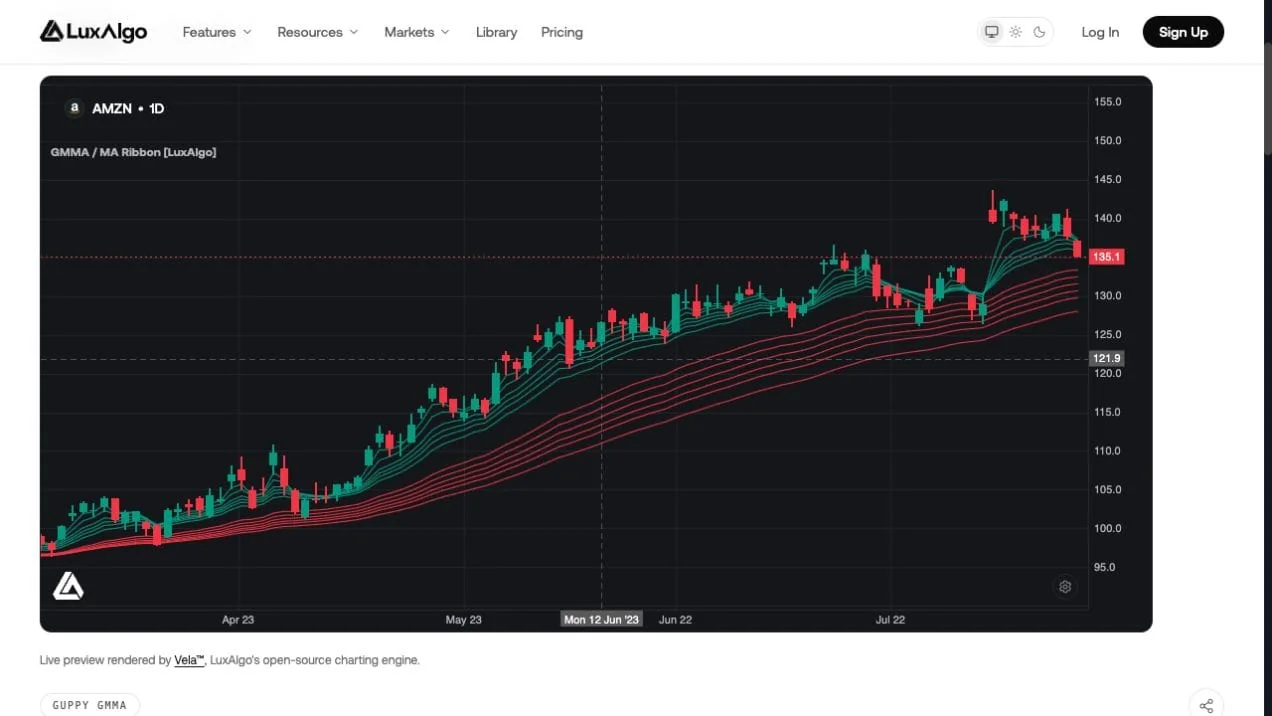
The grouping is a way to interpret different lookbacks. It does not identify which institutions or traders placed orders. Use Quant to specify an SMA-only version when that is the research question, then inspect and run the code manually.
5. SMA and Volume Combined
Volume can add a participation condition to a price-based rule. For example, a five-minute SMA 20/SMA 50 cross might be accepted only when completed-bar volume exceeds 1.5 times the mean of the prior 20 bars. Define whether the baseline excludes the signal bar, and compare the same feed and session.
Opening and closing activity often differs from midday activity. A time-of-day baseline or cumulative volume compared at the same elapsed session time addresses a different question from a rolling bar average. Comparing one minute’s volume with an entire previous day is not an equivalent comparison.
VWAP Is a Separate Reference
The LuxAlgo VWAP tool calculates cumulative price-times-volume divided by cumulative volume from its anchor. Its defaults use a session reset and HLC3, with optional bands. Weekly or monthly anchors change the calculation period.
Suppose two observations use prices of $100 and $102 with volumes of 100 and 300. Their volume-weighted average is ($100 × 100 + $102 × 300) ÷ 400 = $101.50, while their unweighted mean is $101. This shows why VWAP and an SMA are different inputs.
A rule requiring price above session VWAP as well as a bullish SMA ordering is a testable combination. It is not a direct detector of institutional buying. Volume Spread Analysis likewise interprets price ranges and activity; it does not reveal the identity of market participants.
Review Quant Charts data coverage. U.S. equity exchange-specific volume is not consolidated volume, and crypto activity belongs to the selected venue. Handle missing volume explicitly. Native chart studies, TradingView toolkits and order-execution workflows should not be assumed interchangeable.
Testing the Five Filters with Quant
Start with one market, one session and one baseline entry/exit rule. Then change one filter at a time. A request to Quant, our coding agent, might be:
Build a five-minute long-only SMA 20/50 crossover strategy on standard candles. Signal only after a completed cross and enter at the next open. Add a switch for a volume filter requiring signal-bar volume above 1.5 times the prior 20 bars’ mean. Carry average calculations across sessions, but restrict new entries to the configured trading session. Allow one position, set an initial stop two ATR(14) values below the fill using signal-bar ATR, use a 2R target and close any remaining position before the configured session ends.
Follow Making Strategies with Quant: inspect the generated code and run it manually. Verify the session timezone, warm-up history, next-open execution, stop/target ordering and final-session exit. A simulation that carries positions overnight is not the intraday test described here.
Use the native strategy viewer to set commission, slippage and sizing, save the run and review the trade log. Repeat with the filter disabled on the same dates, then evaluate periods not used for tuning. A smaller trade count is not enough to establish improvement.
Risk and Performance Metrics
For a hypothetical entry at $50 with a $49.50 stop, a selected $100 risk budget permits 200 shares before costs. A $51 target is 2R. If a gap produces a $49.20 stop fill, the loss is $160 before costs. Position sizing controls planned exposure, not a guaranteed maximum fill loss.
Report net expectancy, drawdown, trade count, turnover and losing streaks as well as win rate. For example, a 40% win rate with average wins of 2R and losses of 1R has gross expectancy of 0.20R per trade; costs of 0.25R would make that example negative.
A study of a 10-month SMA allocation rule cannot validate a five-minute filter. Annual returns, Sharpe ratios or drawdowns quoted without the underlying sample, costs and methodology should not be presented as expected intraday results. Time horizon, exposure and execution frequency materially change the experiment.
Market-Condition Considerations
| Condition | What to examine | Avoid assuming |
|---|---|---|
| Sustained trend | Whether a filter stays aligned and how late its exits occur. | Every cross marks the start of the move. |
| Range or chop | Whipsaw frequency, turnover and whether a predefined pause helps. | A longer SMA or more ribbon lines guarantees protection. |
| High volatility | Stop distances, gap fills and reduced size for the same budget. | Shorter periods are always better. |
| Thin or uneven volume | Spread, feed coverage and time-of-day comparisons. | A volume spike identifies institutions. |
If the strategy changes lengths with volatility, specify that adaptation before testing. RSI, MACD or Stochastic can be additional hypotheses, but do not keep stacking filters until one historical sample looks attractive.
For example, the original SMA 34/SMA 200 plus Stochastic (9,3,3) idea can be framed as requiring SMA 34 above SMA 200, a completed price cross above SMA 34 and smoothed %K crossing above 20 on the same bar. Define the stochastic smoothing and whether simultaneous triggers are required. That is a separate strategy to compare, not proof that 34/200 or 40/200 is the best intraday pair.
Frequently Asked Questions
What SMA should I use for day trading?
There is no universal best length. Start with a clearly defined filter such as 5-8-13 alignment or a 20/50 crossover, then evaluate the complete strategy after costs.
Is a 20-period SMA on a five-minute chart a 20-day SMA?
No. It uses 20 five-minute bars unless a higher-timeframe daily series is explicitly requested.
Does a 130 SMA on fifteen-minute bars always cover five days?
No. It equals 32.5 hours of bars, or five complete 6.5-hour regular sessions. Other session definitions and missing bars change the calendar span.
Is LuxAlgo GMMA an SMA ribbon?
No. The documented GMMA build uses twelve fixed exponential moving averages. Use an explicitly SMA-based implementation for an SMA ribbon test.
Does ribbon compression predict breakout direction?
No. It shows averages converging. A direction and entry require separate rules, and the market may remain in a range.
Does adding volume guarantee fewer losing trades?
No. Define the feed, baseline and timing, then compare results with and without the filter on the same sample and unseen periods.
References
LuxAlgo Resources
- Moving Average Library Tool
- GMMA / MA Ribbon: EMA Construction
- VWAP Library Tool
- LuxAlgo Quant
- Making Strategies with Quant
- Native Strategy Backtests
- Quant Charts Data
External Resources
Read next