5 Steps to Confirm Entries with Multi-Timeframes
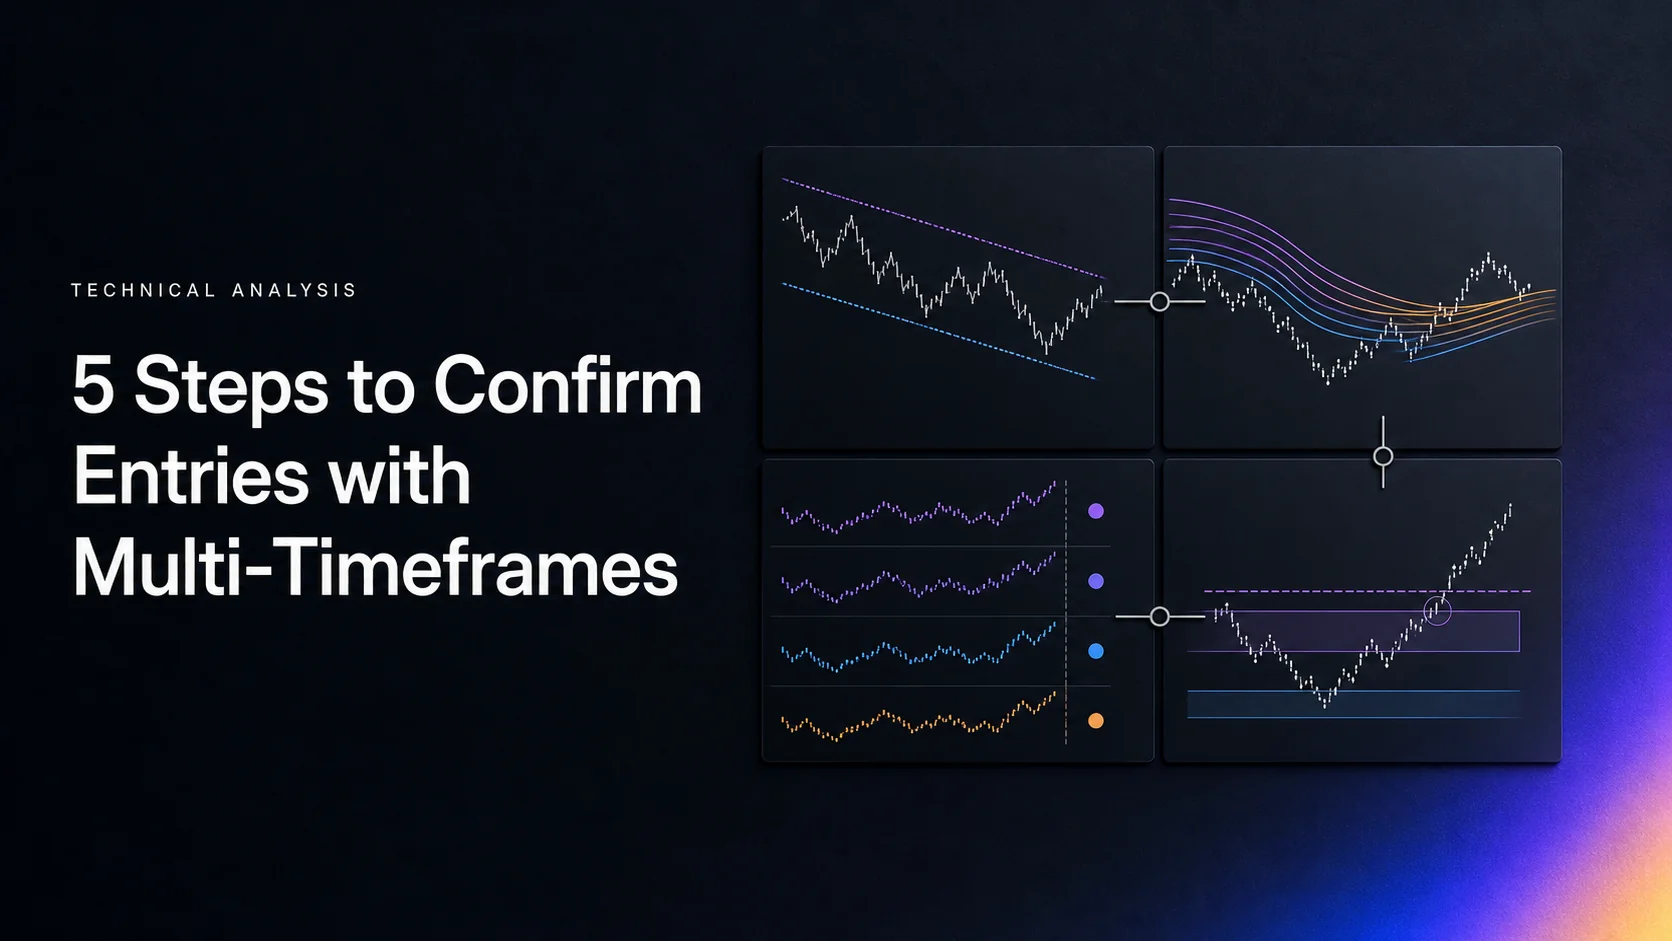
Multi-timeframe analysis gives each chart a job: context, setup and execution. It can make your decisions more consistent, but agreement across intervals does not guarantee a better entry. The charts summarize overlapping price data, so their signals are related rather than independent votes.
Use these five steps to select intervals, map a hypothesis, define confirmation, specify an entry and control risk. Decide in advance which completed candles are available at the moment of the decision, and test the complete rules rather than judging a few attractive charts.
Step 1: Select Timeframes with Distinct Roles
Choose a higher interval for context, an intermediate interval for the setup and a lower interval for the trigger. These roles are relative: a one-hour chart can be the context chart for a day trade and the entry chart for a swing trade. More charts are not automatically more useful.
| Trading approach | Context | Setup | Entry |
|---|---|---|---|
| Position example | Weekly | Daily | 4-hour |
| Swing example | Daily | 4-hour | 1-hour |
| Day-trading example | 1-hour | 15-minute | 5-minute |
| Scalping example | 15-minute | 5-minute | 1-minute |
These combinations are starting points, not optimal settings or suitability recommendations. Match them to the intended holding period, liquidity, transaction costs and time available to monitor a position. Two intervals may be enough if a third does not change a clearly defined decision.
Use the same instrument and venue where possible. Confirm trading hours, timezone, bar boundaries and price adjustment conventions. Four-hour bars with different session anchors can have different highs, lows and indicator values. A lower chart is not a source of missing information from another exchange.
Step 2: Map the Higher-Timeframe Trend and Levels
Define the trend consistently, such as a specified sequence of confirmed swings or price relative to a selected moving average. A crossover and a swing rule can disagree because they measure different things. Choose the rule before viewing the entry chart, and record when its inputs became known.
Two selected points define a straight trendline; a later third interaction can test that drawing but does not make it dependable by itself. Use consistent wick or body anchors and price scale. Repeatedly moving the drawing to fit subsequent candles changes the hypothesis.
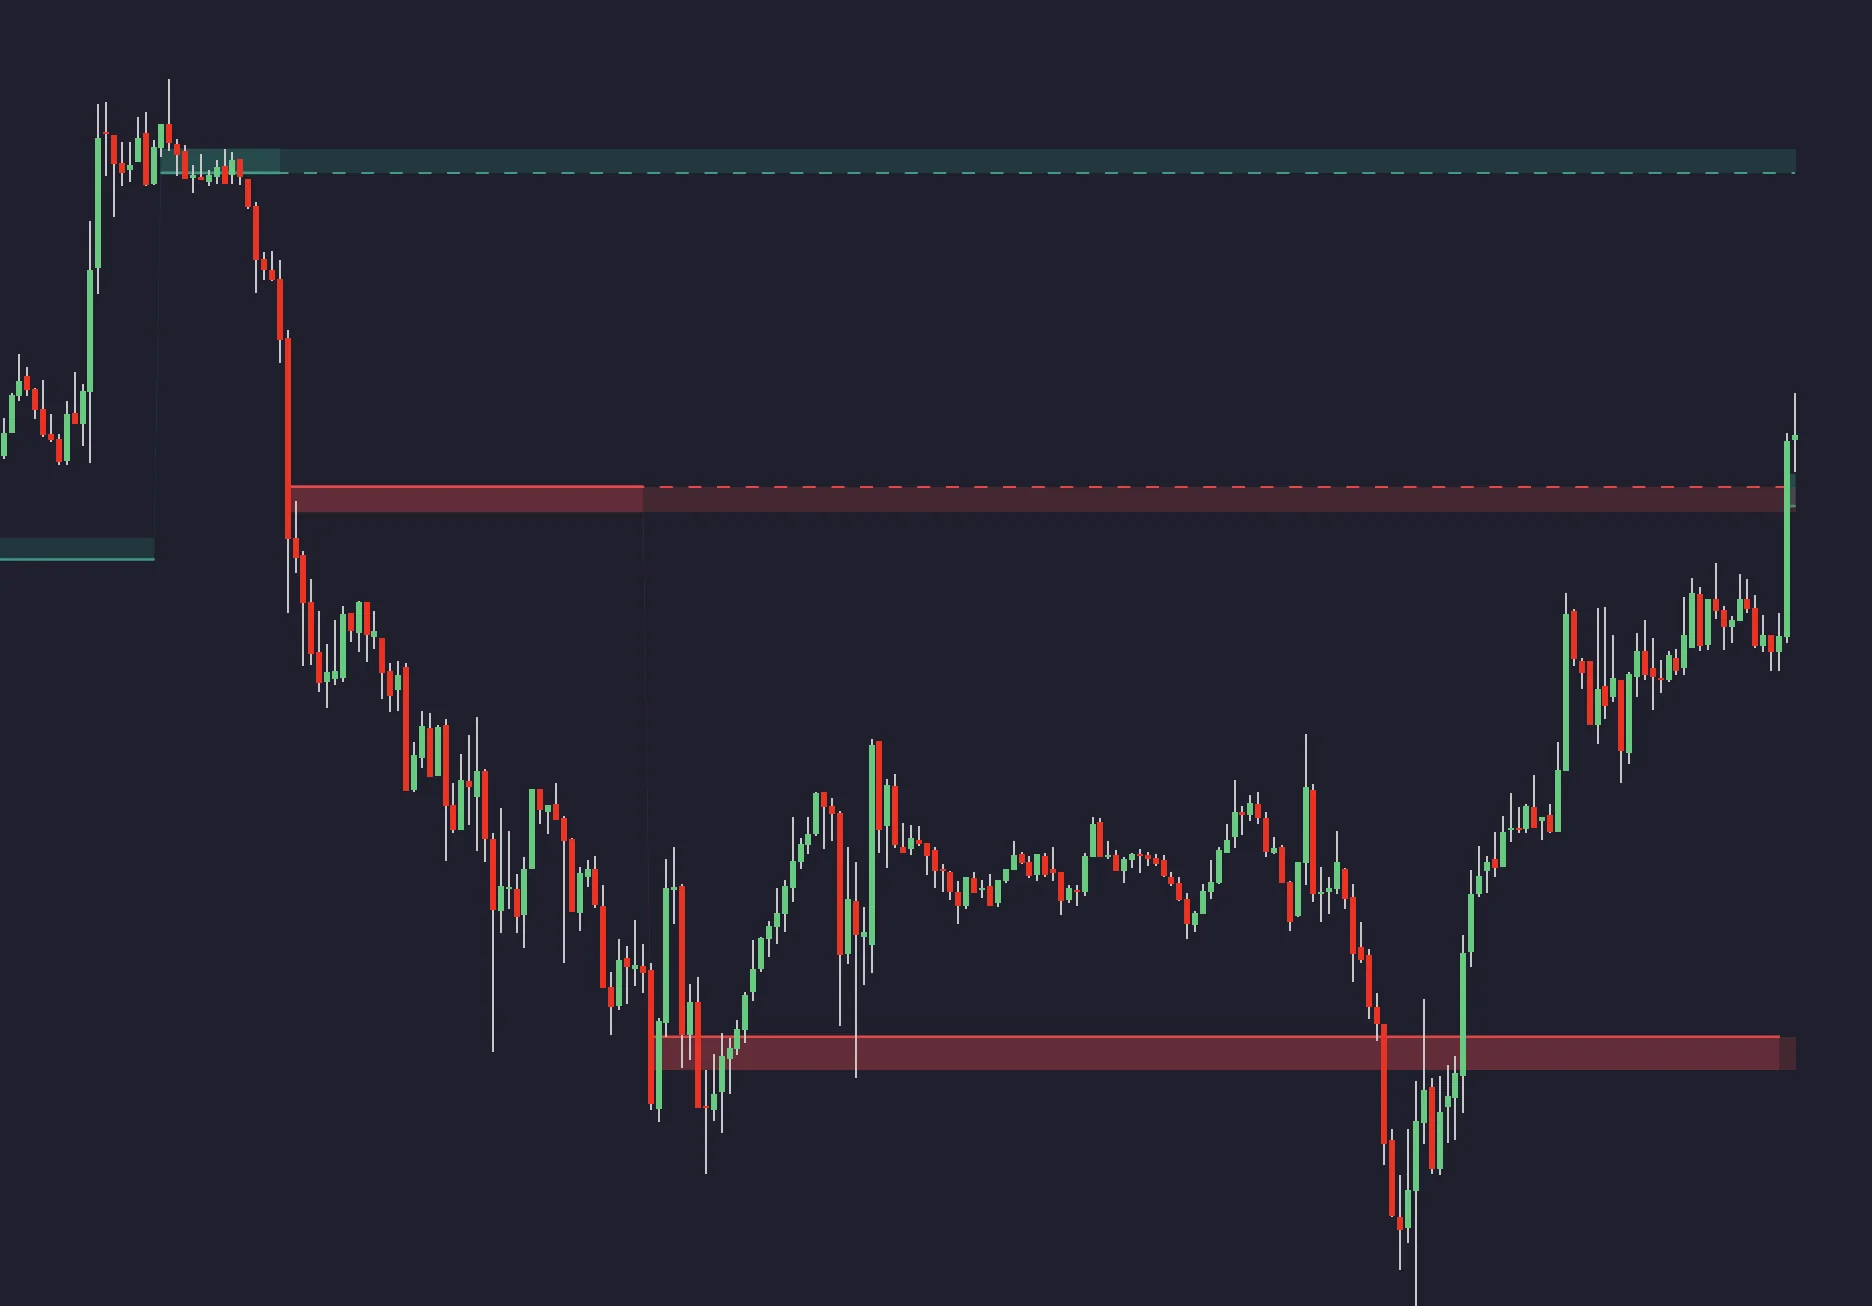
Mark prior highs and lows, relevant range boundaries and clearly defined zones. Round numbers, moving averages and Fibonacci levels can be additional references, but seeing the same price extreme on several aggregated charts is not independent evidence that it will hold.
For Fibonacci analysis, specify the start and end anchors and when they were confirmed. A retracement level measures a fraction of the selected move; it does not predict the time of a reversal. Avoid choosing whichever anchors make the latest reaction look most convincing.
Step 3: Define Confirmation and Respect Candle Timing
Write a condition for each chart. For example: a completed higher-timeframe bar satisfies the trend rule; the setup chart enters a predefined zone; the entry chart completes a specified reversal pattern. This describes a testable hypothesis, not a verified profitable strategy.
A bullish MACD condition on a higher chart and an oversold RSI on a lower chart can describe an upward context with a short-term pullback. They do not automatically confirm an entry. Both depend on price, and the pullback can develop into a larger decline. Candlestick patterns likewise need exact definitions and a decision time.
An unfinished higher-timeframe candle can change. Suppose hourly bars run from 10:00 to 11:00 and you make a five-minute decision at 10:35 in the same timezone. The 10:00–11:00 bar’s final close, high and low are not yet known. A completed-hour rule must use the last completed hourly bar; a deliberately developing-hour rule must be tested using information available at 10:35.
Do not copy the final 11:00 value backward into earlier five-minute decisions. For scripted research, verify how higher-timeframe data is requested, confirmed and aligned. The TradingView repainting documentation explains why historical and real-time values can differ. Pivot confirmation can introduce a similar timing error if a signal is drawn on an earlier bar.
| Situation | Predefined response | What to avoid |
|---|---|---|
| Higher trend and lower pullback | Wait for the stated trigger, or skip if it never occurs | Assuming a pullback must end at support |
| Context rule fails | Reject the setup if the plan requires that context | Switching intervals until another chart agrees |
| Higher candle still open | Use the last completed value or an explicitly tested developing-bar rule | Using its eventual final value early |
| Conflicting indicators | Follow a written priority rule or take no trade | Treating more indicators as automatic certainty |
Step 4: Specify the Entry and Its Failure Condition
The lower interval lets you define a more detailed trigger. It cannot ensure the best available price. Specify whether entry occurs after a candle close, on a stop order beyond a level, or with a limit order at a retest. Each has different fill assumptions; a limit order may not fill, and a market order can fill worse than expected.
Place the planned adverse exit where the hypothesis fails, allowing for the instrument’s normal movement and order mechanics. A smaller stop chosen only to make the reward-to-risk figure look better can increase the frequency of stopped-out trades.
The original example of reducing a 50-pip stop to 30 pips is valid only if the new setup genuinely supports that distance. With an unchanged target 90 pips away, the nominal reward-to-risk comparison changes from 1.8 to 3 before costs. It does not establish a better expected return: the probability of reaching the target and actual fills can change.
Do not assume 20–30 pips is appropriate for every 15-minute chart or that a lower interval routinely produces 1:3 trades. Volatility, spread, tick size and market structure differ. Define an expiry for a setup so an old signal does not remain valid indefinitely.
Step 5: Size the Position and Review the Complete Plan
Start with a loss allowance that fits the account and combined exposure, then calculate size from the planned adverse distance and value per unit. Higher-timeframe confidence is not a substitute for this calculation. A commonly quoted 1–2% rule is not universally suitable.
For a hypothetical instrument worth $1 per pip per unit, a $300 allowance with a 50-pip distance implies six units before costs. A justified 30-pip distance implies ten units under the same assumptions. Increasing size preserves the planned dollar exposure; it does not make the trade safer. Allow for fees, slippage, minimum size and the possibility of a worse stop fill.
- Record the instrument, session, chart intervals and precise context, setup and entry conditions.
- Specify when each signal is known, the order type, adverse exit, target and setup expiry.
- Include position-sizing units, costs, combined correlated exposure and rules for open trades when conditions change.
- Evaluate the same rules on data excluded from parameter selection, then use suitable simulation before considering live execution.
- Review individual trades, net results, drawdown and missed opportunities. Win rate alone cannot establish whether the extra confirmation helped.
Changing intervals, filters and exits after every loss can fit historical noise. Preserve the original test and compare a deliberate revision separately. A trading journal is useful for distinguishing a rule failure from a missed step or an unrealistic fill assumption.
Organize the Analysis in LuxAlgo’s Native Platform
Use native charts and workspaces to keep the context, setup and entry views organized. Confirm the selected instrument, interval and data coverage in each view. A shared workspace does not itself validate a multi-timeframe strategy.
Ask Quant, our coding agent to express a supported version of your rules. Inspect the generated code and run it manually. Confirm that the implementation supports the required higher-timeframe inputs and timing; do not assume an ordinary single-chart test reproduces the complete plan. Review strategy settings and individual trades with realistic costs and later evaluation data.
Frequently Asked Questions
How many timeframes should I use?
Use the smallest set that gives each chart a clear job. Two or three can organize context and execution, but more intervals do not guarantee better decisions.
What is the best timeframe combination?
There is no universal best combination. The examples should be evaluated for the intended holding period, market, costs and monitoring constraints.
What should I do when timeframes disagree?
Follow a predefined priority rule, wait for the stated trigger or skip the trade. Do not switch intervals until a preferred answer appears.
Can a lower timeframe make a stop safer?
Not automatically. A smaller distance must still match the failure condition and market movement. Recalculate size and account for costs and worse fills.
Can I use an unfinished higher-timeframe candle?
Only with a rule and test that use its developing values as they were known at the decision time. A completed-candle rule must wait for confirmation.
Read next