5 Stochastic Oscillator Mistakes to Avoid

The most costly stochastic oscillator mistakes come from treating a reading as a complete trading decision. An extreme value, crossover or divergence describes a condition. It does not specify the entry, exit, position size or costs that determine a strategy’s result.
Use LuxAlgo’s native charts and Quant, our coding agent, to turn an idea into explicit rules you can inspect and test. The following five checks help separate what the indicator measures from what you hope a trade will do.
1. Treating Overbought or Oversold as an Automatic Reversal
The stochastic oscillator compares the close with a recent high–low range. It is commonly described as a momentum oscillator, but its value is not a direct measurement of price velocity or fundamental value. A high reading places the close near the upper part of the measured range; a low reading places it near the lower part.
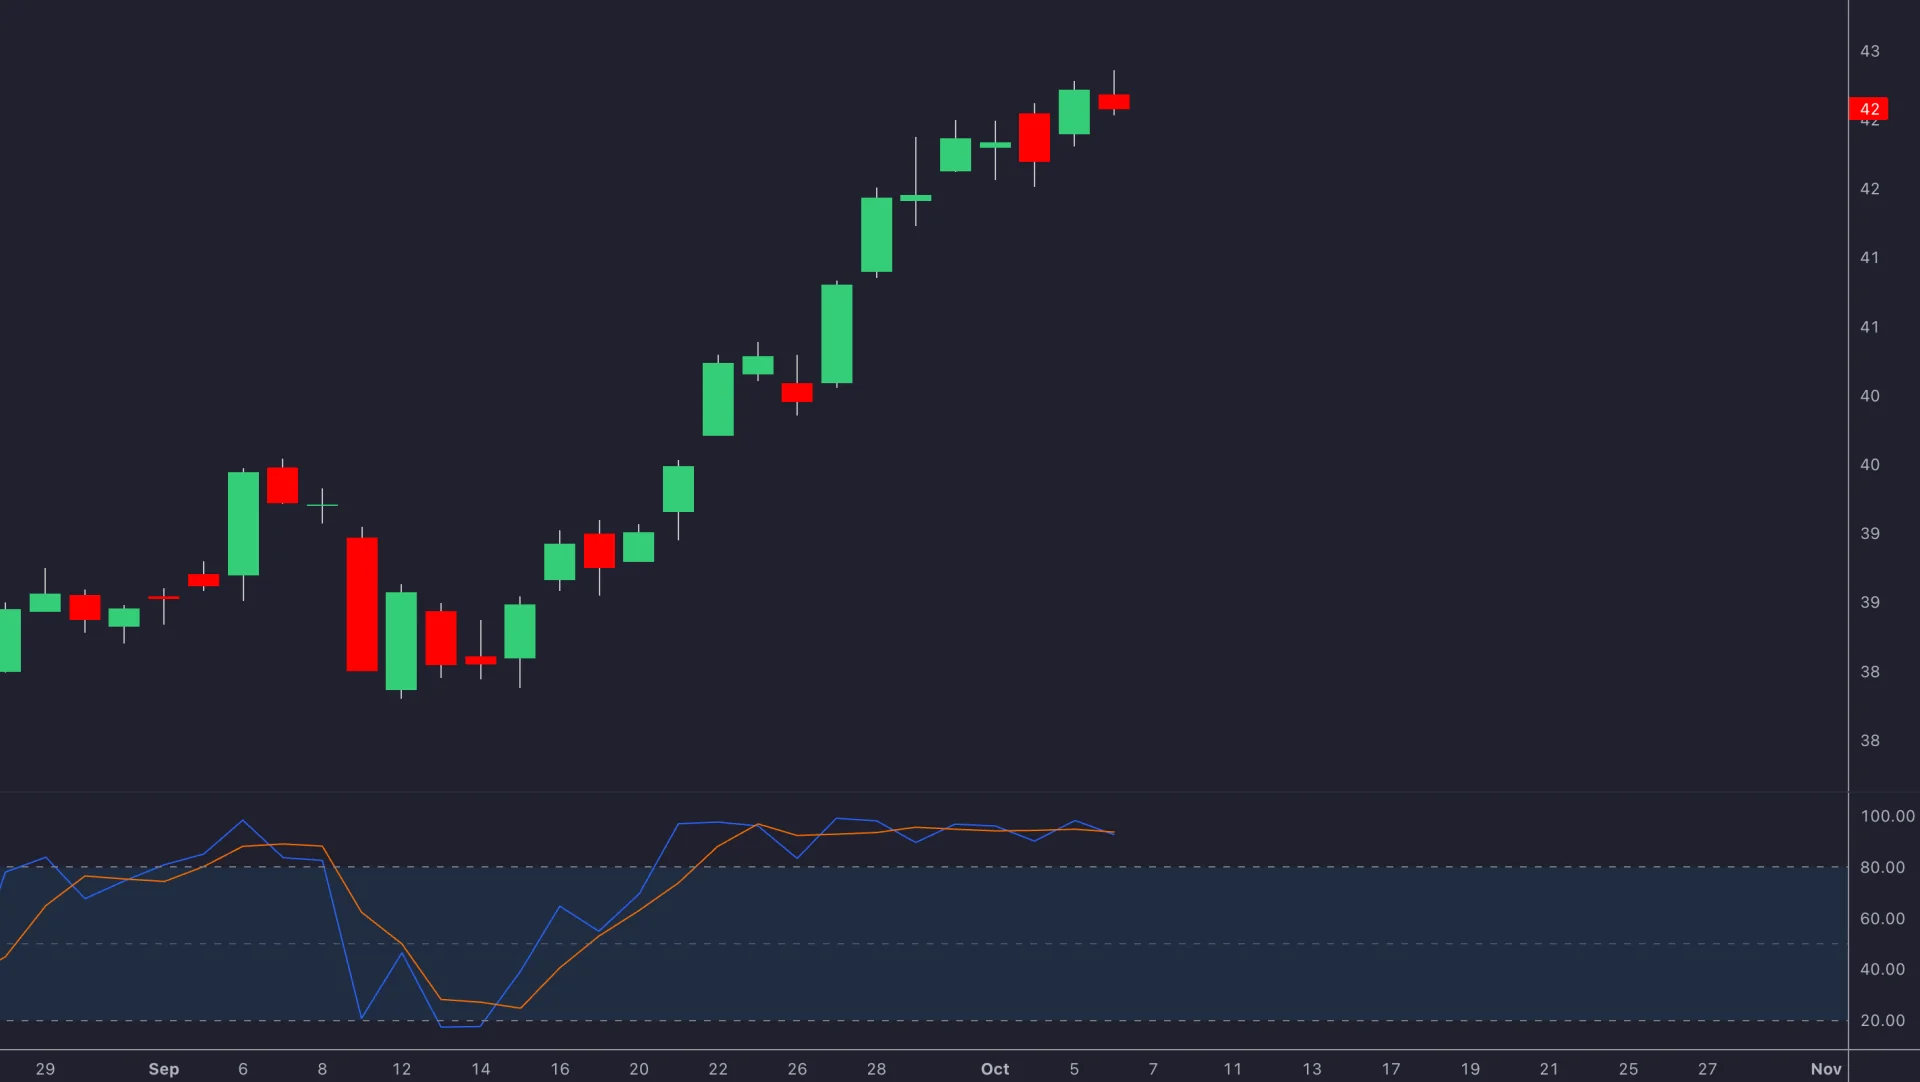
Levels such as 80 and 20 are conventional reference points, not automatic sell and buy instructions. Price can keep rising while the oscillator stays high, or keep falling while it stays low. Fidelity’s indicator guide explains the range-based measurement and distinguishes threshold and crossover signals.
Correction: define what has to happen after an extreme reading. A return above 20 is different from a %K crossover above %D below 20. Decide which event the strategy uses and whether it must occur on a completed bar.
2. Using Market Context Only After Seeing the Outcome
“It was a trending market” can become an explanation invented after a losing trade. If trend, volatility or support and resistance influence the decision, define how they are identified before evaluating the strategy.
| Context | Make it explicit | Avoid |
|---|---|---|
| Trend | A specified price or moving-average condition | Changing the trend label after a trade loses |
| Price level | A level known before the entry, with a defined tolerance | Using a later-confirmed swing as if it was already known |
| Volatility | A measured value and predeclared threshold | Assuming high volatility always requires shorter settings |
| Timeframe | The chart interval and completion rules for any higher-timeframe input | Using the eventual close of an unfinished higher-timeframe bar |
Correction: write the context filter alongside the entry rule and test its contribution. A trend-following strategy and a reversal strategy can use the same oscillator differently. Neither becomes valid merely because it has a context label.
3. Assuming More Indicators Must Improve the Strategy
A stochastic-only signal can be part of a fully specified strategy. The problem is an incomplete or untested process, not simply the number of indicators. Adding RSI, MACD and moving averages can create several views of the same underlying price data rather than independent confirmation.
Volume adds a different type of information, but first identify the source. Exchange volume, tick activity and other proxies are not interchangeable. A condition such as “volume is high” needs a numerical comparison and a defined lookback.
Correction: compare the base strategy with and without each proposed filter. Keep the test period, entry timing, exits and cost assumptions fixed. Record changes in trade count, average trade after costs, net results and drawdown. A filter that produces a prettier chart may still reduce useful opportunities or fit only one historical period.
Do not confuse agreement among indicators with a probability of success. Any claimed improvement needs evidence from the actual trading rule and evaluation method.
4. Confusing Stochastic Types with Parameter Choices
Fast, slow and full stochastic describe calculation and smoothing choices, not fixed categories for short-, medium- and long-term traders. A tuple such as 5,3,3 does not identify an implementation reliably unless the input order is specified.
In the conventional construction, fast %K starts from the unsmoothed range calculation and fast %D averages it. Slow %K uses that smoothed series, and slow %D smooths it again. Fidelity’s momentum walkthrough explains that relationship and why neither version is inherently better.
TradingView’s stochastic documentation names the range period, %K smoothing and %D period. Record those names when comparing configurations rather than relying on an ambiguous number sequence.
| Choice | What changes | What does not follow automatically |
|---|---|---|
| Shorter range lookback | The high–low comparison uses fewer bars | Better entries in a volatile market |
| More %K smoothing | The displayed line generally varies less abruptly | Fewer losing trades after costs |
| Different %D length | The comparison line and crossover timing change | A universally better confirmation signal |
| Different chart interval | Each bar represents a different observation window | The same numerical settings describe the same strategy |
Correction: keep a baseline and change one input at a time. Default settings are not automatically wrong. Record every trial, and evaluate the selected configuration on data not used to choose it. Avoid repeatedly retuning the rule after losses without a defined review process.
5. Ignoring When a Crossover or Divergence Becomes Knowable
A bullish crossover occurs when %K moves from at or below %D to above it; a bearish crossover is the reverse. If the rule evaluates completed bars, wait for the bar to close. A crossing visible during the bar may disappear before completion.
Divergence compares corresponding price and oscillator swings. Its traditional categories describe relationships, not guaranteed entries:
| Type | Price swings | Oscillator swings |
|---|---|---|
| Regular bullish | Lower lows | Higher lows |
| Regular bearish | Higher highs | Lower highs |
| Hidden bullish | Higher lows | Lower lows |
| Hidden bearish | Lower highs | Higher highs |
The important timing question is how each swing is confirmed. If a pivot needs three later bars, the signal cannot be available at the pivot itself. A label drawn backward on the chart must not become an entry at that earlier time in a backtest.
Correction: define pivot matching, minimum separation, confirmation delay and the action taken after confirmation. Do not assume that every divergence must be traded or that an extreme-zone crossover is more profitable. Those are hypotheses to evaluate.
Turn the Five Checks into a Quant Test
- Write the complete rule. Specify the stochastic implementation and inputs, context, completed-bar trigger, entry timing, exits and size.
- Ask Quant to identify missing assumptions. Review generated code and plotted events before running the strategy. Pay particular attention to higher-timeframe data and pivot confirmation.
- Set costs and risk limits. Review commission, slippage, capital and position sizing. An allocation percentage is not automatically the percentage at risk at a stop.
- Inspect individual trades. Check whether simulated fills and signal timestamps match the intended rule, then review net profit, drawdown, profit factor and trade count.
- Evaluate another period. Keep development trials separate from evaluation, and compare the chosen rule with the baseline.
A chart backtest does not prove live fill quality or deploy broker execution. Paper trading can add workflow evidence, while still differing from live liquidity and execution. Stops and modeled slippage also do not guarantee that an actual loss stays within the estimate.
Use the LuxAlgo Journal to review recorded trades and notes. Separate whether you followed the rule from whether a trade made money. Keep a signal log for opportunities that did not become trades.
A useful stochastic process is one you can explain and reproduce. Clear definitions, honest timing and realistic evaluation matter more than finding a configuration that looks perfect in hindsight.
FAQs
What is the best setting for a stochastic oscillator?
There is no universally best setting. Specify the range lookback, %K smoothing and %D length by name, then compare a limited set of configurations using the same entry, exit and cost assumptions. Evaluate the selected rule on a separate period. Fast and slow stochastic refer to smoothing constructions, not automatic recommendations for different trading horizons.
Read next