7 Mistakes Using Stochastic Oscillator in Swing Trades

The stochastic oscillator can help describe a swing-trading setup, but it cannot decide whether the trade is worth taking. Its readings need a defined entry, exit, risk budget and market context. Adding more indicators or changing settings after every loss can make the process less consistent.
Use LuxAlgo’s native charts and Quant, our coding agent, to inspect setups and test explicit rules. The seven mistakes below focus on interpreting the oscillator, comparing configurations fairly and avoiding assumptions that a historical chart cannot prove.
| Mistake | Better practice |
|---|---|
| Treating extremes as reversal orders | Separate the oscillator condition from a completed-bar trigger |
| Ignoring divergence context and timing | Define paired swings and when each becomes known |
| Assuming settings are universally right or wrong | Compare a small number of named configurations |
| Misusing multiple timeframes | Assign roles and use only available higher-timeframe data |
| Treating volume as automatic confirmation | Define the volume measure and test its contribution |
| Confusing trend and trade direction | Specify the strategy type and its invalidation |
| Choosing settings from sector stereotypes | Evaluate comparable instruments, costs and unseen periods |
1. Misreading Overbought and Oversold Levels
The stochastic oscillator measures the close within a recent high–low range. Values above 80 or below 20 are common extreme thresholds. They do not mean that a security is fundamentally expensive or cheap, or that its next move must reverse.
In a persistent uptrend, repeated closes near the upper end of the range can keep the oscillator elevated. In a decline, low readings can persist. The proportion of time spent in either region depends on the instrument, sample, interval and settings; there is no fixed bull-market or bear-market percentage to rely on.
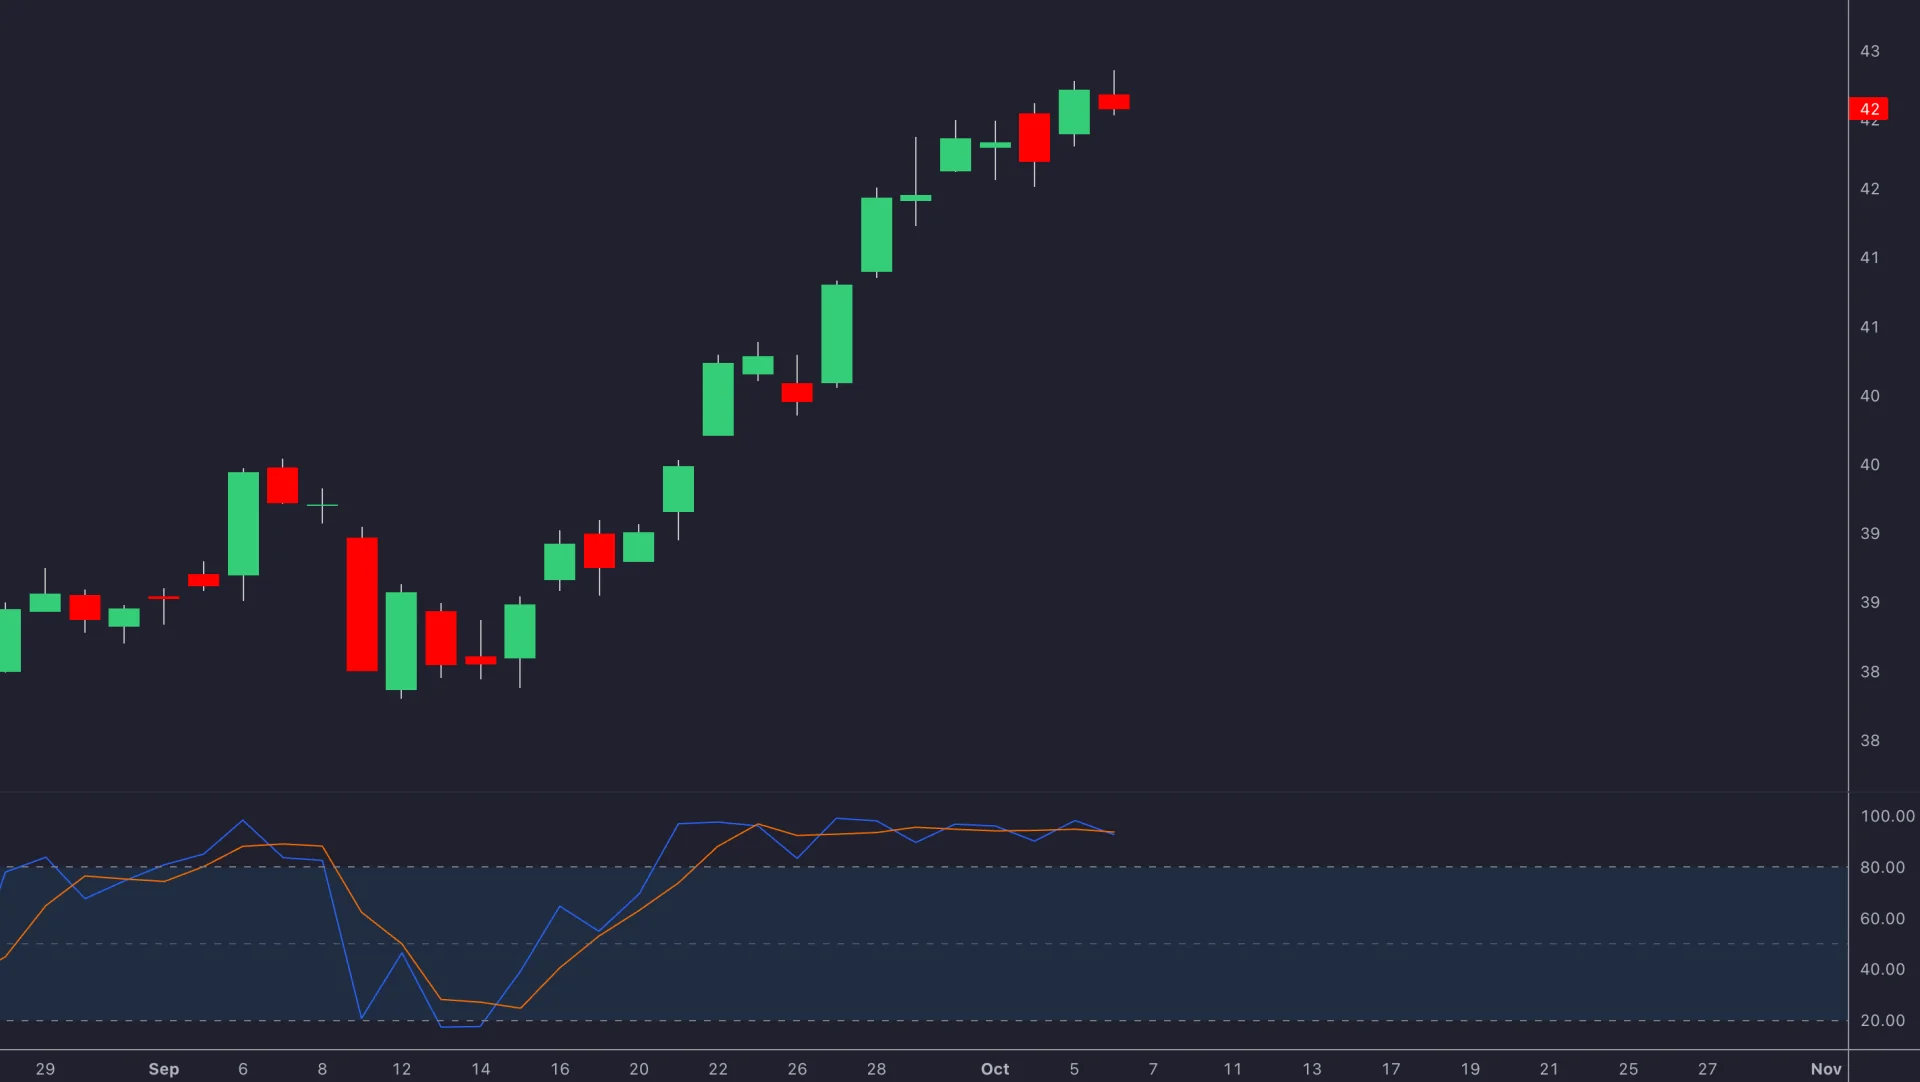
For a trend-pullback strategy, define a trend filter and then a completed-bar trigger. For a range-reversal strategy, define the range boundary and what invalidates it. A %K/%D crossover, a price close back inside a zone, and an oscillator crossing above 20 are different events; choose the event your strategy actually uses.
Moving thresholds to 85/15 makes the extreme condition narrower than 80/20. It does not automatically improve accuracy or remove noise. Compare the change while keeping the rest of the strategy fixed.
2. Ignoring Context and Confirmation Delay in Divergence
Regular bullish divergence pairs a lower price low with a higher oscillator low; bearish divergence pairs a higher price high with a lower oscillator high. These relationships can warn of a change in momentum without identifying when, or whether, price will reverse.
Specify which swings are paired and when they become available. If a pivot requires three later candles, the strategy cannot act on that confirmed pivot three candles earlier. A label placed retrospectively on a chart can look more timely than the information was in real time.
A trend measure, previously identified support or resistance, volume and broader market conditions can provide context. A 200-day EMA describes one price comparison, not the entire market regime. The VIX is a measure derived from S&P 500 options, not a direct forecast for every stock or a substitute for that stock’s own volatility.
Hidden divergence uses different relationships: a higher price low with a lower oscillator low for a bullish continuation hypothesis, or a lower price high with a higher oscillator high for a bearish one. It is not inherently more dependable than regular divergence. Compare each rule rather than combine their names into a generic confirmation signal.
Do not infer institutional identity from an oscillator, volume spike or delta reading. Also avoid treating a selected stock rally after divergence as proof of a repeatable result; a useful example records the failed signals and exact entry rules too.
3. Treating Settings as Universally Right or Wrong
Record the range lookback, %K smoothing and %D period by name. A 14-bar lookback with 3-bar %K smoothing and a 3-bar %D average is a baseline to evaluate, not a mistake simply because it is a default.
| Candidate range lookback | %K smoothing | %D period | Reason to compare |
|---|---|---|---|
| 14 | 3 | 3 | Baseline |
| 5 or 8 | 3 | 3 | Study a shorter range window |
| 21 | 7 | 7 | Study a longer window with more smoothing |
| 34 | 13 | 13 | Study substantially slower response and signal frequency |
These configurations are examples for testing, not validated assignments to ranging, trending or volatile markets. The rows that change several inputs compare complete configurations; isolate one input at a time if you want to know what caused the difference. Confirm the smoothing method and implementation as well.
A faster response can produce more activity and costs. More smoothing can delay a turn or remove trades you wanted. Frequent losses do not by themselves prove that the lookback needs changing; execution costs, entries, exits and market conditions may be responsible.
Ask Quant to implement a documented comparison, review the generated logic and inspect the trades. Changing inputs after seeing the result is strategy selection, so evaluate the chosen configuration on a separate period and keep a record of all variants tried.
4. Adding Timeframes Without Defining Their Roles
A single-timeframe strategy can be valid. Multiple timeframes add value only if their roles are explicit and their contribution survives testing. More charts do not automatically improve a swing trader’s results.
| Possible role | Example interval | Decision to define |
|---|---|---|
| Context | Weekly | Which completed-week condition permits a trade? |
| Setup | Daily or 4-hour | What price area and oscillator event qualify? |
| Execution timing | 1-hour or 30-minute | When is entry allowed, and when does the setup expire? |
A weekly oversold reading and a four-hour overbought reading describe different observation windows. Their disagreement does not, by itself, identify a pullback inside an uptrend. Establish the trend separately and define whether conflicting conditions mean skip, wait or proceed.
For a rule that uses completed weekly data, the current week’s final stochastic reading is unavailable before the week closes. Likewise, changing a chart from daily to hourly changes the bars behind a 14-bar lookback. See the timeframe and stochastic settings comparison for the distinction.
5. Treating Volume as Automatic Confirmation
Volume can describe participation, but high activity accompanies both successful and failed setups. A spike can occur around earnings, forced selling or a breakout that later reverses. Low volume does not independently establish an imminent reversal either.
Make the measure concrete. For a completed daily bar, a candidate rule could compare its volume with the average of the previous 20 completed sessions, excluding the signal day from the baseline. Specify a threshold before testing. Comparing part of today’s session with full prior days is a different measure and needs a time-of-day adjustment if that is the intended comparison.
Volume trends, unusually active turning points and expansion near a range boundary are hypotheses to evaluate. Compare the stochastic strategy with and without the chosen filter instead of assuming a published improvement percentage applies to your rules.
Check the feed. Stock volume may cover a particular venue rather than the consolidated market; cryptocurrency volume belongs to the selected exchange, and forex activity measures can be provider-specific. These series are not interchangeable.
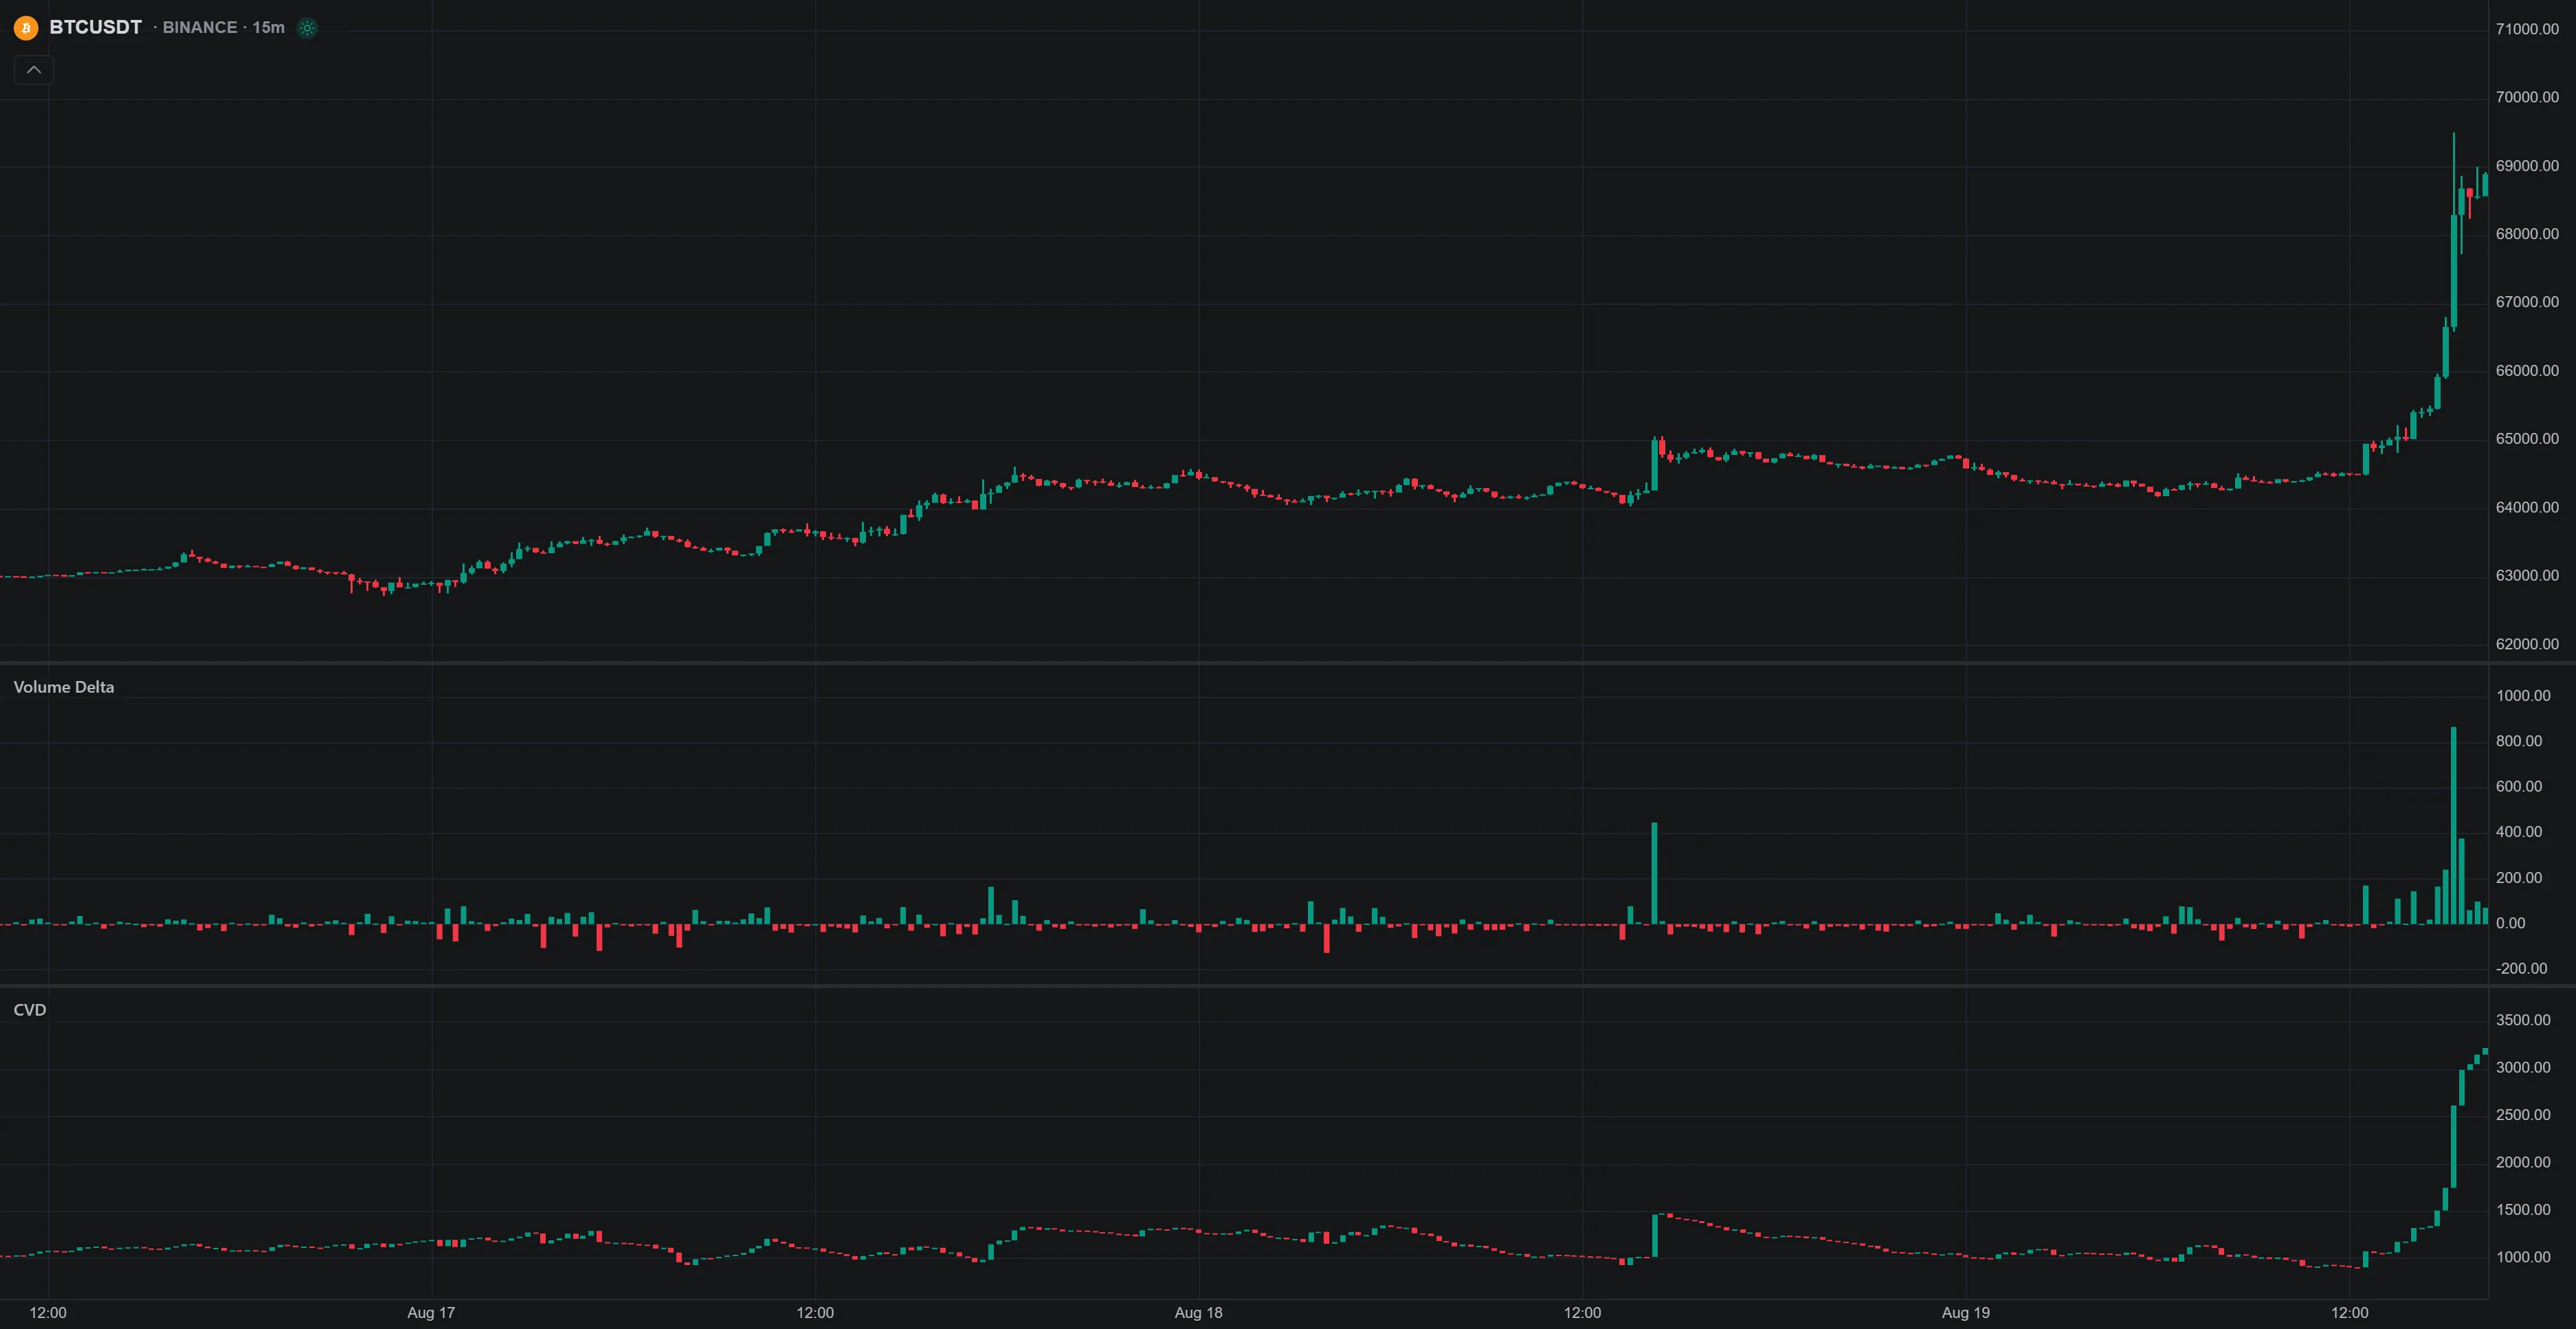
In supported native charts, Volume Delta and Cumulative Volume Delta use footprint buy and sell volume. Delta measures a difference in that data; it does not identify who traded or guarantee that price follows the imbalance. They require a footprint-capable symbol and fixed-duration bars; monthly timeframes are not supported. Review coverage, reset settings and available history before adding either to a swing-trading test.
6. Confusing Trend Direction with a Complete Trade Plan
A trend-following strategy and a countertrend strategy have different objectives. The mistake is switching between them after entry or assuming an overbought reading overrides a persistent advance. Define the trend filter before looking for the stochastic trigger.
A pullback-buying rule might require price above a chosen moving average before accepting a bullish oscillator event. A short-side continuation rule needs its own entry, exit and borrowing assumptions. ADX describes trend strength rather than direction, so it cannot independently tell you whether to buy or sell.
Do not widen a stop simply to keep a losing swing trade open. If an initial volatility-based stop is wider, reduce size to maintain the planned risk. For example, a hypothetical $100 price-risk budget permits 100 shares with a $1 stop distance, but only 50 shares with a $2 distance, before costs and execution allowances.
Swing trades can cross earnings announcements, overnight gaps, weekends and other events. A stop order does not guarantee its intended exit price. Record event exposure and maximum holding time in the original plan; a backtest based on smooth daily candles can obscure execution risk between sessions.
7. Choosing Sector Settings from Stereotypes
Technology, utilities and energy stocks can behave differently, but a sector name does not determine an optimal stochastic preset. Volatility changes within sectors, and market capitalization is different from sector classification. A quiet large-cap technology stock and a volatile utility can contradict a simple sector rule.
Presets such as 9,3,3 for technology, 21,9,9 for utilities or 21,7,7 for energy should therefore be treated as candidates, not recommendations. Compare them with a shared baseline under the same rules and costs. If changing thresholds to 85/15 or trying 14,5,5 around earnings, document that as a separate experiment rather than an automatic adjustment.
Include more than one instrument and more than one market period. Keep the evaluation set separate from the data used to choose settings, and account for delisted securities or a changing universe where relevant. Selecting only today’s surviving winners can exaggerate the apparent value of a sector-specific rule.
Quant can help implement the defined strategy and compare results, but it does not automatically establish a sector’s ideal parameters. Review net profit, profit factor, drawdown, trade count and individual trades together; a sparse sector sample can make an apparently strong result fragile.
Turn the Review into a Repeatable Workflow
- Choose one market, interval and clearly named stochastic implementation.
- Write the context filter, completed-bar trigger, entry timing, exits and position-sizing rule.
- Review the strategy Quant generates, including higher-timeframe availability and divergence confirmation delay.
- Set realistic costs and inspect successful and failed trades, including gaps.
- Compare limited variants, evaluate the chosen rule on another period, and record the selection process.
Use the LuxAlgo Journal to review recorded trades and notes, with a separate experiment log for tests. Library indicators, native Orderflow and Quant have different roles: displaying a signal, adding data context and implementing logic are not the same as validating a strategy or executing broker orders.
FAQs
What stochastic oscillator settings work best for swing trading?
There is no universally best preset. Start with a documented baseline such as a 14-bar range lookback, 3-bar %K smoothing and 3-bar %D average, then compare limited alternatives. Keep the interval, trading rules and costs explicit, and evaluate the selected configuration on data not used to choose it. Sector labels and extra timeframes do not establish an advantage by themselves.
Read next