Accumulation & Distribution: Uncover Trends
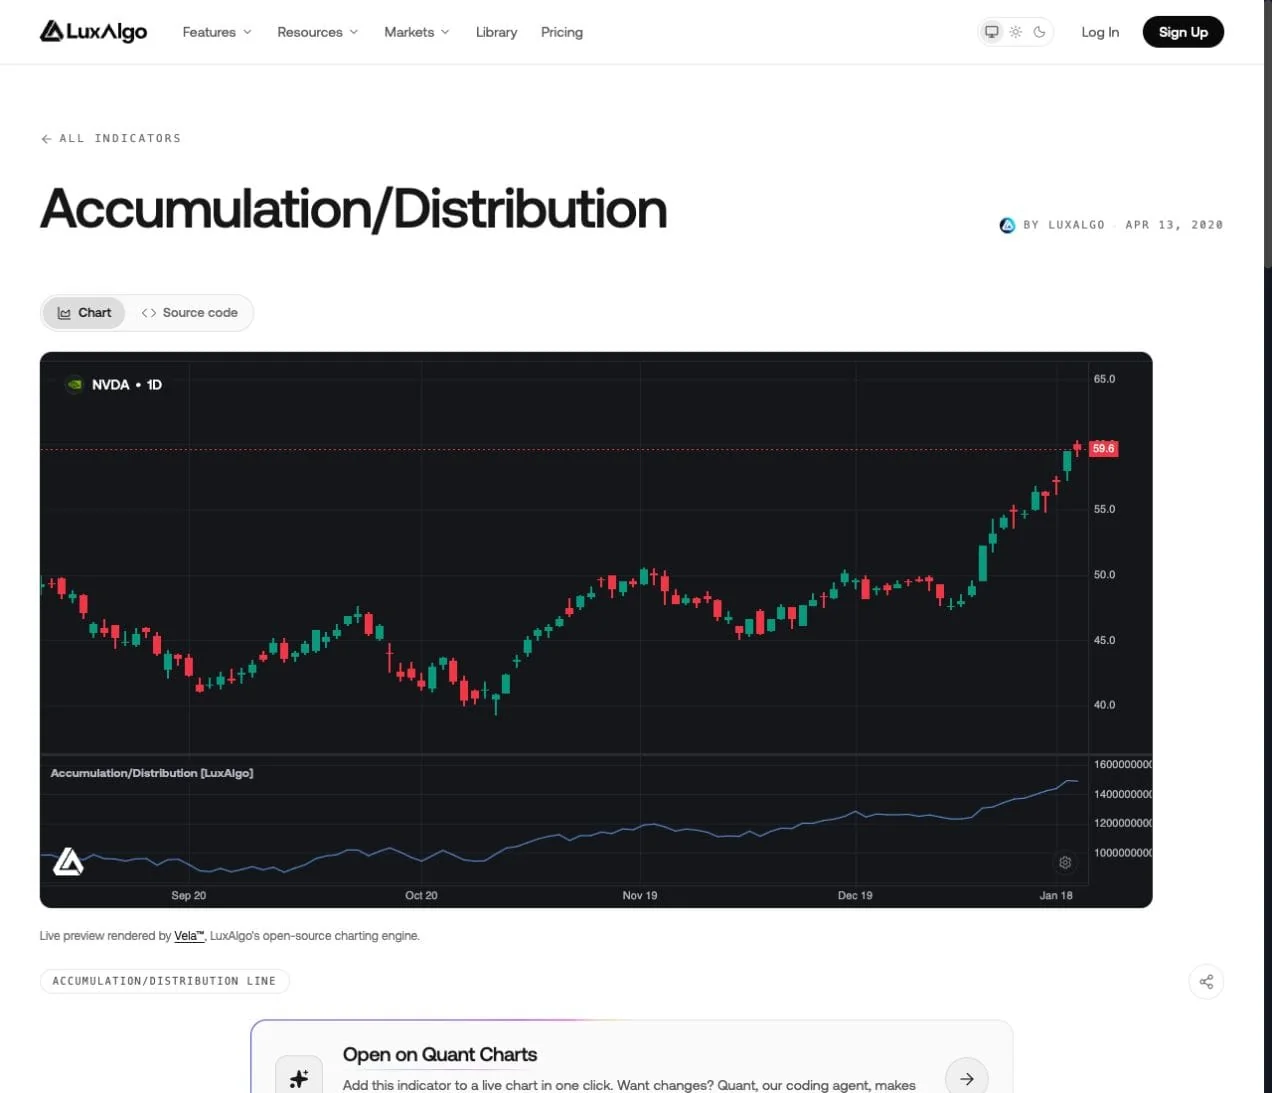
The Accumulation/Distribution (A/D) indicator combines a bar’s closing position with its volume to help you study trends and divergences. A rising A/D curve means the cumulative calculation is gaining value; it does not prove that institutions are buying or that price must rise next.
This guide explains the formula, a worked example, and the limits that matter when using A/D. You can explore the LuxAlgo Accumulation/Distribution indicator, then use Quant Charts to compare it with price and Quant, our coding agent, to develop explicit rules for testing.
- What it measures: volume weighted by where the close sits within each bar’s high–low range.
- Main uses: examining agreement with price trends and spotting bullish or bearish divergence.
- Main limits: gaps, incomplete bars, missing or venue-specific volume, and signals that never develop into reversals.
A/D Calculation: Math and Reading
Calculation Method
Marc Chaikin’s A/D curve is a cumulative calculation. For a bar with high H, low L, close C, and volume V:
- Money Flow Multiplier: ((C − L) − (H − C)) ÷ (H − L).
- Money Flow Volume: multiplier × V.
- A/D value: previous A/D + current Money Flow Volume.
For valid bars with a nonzero range, the multiplier runs from −1 at the low to +1 at the high. A close at the midpoint gives zero. These are mathematical weights, not measured percentages of buyers and sellers. Despite the term “Money Flow Volume,” this is not a dollar flow into an investment fund.
If H equals L, the division is undefined. Check how the implementation handles that bar; when specifying your own script, explicitly define its contribution, such as zero. Treat missing volume as missing evidence, rather than silently assuming normal activity. Changing the loaded history can shift the cumulative starting level, so absolute values from different charts are not directly comparable.
Sample Calculation
Consider a hypothetical day with a $50 high, $48 low, $49.50 close, and 100,000 shares of volume. Suppose the previous A/D value was 250,000.
- Multiplier = ((49.50 − 48) − (50 − 49.50)) ÷ (50 − 48) = 0.50.
- Money Flow Volume = 0.50 × 100,000 = 50,000.
- Updated A/D = 250,000 + 50,000 = 300,000.
The close is 75% of the way up the day’s range. The positive 0.50 weight credits half the bar’s volume to the cumulative total. It does not indicate balanced activity; the midpoint close of $49 would produce a zero contribution. Nor does 50,000 mean that exactly 50,000 shares were bought by a particular group.
Why Price Can Fall While A/D Rises
Keep the same example but suppose yesterday’s close was $52. Price has fallen $2.50, or about 4.81%, yet A/D adds 50,000 because today’s close is above today’s midpoint. The formula uses high, low, close, and volume, but does not compare today’s close with yesterday’s close.
This gap effect is a reason to inspect the candles before interpreting divergence. A/D also cannot reconstruct the sequence of trades inside a bar from those four inputs. StockCharts’ A/D explanation describes the distinction from On-Balance Volume (OBV), which assigns volume according to the close’s change from the previous bar.
Trend Analysis with A/D
Trend Agreement
When price and A/D both form higher swings, their directions agree. When both decline, weak closing positions weighted by volume accompany the falling price. Traders often call this confirmation, but it does not establish the probability that a trend will continue.
For example, on a hypothetical four-hour crude-oil futures chart, rising price swings alongside rising A/D would be consistent with an advancing trend. You still need the exact contract, session, dates, and entry rules before evaluating a trade; an undated chart anecdote cannot establish performance.
Bullish and Bearish Divergence
| Observation | Price swings | A/D swings | Practical interpretation |
|---|---|---|---|
| Bullish divergence | Lower low | Higher corresponding low | Investigate whether selling is losing momentum; wait for a defined price trigger. |
| Bearish divergence | Higher high | Lower corresponding high | Investigate weakening trend support; define a price trigger before acting. |
| Trend agreement | Rising or falling swings | Same direction | Additional context, not a guarantee of continuation. |
Compare corresponding swings over the same dates and use completed bars. If a pivot requires two later bars to identify it, a backtest can only use that pivot after those bars have closed. Marking the signal on the earlier pivot bar would make the setup look available before it actually was.
In a sideways market, A/D divergence may prompt closer attention near a range boundary, but there is no universal one- or two-week window that predicts a breakout. Strong trends can also continue through repeated divergences. News, earnings, and contract changes can alter the context quickly.
Combine A/D with a Clear Trading Plan
RSI, MFI, and Moving Averages
Give each additional study a specific job. Adding more indicators does not automatically improve accuracy, especially when they reuse the same price and volume inputs.
| Pairing | Question it can help answer | Limit to remember |
|---|---|---|
| A/D + RSI | Does price momentum agree with the setup? | Overbought or oversold readings can persist; they are not automatic exits or entries. |
| A/D + MFI | Does another price-and-volume calculation support the interpretation? | Shared inputs mean the evidence is not independent. |
| A/D + moving average | Does price meet a predefined trend filter? | Averages lag and can whipsaw when price fluctuates around them. |
Define the Trigger and the Risk
Separate the observation from the order. A bullish divergence could be a watch condition; a completed close above a predefined swing high could be the trigger. Decide beforehand what cancels the setup, where an exit belongs, and how long you will wait.
For a hypothetical stock trade, an entry at $50 with a planned stop at $48 risks $2 per share before costs. A $200 price-risk budget allows 100 shares, representing $5,000 of exposure. If price gaps to $47 and the exit fills there, the loss is $300 before fees. A stop does not guarantee its requested price. This sizing example is separate from the A/D calculation above and is not a recommendation.
Limits and Usage Tips
- Check the feed: exchange-specific volume describes that venue. LuxAlgo’s U.S. equities feed is Cboe EDGX and is not consolidated U.S. market volume; cryptocurrency volume also depends on the selected exchange.
- Keep sessions consistent: switching regular and extended hours changes the underlying bars and cumulative calculation. See the Quant Charts data documentation.
- Inspect forex volume definitions: tick activity and centralized futures contract volume are different measures. A related futures contract can provide context, but it is not interchangeable with spot-FX volume.
- Investigate flat or broken plots: check missing data, zero volume, midpoint closes, and display scale before assigning a market interpretation.
- Distinguish indicators: Chaikin A/D is not the advance–decline market-breadth line. It also does not identify Wyckoff phases or institutional ownership by itself.
Research an A/D Setup in LuxAlgo
LuxAlgo is a charting and AI platform. Start with the A/D Library page and its Open on Quant Charts action. Choose the exact symbol, interval, and session, then compare the indicator with price. The classic Library implementation is raw and cumulative: it has no length or sensitivity input and no smoothing; its plot color can be changed.
For custom rules, ask Quant, our coding agent, for a precise implementation. For example:
Build a study that calculates classic cumulative A/D, treats zero-range bars as a zero contribution, and warns when volume is missing. Highlight completed bars where A/D exceeds its value five bars earlier while price is above its 20-bar moving average. Keep the comparison window separate from the cumulative A/D calculation.
That is a research specification, not a validated edge. To turn it into a strategy, also specify entry timing, exits, position sizing, and costs. Follow the Making Strategies guide: inspect the generated code, then run it manually. Review the trades and backtest, compare with a simple baseline, and reserve unseen history for evaluation. Test realistic commission and slippage, rather than selecting the most attractive historical settings.
A/D alone does not provide automated divergence detection, live execution, or a profitable trading system. Check available markets and history against your current plan before designing a test.
Conclusion
A/D is useful when you understand exactly what it adds: closing position weighted by volume. Keep the worked formula, gap behavior, and feed limitations in view; use divergence to frame a question, then evaluate explicit price and risk rules. Quant Charts and Quant provide a route from visual inspection to a reproducible test, while the quality of that test still depends on its assumptions and data.
Frequently Asked Questions
What does the Accumulation/Distribution indicator measure?
It accumulates each bar’s volume weighted by the close’s position within its high–low range. It is not a direct measurement of institutional buying or selling.
What does a 0.50 money flow multiplier mean?
The close is 75% of the way up a nonzero bar range, so half the bar’s volume is added to A/D. A midpoint close produces a zero multiplier.
Can A/D rise while price falls?
Yes. A bar can close below the previous close but above its own midpoint. A/D can rise in that case because its formula does not use the previous close.
What are the best A/D settings?
The classic raw LuxAlgo A/D indicator has no length or sensitivity setting. Select the appropriate symbol, timeframe, session, and volume feed; custom smoothing or signal rules are separate choices.
Does A/D divergence guarantee a reversal?
No. Divergence may persist or fail. Define completed-bar price triggers, exits, and risk rules before testing a trading approach.
Can Quant help test an A/D strategy?
Yes. Specify the calculation and trading rules, inspect the generated code, and run it manually. Review costs, trade details, and performance on unseen history; historical results do not guarantee future performance.
References
LuxAlgo Resources
- Accumulation/Distribution Indicator
- LuxAlgo Quant
- Making Strategies with Quant
- Quant Charts Data and Sessions
External Resources
Read next