Accumulation Manipulation & Distribution (AMD) Trading Strategy
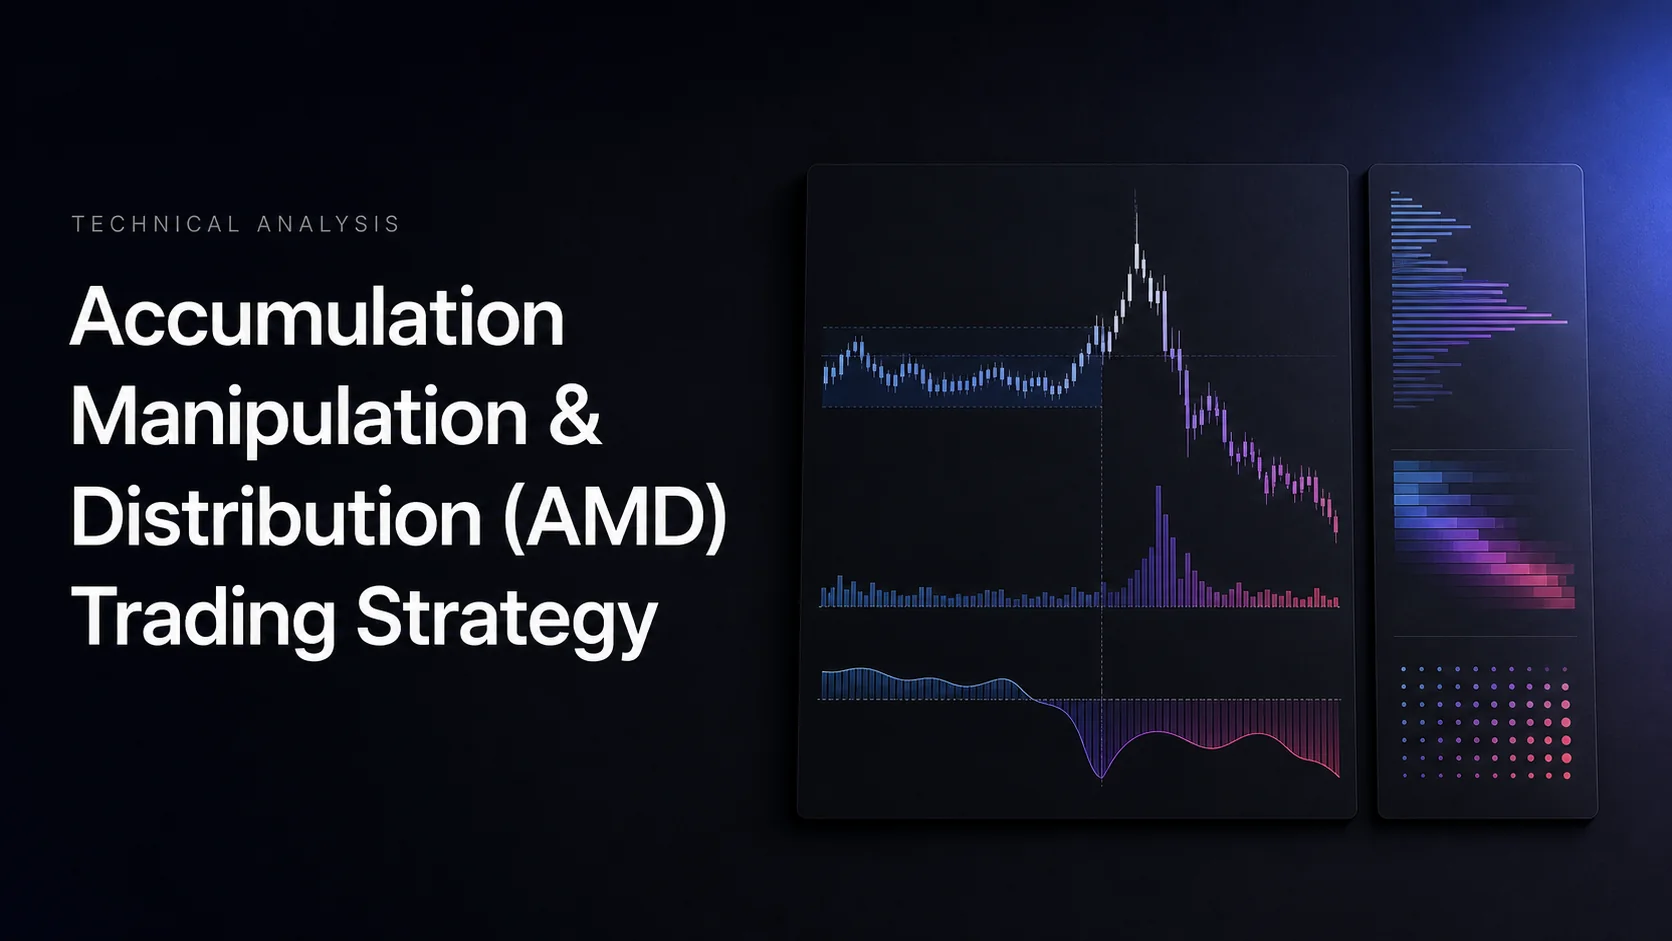
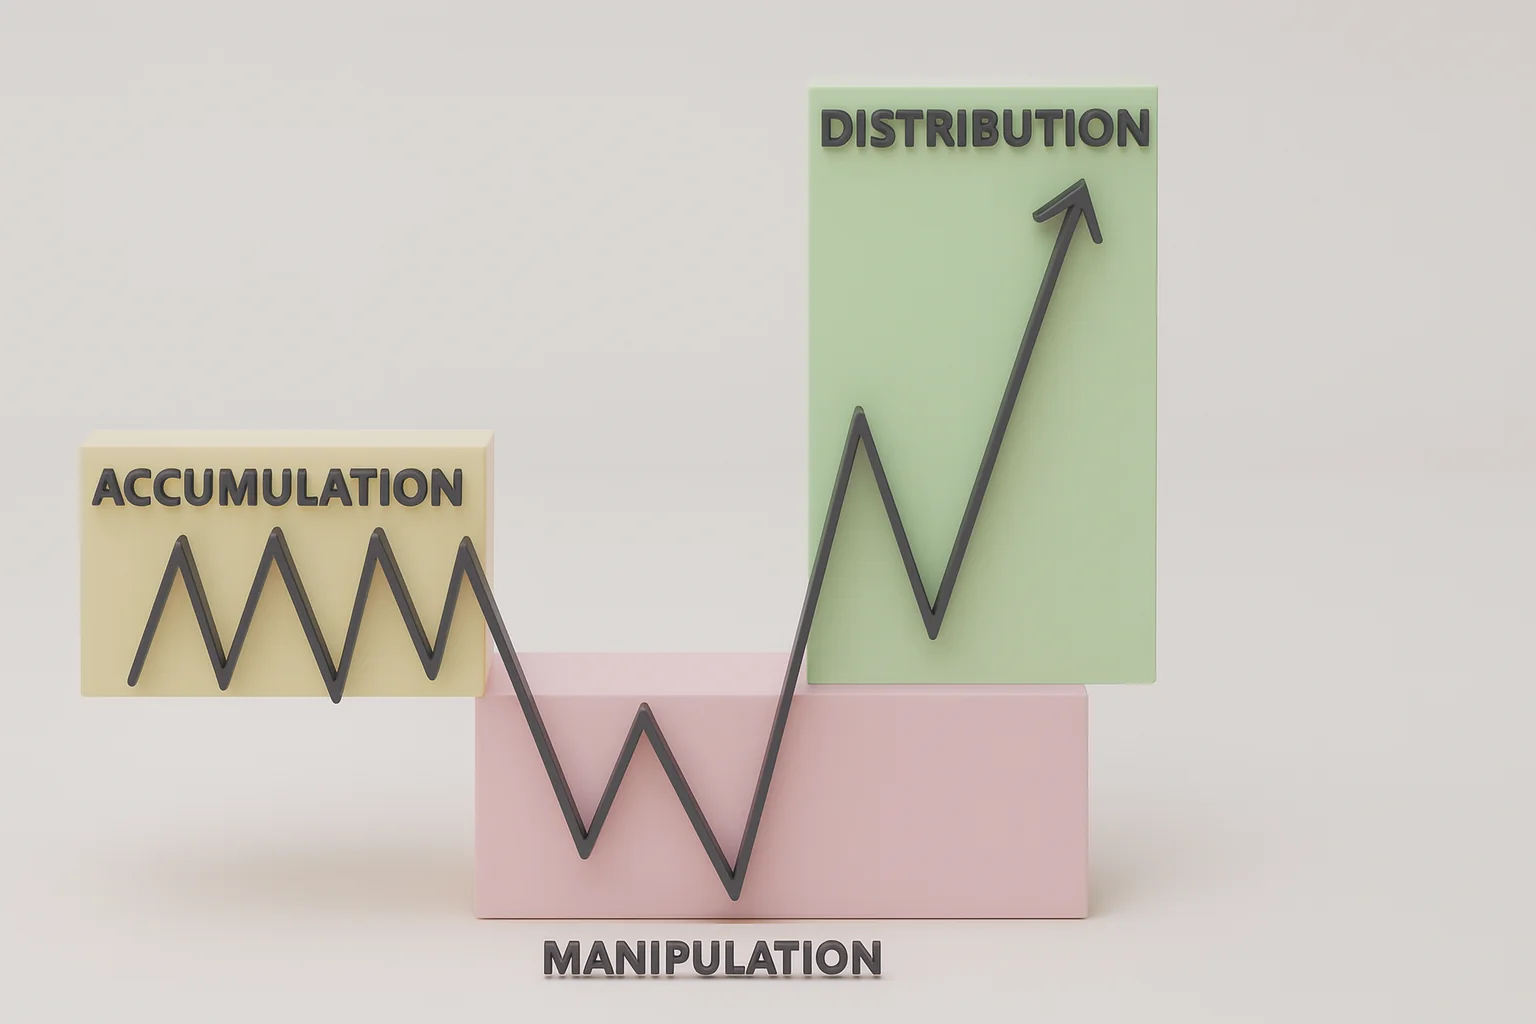
Accumulation, Manipulation & Distribution (AMD), also called the Power of Three in ICT trading, is a framework for a range, an initial move away from it and a subsequent directional expansion. It can organize a trading hypothesis, but it does not prove institutional intent or guarantee that every session will follow three neatly separated phases.
One terminology distinction matters immediately: in ICT’s AMD model, distribution can be an upward or downward expansion. In Wyckoff analysis, distribution generally describes a selling-oriented trading-range process. Treating both meanings as “institutions selling at the end of an uptrend” makes a bullish AMD example contradictory.
Use Quant Charts to inspect ranges and native AMD tools, then ask Quant, our coding agent, to help implement explicit timing, entry, exit and risk rules. This guide separates the observable price sequence from explanations about who caused it.
The Three Phases: Video Introduction
The retained video introduces the framework. Apply its terminology consistently and distinguish the information available during a setup from the completed pattern visible afterward.
The Three Phases of the AMD Framework
The LuxAlgo AMD concept guide describes an open-anchored template. Choose a daily, weekly or session opening price and define the period being analyzed. A midnight New York open, exchange-session open and broker daily candle can be different references; record the timezone and daylight-saving convention.
| Phase | Bullish example | Bearish example | What remains unknown |
|---|---|---|---|
| Accumulation | A defined range near the selected open | A defined range near the selected open | Whether the range will break or persist; who is building positions |
| Manipulation | An initial move below the range that later reclaims it | An initial move above the range that later falls back | At the initial break, whether it is a failed move or continuation |
| Distribution | Expansion upward away from the downside extreme | Expansion downward away from the upside extreme | How far the expansion will travel and whether the trade will profit |
Accumulation Phase: Define the Range
Start with observable conditions: a selected number of completed bars within a maximum range, repeated tests of boundaries and limited directional follow-through. A tight range may be consistent with position building, but price and aggregate volume do not establish that institutions are quietly buying.
Higher volume on up days, quieter down days and repeated support reactions can be additional observations. Define the comparison window and test whether they add information. Bearish sentiment or sparse news coverage is not required for every accumulation range, and neither reveals the identity of buyers.
The earlier Matador Resources example linked executive buying in November 2020 with later outperformance. A company homepage does not substantiate the transaction dates, subsequent return comparison or an AMD sequence. If using insider transactions in research, verify the dated filings and evaluation period; a disclosed purchase alone does not confirm a range or predict the next two years of returns.
Manipulation Phase: An Initial Break Is Not Yet a Failed Break
A move through a range boundary can trigger resting orders and attract breakout entries. The AMD hypothesis looks for that move to fail and for price to return through a defined level. At the first breakout, the later failure is not known. Some sessions continue in the initial direction instead.
The chart label “manipulation” is a term within the model. It is not a finding of wash trading, spoofing, front-running or a pump-and-dump scheme. Those are separate conduct questions requiring evidence beyond a candle pattern. Likewise, an executive statement followed by volatility does not by itself establish an AMD phase or unlawful behavior.
Check material news at its source, define a reclaim or displacement condition and wait for the information required by the strategy. Multiple indicators may be correlated, so agreement is not independent proof. A completed signal can still lose.
Distribution Phase: Directional Expansion
In a bullish AMD hypothesis, price reclaims the range or opening reference and expands upward. The bearish model reverses that sequence. Define the confirmation used: a close through the open, an opposing swing break, a measurable displacement or another explicit condition.
Do not use an end-of-session close near the high as information available to an earlier entry. That close may make a completed day resemble the template, but it cannot validate a trade in real time. Record patterns that fail to complete as well as textbook examples.
A later loss of momentum, opposing structure break or target can support a planned exit. It is not necessary to rename every pullback “distribution selling.” Range trading at the boundaries is a different entry model from joining expansion after a reclaim, with different execution and risk.
Technical Analysis for Identifying AMD Phases
Volume-Price Analysis
Volume measures activity in the selected feed. Rising activity on up moves or down moves can help describe participation, but every executed trade has a buyer and seller. Aggregate bar volume does not tell you which participants are accumulating inventory or whether an initial break was deliberate.
Compare completed bars with a defined baseline. An intraday relative-volume filter should account for the time of day or use comparable intervals. Do not use a session’s eventual total when testing a morning decision. Thin markets can show dramatic relative-volume changes from a small absolute base.
Forex tick volume, a single crypto venue and exchange-traded futures volume are different measurements. A spike during a failed break can be recorded as part of a hypothesis; it is not a universal leading signal or confirmation of the next phase.
Wyckoff Springs, Upthrusts and AMD
A Wyckoff spring describes a move below trading-range support that returns into the range; an upthrust describes a move above resistance that fails. These patterns can resemble an AMD false move, but the broader Wyckoff schematic and its volume analysis should not be collapsed into a single three-stage session model.
| Observation | Possible use | Avoid assuming |
|---|---|---|
| Range with repeated support reactions | Define a boundary and candidate accumulation context | That buying is institutional or a breakout is inevitable |
| Spring or downside reclaim | Define a bullish reversal hypothesis | That a later rally was knowable at the sweep low |
| Upthrust or upside failure | Define a bearish reversal hypothesis | That every resistance breach is a trap |
| Lower highs and weakness after a rally | Consider Wyckoff-style distribution or an exit rule | That ICT distribution always means a bearish phase |
Separate a wick through a boundary from a completed close beyond it. Define how a swing confirms and whether subsequent bars are required. Stop placement beyond a range may reduce some ordinary fluctuations, but it also changes position size and does not prevent losses from gaps or continued trends.
LuxAlgo Tools for AMD Analysis
Native Ultimate AMD on Quant Charts
The Ultimate AMD Indicator provides a specific implementation, using state-based rules to follow consolidation, breakout and distribution. Its accumulation condition uses a lookback and a maximum percentage range. The labels describe that algorithm; they do not identify participants or prove a false move in advance.
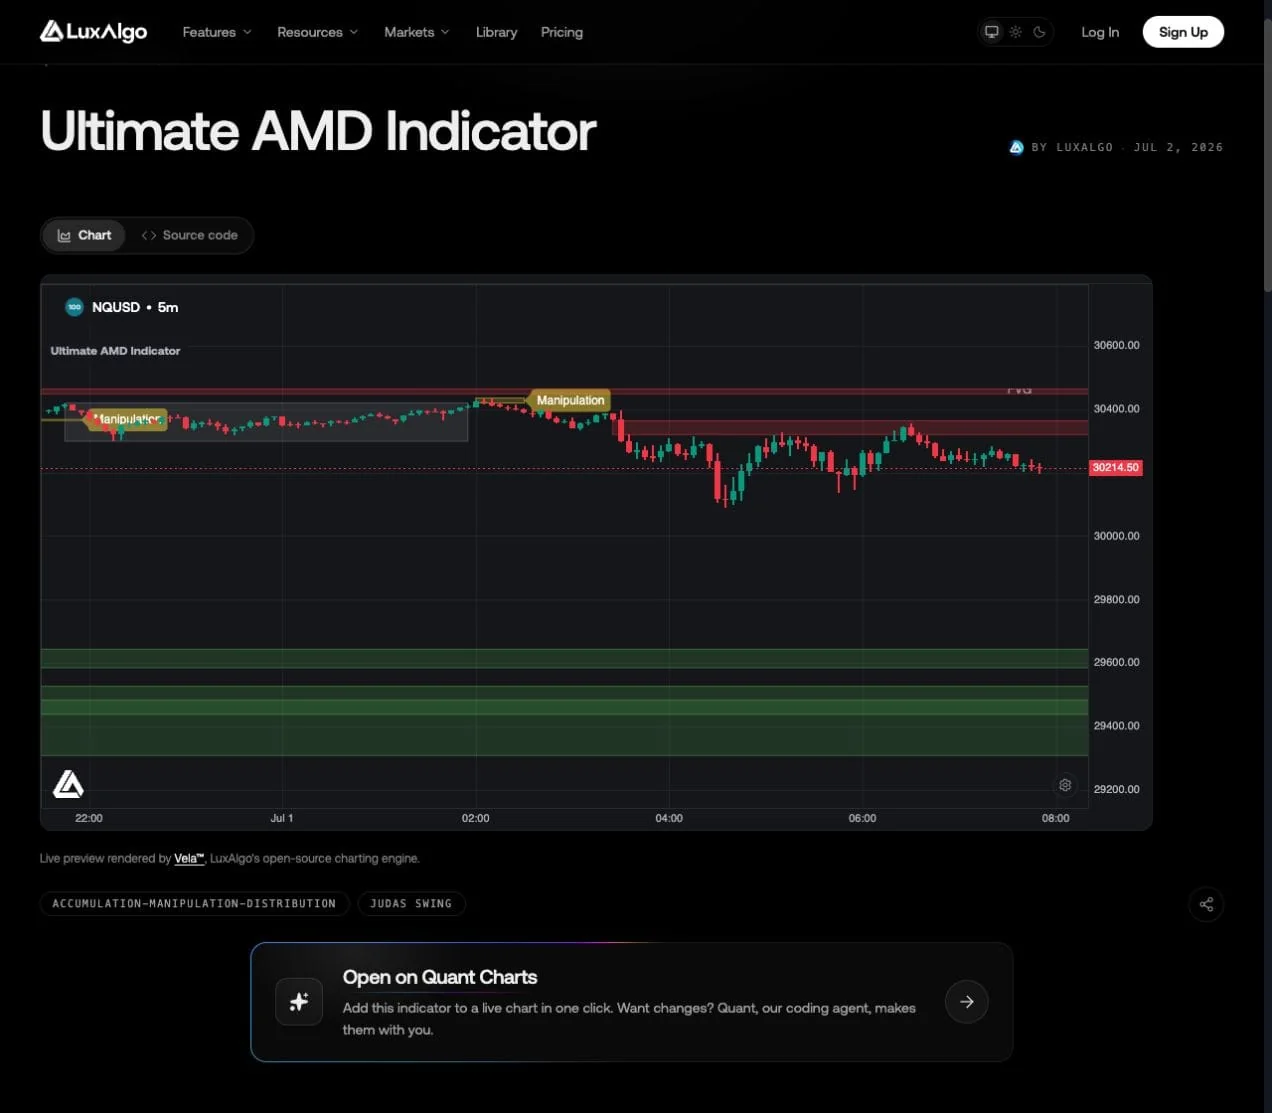
Documented settings include Accumulation Length, Accumulation Max Range (%), Breakout Type (Wicks, Bodies or Both), and Max Manipulation Length in bars. FVG and inverted-FVG controls include visibility, an ATR significance filter and limits on displayed objects. The product also documents alerts for a new accumulation zone and a manipulation breakout.
Open the native Library preview on Quant Charts and inspect the chosen settings. A generic open-anchored ICT template and this indicator’s range-detection algorithm need not classify every bar identically. A breakout alert is not confirmation that the subsequent distribution trade will succeed.
The displayed NQUSD preview is the product’s chart example. Do not assume its feed or contract economics match a specific CME NQ futures expiry. Verify the instrument used in the actual strategy and backtest.
Other Library tools can add context on the same Quant Chart: market-structure and zone tools, and momentum, money-flow and divergence tools. Choose a small number of relevant conditions and confirm each one is actually available to the strategy. Where a tool draws divergence lines retrospectively, test entries from the detection time, not the line’s origin. None of these tools detects unlawful manipulation or proves which breakout is genuine.
Applying the AMD Strategy in Trading
Entry and Exit Point Timing
- Choose context: define the completed daily or four-hour condition, such as a close beyond a specified resistance level.
- Anchor the period: mark the chosen session open and the rule that determines its initial range.
- Wait for the sequence: record a boundary breach, then require the defined reclaim, displacement or opposing structure break.
- Specify execution: use the next permitted market fill or a pullback limit, with an expiry and cancellation rule.
- Manage the trade: apply the predetermined stop, target, partial exits and maximum holding period.
Five- or 15-minute charts can supply entry detail while a higher timeframe defines context. A developing higher-timeframe candle is not its eventual final value. A missed initial entry does not justify chasing; a later structure break and pullback is a new entry rule with a new reward-to-risk calculation.
Risk Management Best Practices
Calculate contracts from the actual entry-to-stop distance, the instrument’s point value and the planned account risk. Wider stops require smaller size to preserve the same budget. If even one contract exceeds the budget, the position does not fit that specification.
Standard stop orders do not guarantee the intended execution price. Some broker products offer separately specified guaranteed-stop features, but these are not a universal property of exchange-traded futures. Check the particular product and terms before assuming gap protection. Cap correlated exposure and maintain sufficient margin rather than treating margin as the maximum possible loss.
Worked NQ Example: A Hypothetical Bullish Sequence
Suppose a predefined early-session range is 20,000–20,020 and the chosen open is 20,010. Price moves below the range to 19,990, then a completed qualifying candle reclaims 20,010. The permitted long entry fills at 20,012, with a stop at 19,988 and target at 20,060. These are hypothetical prices, not a historical performance claim.
CME’s E-mini Nasdaq-100 specifications give NQ a $20-per-index-point multiplier and an outright minimum tick of 0.25 points, worth $5. Use those values, not a stock share-sizing formula.
| Item | Calculation | Interpretation |
|---|---|---|
| Risk per contract | (20,012 − 19,988) × $20 = $480 | 24 points, or 96 ticks, before costs |
| Illustrative account budget | $50,000 × 1% = $500 | One contract fits the price-risk budget; costs still need allowance |
| Target reward | (20,060 − 20,012) × $20 = $960 | 48 points, or 192 ticks; 2R gross reward |
| Stop executes at 19,980 | (20,012 − 19,980) × $20 = $640 loss | About 1.33R before fees |
| Entry instead at 20,020 | 32-point risk versus 40-point reward | Risk $640 and reward $800; 1.25R and no longer within the $500 budget |
One NQ contract at 20,012 represents $400,240 of notional index exposure. That differs from both the required margin and the $480 planned price risk. The example illustrates why a seemingly small percentage budget does not make leverage or gap risk disappear.
A planned scale-out can reduce exposure as the expansion develops, but record quantities and realized prices. Lower highs or weakening momentum may trigger a separate exit condition; they do not need to redefine the bullish distribution phase as institutional selling.
Backtesting and Improving the AMD Strategy
Define What Was Knowable
Write the range length, open anchor, breakout method, maximum phase duration and confirmation sequence before reviewing outcomes. Count invalidated patterns and failed reclaims. Labeling only completed winning sequences as AMD introduces hindsight bias.
Test across ranges, trends and abrupt transitions. Include commissions, spread, slippage, gaps and order expiry. Review trade count, expectancy, drawdown, exposure and results by period. A backtest evaluates the specified historical model; it does not validate every interpretation of AMD or guarantee improved drawdown control.
Implement and Review with Quant
Ask Quant to help implement the complete rules, inspect Code and click Run yourself. Follow Making Strategies with Quant and the native backtest guide. Verify that the required indicator logic and data are available to the runtime; a visible marker is not automatically a callable strategy input.
Use chronological training, validation and untouched test periods. Check nearby parameters and the sensitivity to execution costs. For example, 40% wins averaging 2R and 60% losses averaging 1R yield +0.20R gross expectancy; costs of 0.10R reduce it to +0.10R. The same target at a 30% win rate yields −0.10R before costs.
Adjusting for Different Markets
Forex, crypto, equities and futures have different sessions, feeds and contract economics. Crypto trading through weekends does not imply every crypto setup needs wider stops than every equity setup. Equities can gap around earnings, and futures have scheduled sessions, maintenance breaks and contract expiries.
Define each market’s opening reference and execution assumptions explicitly. Do not assume stocks display clearer AMD patterns or that session labels force Asia to accumulate, London to manipulate and New York to distribute. Compare the hypotheses in the relevant data and record exceptions.
Conclusion: Use AMD as a Testable Framework
AMD can organize a range, a potential failed move and a subsequent expansion. The useful work is specifying what confirms each transition and when an order is permitted. The chart alone does not reveal institutional motives or establish that a sweep was unlawful manipulation.
Inspect native AMD tools on Quant Charts and use Quant to help test explicit rules. Preserve failed setups in the record, size from actual execution prices and evaluate results after costs. Consistency of definition matters more than finding a convincing label for every completed chart.
FAQs
Does distribution in AMD always mean institutions are selling?
No. In ICT’s AMD or Power of Three template, distribution is the directional expansion and can be bullish or bearish. Wyckoff distribution uses a different selling-oriented context. State which framework is being used.
How can traders identify AMD while it is developing?
Choose an opening reference and explicit range, breakout and reclaim rules. Use only information available at each decision. The final session close and later follow-through cannot be used to validate an earlier entry.
Does a liquidity sweep prove illegal market manipulation?
No. A price pattern does not establish who placed orders or their intent. The manipulation label in an AMD model is distinct from a supported finding of unlawful conduct.
How can LuxAlgo help analyze AMD?
Inspect the native Ultimate AMD Indicator on Quant Charts and its range, breakout and duration settings. Ask Quant to help implement a complete strategy, inspect Code and click Run.
Can wider stops make an AMD trade safe?
Wider stops increase the loss per contract unless quantity is reduced. Standard stops can execute at worse prices, and correlated positions can lose together. Check point value, costs, margin and total exposure.
Does a completed AMD sequence guarantee a profitable trade?
No. Profitability depends on entry and exit rules, realized wins and losses, costs and execution. Include incomplete sequences, failed reclaims and out-of-sample periods when evaluating the model.
References
LuxAlgo Resources
- Quant Charts
- LuxAlgo Quant
- AMD / Power of Three Concept Guide
- Ultimate AMD Indicator
- Making Strategies with Quant
- Native Backtest Guide
External Resources
Read next