Accumulation & Distribution Line: Basics Explained
The Accumulation/Distribution Line (ADL) is a cumulative indicator that weights each bar’s volume by where the close sits within that bar’s high-low range. It is a proxy for buying or selling pressure, not a measurement of actual cash entering or leaving a stock. A rising ADL means positive weighted contributions have exceeded negative ones over the period examined.
Traders compare its direction and swings with price to investigate trend agreement or divergence. The calculation does not use the previous close, so the ADL can rise even when price gaps down. That limitation matters as much as the signal itself.
- Calculate: locate the close within the bar, multiply by volume, and add the result to the running total.
- Interpret: compare changes in ADL with comparable price swings, rather than treating its absolute level as a threshold.
- Check: confirm the volume feed, time frame, loaded history, and treatment of missing or zero-range bars.
- Test: evaluate explicit rules in native LuxAlgo charts, with costs and a separate test period.
Calculation of the Accumulation/Distribution Line
Money Flow Multiplier
For a bar with a nonzero high-low range, the money flow multiplier is:
MFM = [(Close − Low) − (High − Close)] ÷ (High − Low)
The equivalent numerator is 2 × Close − High − Low. With valid prices inside the bar’s range, the multiplier runs from −1 to +1. It is +1 when the close equals the high, −1 when the close equals the low, and zero at the midpoint. A zero reading describes close location; it does not prove that the market was neutral or that buying and selling interest were balanced.
Money Flow Volume
MFV = MFM × Bar Volume
If the multiplier is 0.5 and volume is 1,000,000 shares, the contribution is 500,000 weighted volume units. It is not $500,000 of capital inflow. The formula does not multiply by transaction price or classify the buyer and seller behind each execution.
The Running ADL Total
Current ADL = Previous ADL + Current MFV
The result accumulates from the starting point used by the chart or implementation. A different initial history can shift the displayed total. Standard ADL is not a rolling 14- or 20-bar oscillator, and it has no fixed overbought or oversold levels. The ADL calculation reference describes its close-location basis and the effect of ignoring changes between bars.
A Three-Bar Worked Example
Start the running total at zero for this hypothetical calculation:
| Bar | High / Low / Close | Volume | MFM | MFV | Running ADL |
|---|---|---|---|---|---|
| 1 | 110 / 100 / 107.5 | 1,000,000 | 0.5 | 500,000 | 500,000 |
| 2 | 108 / 100 / 102 | 800,000 | −0.5 | −400,000 | 100,000 |
| 3 | 106 / 100 / 103 | 600,000 | 0 | 0 | 100,000 |
For bar 1, [(107.5 − 100) − (110 − 107.5)] ÷ 10 = 0.5. Bar 2 contributes −400,000 because its close is in the lower quarter of the range. Bar 3 adds zero because its close is exactly at the midpoint. Its trading volume was not zero; its weighted contribution was.
When High equals Low, the formula would divide by zero. LuxAlgo’s current Library implementation explicitly assigns a zero contribution to that flat bar. Missing volume is a different data problem: do not silently treat unavailable activity as evidence of no activity. Inspect the source and data coverage before comparing reports.
Interpreting the Accumulation/Distribution Line
Trend Analysis with ADL
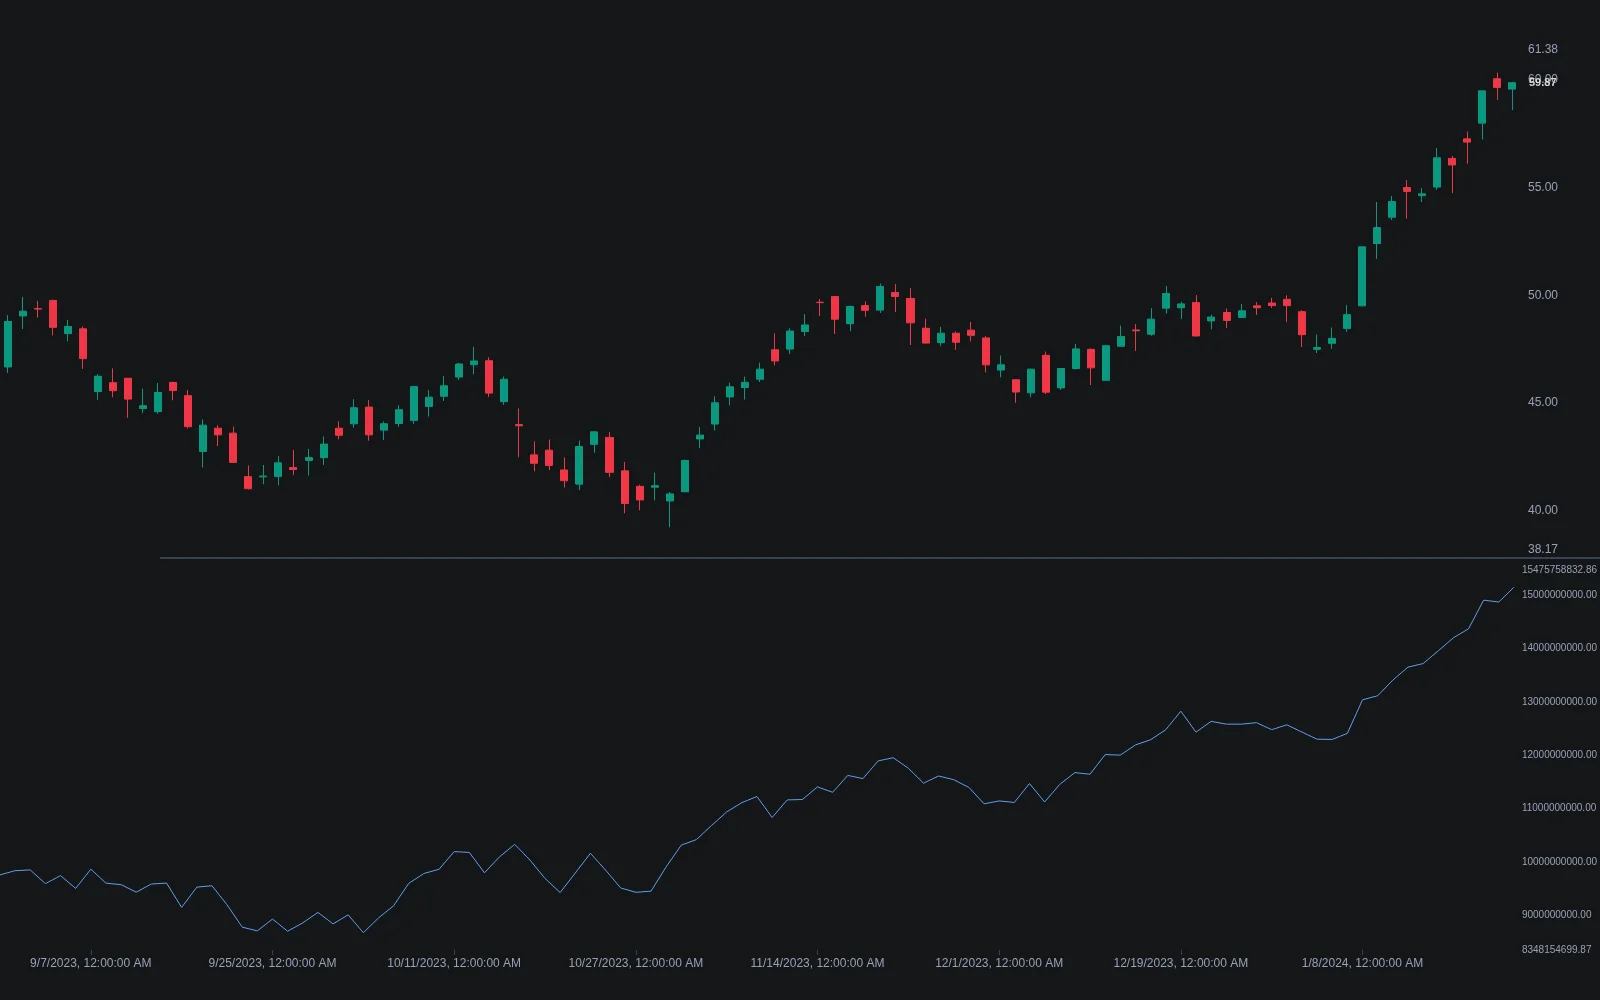
When price and ADL form higher highs and higher lows together, the indicator agrees with the upward price structure. Falling price and falling ADL show agreement in the other direction. These observations describe the sample; they do not guarantee continuation or establish an accuracy rate.
A steeper plotted slope is not a universal measure of stronger sentiment. The scale depends on trading volume, the chart’s vertical axis, and the selected time frame. A large-volume bar can cause a large step. Compare the same instrument and data basis, and inspect the bars responsible for the change.
Spotting Divergences with ADL
| Observation | Price behavior | ADL behavior | Interpretation to investigate |
|---|---|---|---|
| Bullish divergence | A lower comparable low | A higher comparable low | The indicator is not following the new price low |
| Bearish divergence | A higher comparable high | A lower comparable high | The indicator is not following the new price high |
| Directional agreement | Rising or falling structure | A similar direction over the same interval | Price and this volume-weighted measure agree |
Choose the swing points and comparison interval before evaluating the result. Divergence can persist while price continues its original trend. If you use pivots that require later bars to confirm, the signal is available only after those bars close; it was not necessarily known on the candle where the pivot is plotted. See the swing-point timing guide.
A divergence is a reason to investigate price structure or risk, not an automatic order. Define the separate entry trigger, the conditions that reject it, and how long the idea remains valid. Testing only obvious successful examples after the reversal introduces selection bias.
Why ADL Can Rise When Price Falls
Suppose the previous close was 110. The next bar gaps lower, with a high of 102, low of 98, close of 101, and volume of 1,000,000. Price is down 9 from the previous close, yet MFM is [(101 − 98) − (102 − 101)] ÷ 4 = 0.5. ADL therefore increases by 500,000.
The result is not a calculation error: the close is in the upper part of the new bar’s range. ADL does not directly include the gap from 110. Read the price chart alongside the indicator and avoid interpreting a positive contribution as proof that holders gained value.
Comparing ADL with Other Volume Indicators
| Indicator | Core calculation | Time treatment | Key distinction |
|---|---|---|---|
| ADL | Sum of close-location multiplier × volume | Cumulative from the starting history | Uses the close within each bar’s range |
| OBV | Add or subtract full volume based on close-to-close direction | Cumulative | Uses whether the close rose or fell from the previous close |
| CMF | Sum of MFV ÷ sum of volume over N bars | Rolling window | Normalizes the same close-location contributions over a stated lookback |
In the gap-down example above, standard OBV subtracts the full 1,000,000 volume because the close fell from 110 to 101, while ADL adds 500,000. Neither calculation is measuring literal net cash flow. They transform the same price and volume inputs differently; disagreement is not proof that one is broken.
Chaikin Money Flow uses a rolling total of MFV divided by rolling volume. For the three example bars, an illustrative three-bar CMF is (500,000 − 400,000 + 0) ÷ (1,000,000 + 800,000 + 600,000) ≈ 0.0417. The ADL total is 100,000, so the two displayed values are on different scales. CMF is not restricted to a shorter chart time frame; its lookback is a separate choice.
Also distinguish this price-volume indicator from the market-breadth Advance/Decline Line, which counts advancing and declining securities. Money Flow Profile, volume-at-price tools, and Wyckoff accumulation ranges answer other questions; their names do not make them substitutes for ADL.
Using ADL in a Trading Process
Define Trend and Reversal Rules Separately
For a trend hypothesis, you might compare price above a specified moving average with ADL higher than it was a fixed number of completed bars ago. For a reversal hypothesis, you might define a particular divergence followed by a price break. Those are different strategies and need separate evaluation.
For example, “ADL today is above its value ten completed bars ago” is reproducible; “the curve looks strong” is not. Specify the price condition, execution timing, exit, position size, and cost assumptions. Changing the comparison length changes the strategy rule, not the underlying raw ADL formula.
Combine ADL with Other Tools Carefully
RSI can provide momentum context and a moving average can summarize trend, but neither turns ADL into a dependable predictor. An oversold RSI can stay low during a decline, and several indicators may be transformations of closely related inputs. Adding filters can remove useful trades as well as false signals.
Compare each addition with a simple baseline over the same data and dates. Inspect drawdown, trade count, net results after costs, and sensitivity to settings. The indicator FAQ explains how these tools differ.
Manage Risk Independently of the Indicator
ADL does not specify a safe stop distance, position size, or maximum loss. Choose a price-based or otherwise explicit exit and calculate size from the resulting risk. Include applicable commission, spread, and slippage, and consider correlated positions and gaps. A divergence that eventually works does not excuse an uncontrolled loss before the turn.
Use valid and consistent data. Equity volume from one exchange is not consolidated market volume; crypto volume depends on the venue; forex data may provide tick volume. A change in the input source can alter the accumulated result. Compare like with like and avoid universal ADL thresholds across instruments.
Analyze ADL in Native LuxAlgo
Open the Accumulation/Distribution Library indicator and use its native chart option, or find it through the Indicators picker. In a multi-chart layout, select the intended chart first. The current raw implementation has no length or smoothing setting; its visible input controls the plot color, and its total accumulates over the loaded history.
Check several bars against the formula, including a midrange close and a flat bar. Keep the symbol, feed, time frame, and history consistent when comparing results. Adding a moving average of ADL or a custom divergence detector creates additional logic with its own parameters and limitations.
Quant, our coding agent, can help translate explicit ADL conditions into a native strategy script. Specify the formula, missing-data behavior, completed-bar timing, entry, exit, sizing, and costs. Inspect the generated code and run it manually on the intended chart.
Use the strategy viewer to inspect individual trades as well as headline statistics. Test a separate period that was not used to choose the rules, and use realistic fill assumptions on standard candle prices.
Conclusion and Key Points
- ADL accumulates volume weighted by close location; its “money flow” terminology is not literal cash accounting.
- The previous close is absent from the formula, so gaps can create counterintuitive readings.
- Divergence and trend agreement are observations to test, not guarantees of reversal or continuation.
- OBV and CMF use different calculations; the absolute numbers are not interchangeable.
- Use current native tools, clear rules, valid data, costs, and a separate evaluation period.
The most useful question is not whether ADL is universally accurate. It is whether a specific, reproducible use of the indicator adds value to a strategy under realistic assumptions. Start with the arithmetic and investigate the trades behind the result.
FAQs
How do you use the accumulation and distribution indicator?
Compare ADL changes with price over the same interval to study directional agreement or divergence. Define a separate entry and exit rule, check the volume source, and evaluate the method after costs on a separate period.
Does ADL measure actual money entering a stock?
No. It weights volume by where the close falls within each bar’s high-low range. The result is a cumulative proxy, not a dollar value or a direct classification of investors’ cash flows.
Why can ADL rise on a down day?
The formula compares the close with that bar’s high and low, not with the previous close. A bar can gap down, finish near its own high, and still add a positive contribution to ADL.
How accurate is ADL?
There is no universal accuracy rate for an indicator without a defined signal and outcome. Results depend on the rules, market, data, costs, and sample. Adding other indicators does not guarantee improvement.
What is the difference between ADL and CMF?
ADL is a cumulative sum of money flow volume. CMF divides a rolling sum of that same quantity by rolling volume over a selected lookback. They have different scales and time treatment.
What happens when a bar has the same high and low?
The raw fraction would have a zero denominator. LuxAlgo’s current Library implementation assigns that bar a zero contribution. Missing volume is a different issue and should be checked separately.
Read next