AI-Driven Trading: The Next Generation of Market Indicators
Clustering indicators adapt their output by grouping similar observations. In LuxAlgo’s library, SuperTrend AI (Clustering), AI Channels (Clustering) and AI SuperTrend Clustering Oscillator apply that idea to different inputs. Understanding those inputs is more useful than assuming an “AI” label means greater accuracy or a profitable trading system.
These tools can organize trend and price information, but their outputs are not calibrated probabilities of success. The choice of data, settings and trading rules remains yours. Use the native library previews to explore the indicators, then test a complete strategy with realistic costs and timing before drawing conclusions.
What K-Means Adds to an Indicator
K-means is an unsupervised grouping method. In a simple one-dimensional case, observations are assigned to nearby group centers, or centroids; each center is then recalculated from the observations assigned to it. Repeating those steps seeks compact groups under the chosen distance measure. Initialization, the number of groups and the stopping rule affect the result.
A cluster summarizes its input data. It does not automatically identify a profitable trade, a causal market regime or a statistically significant forecast. As the data changes, the groups and their labels can change. Repeatedly fitting a grouping method to recent observations is still an explicit calculation, not a system that learns every possible market behavior.
| Indicator | What is grouped | Main output | Important limit |
|---|---|---|---|
| SuperTrend AI (Clustering) | Performance scores from a range of SuperTrend factors | A SuperTrend using the selected cluster’s average factor | The highest-scoring group is relative to the tested set and score |
| AI Channels (Clustering) | Prices in a rolling window | Channel levels and dispersion areas derived from clusters | A price centroid is not guaranteed support or resistance |
| AI SuperTrend Clustering Oscillator | Differences between closing price and multiple SuperTrend variants | Bullish, bearish and consensus outputs | The labels describe relative groups, not measured buying or selling volume |
SuperTrend AI: Adapt the Factor, Not a Static ATR
A conventional SuperTrend uses an ATR-based calculation with a chosen multiplier. Even when that multiplier stays fixed, ATR itself changes as new price ranges arrive. The distinction is between a fixed parameter and an evolving volatility measure, not between a static market calculation and an adaptive one.
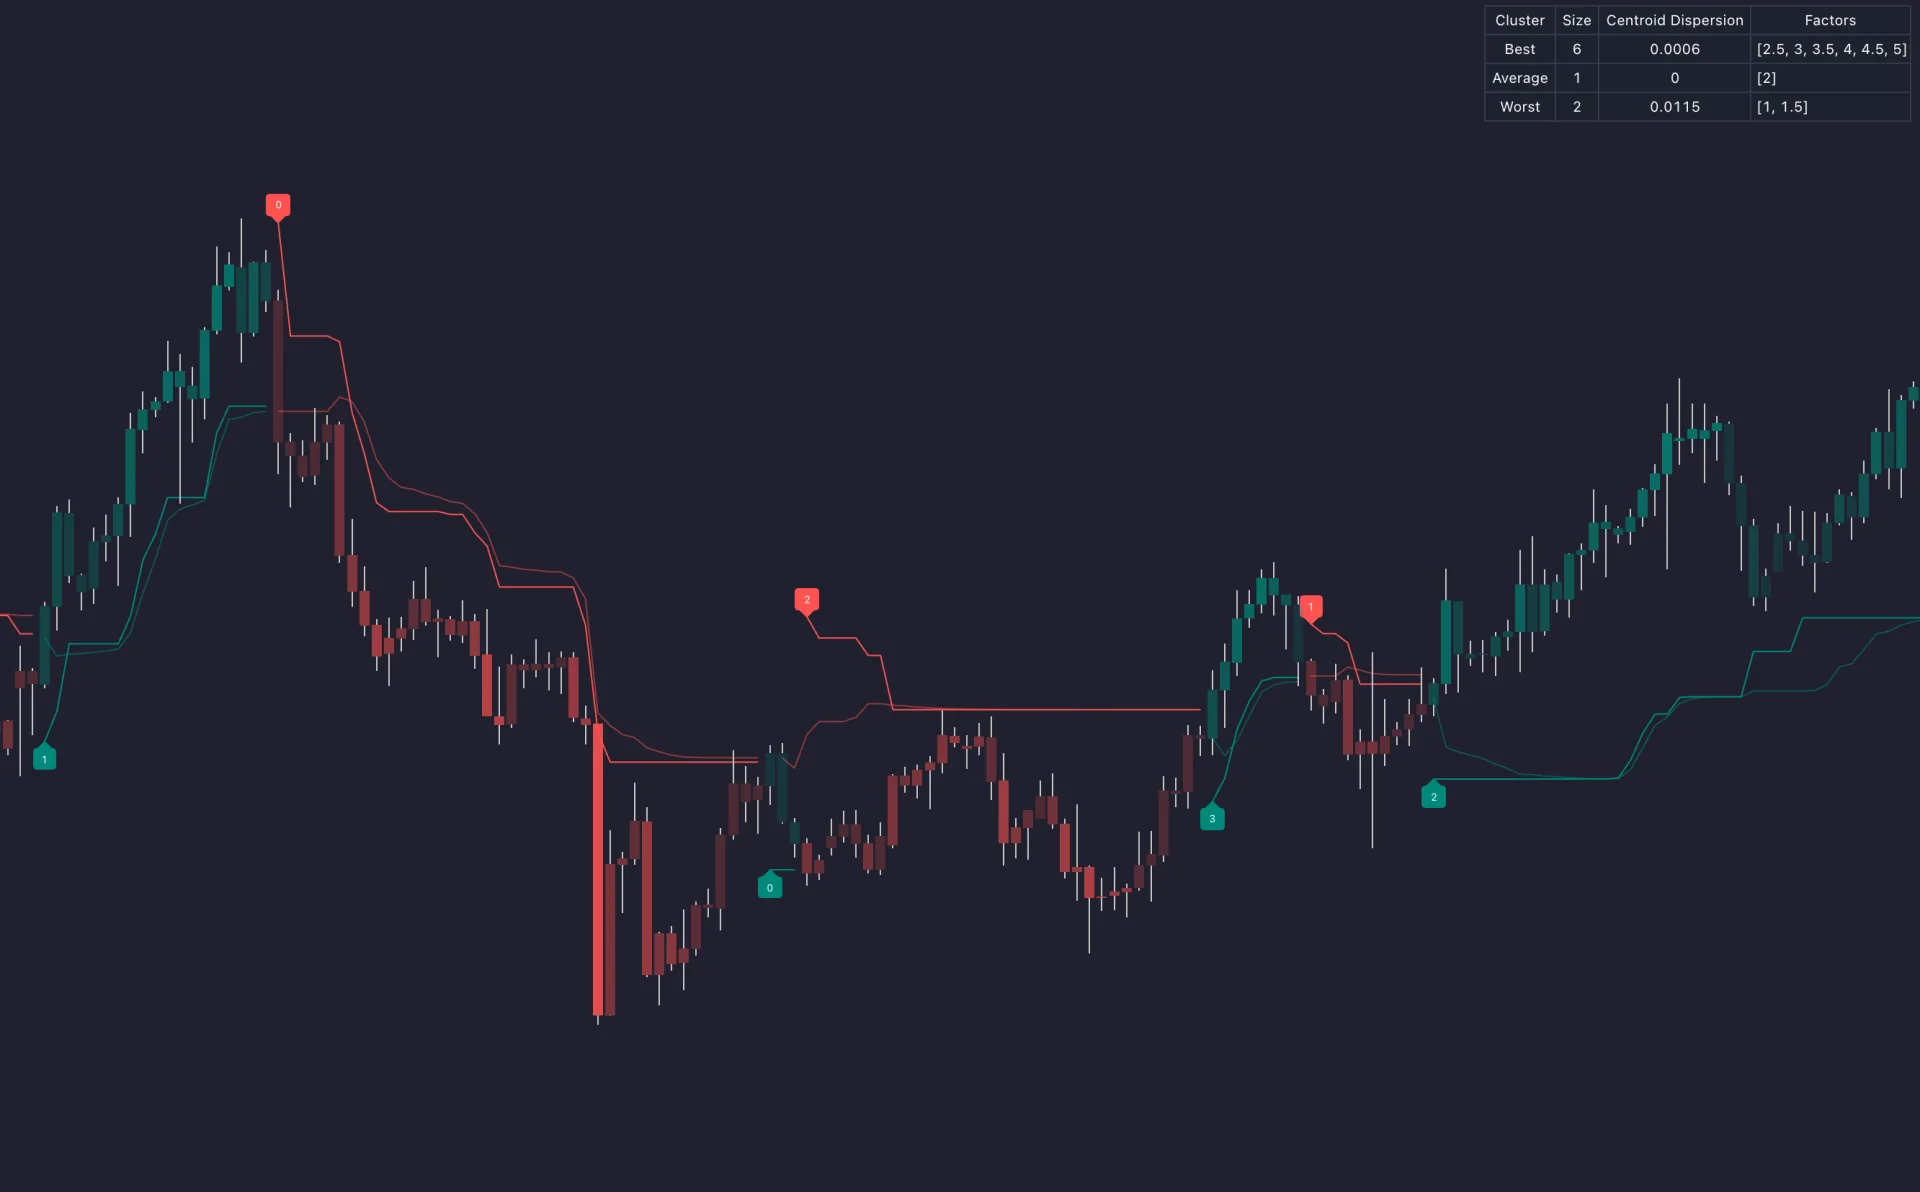
SuperTrend AI (Clustering) evaluates SuperTrend instances across a user-defined factor range. It scores their historical behavior, groups the scores into three clusters and uses the average factor from the selected cluster for the final stop. The published description identifies performance quartiles as the initial centroid locations.
The Best, Average and Worst choices refer to relative score groups. They are not inherently aggressive, balanced and counter-trend strategies. Choosing Worst does not reverse the trade direction, and choosing Best does not establish the best future result. The score is not interchangeable with a cost-adjusted strategy return, a win percentage or a significance test.
Settings That Still Require a Decision
- ATR Length: the period used for the underlying ATR calculation.
- Factor Range and Step: the candidate multipliers and spacing between them. A finer step creates more candidates; it does not guarantee better predictions.
- Performance Memory: how the score responds to historical behavior. A longer memory and a shorter memory answer different adaptation questions.
- From Cluster: the relative score group that supplies the final factor.
- Maximum Iteration Steps and Historical Bars Calculation: limits on clustering work and the calculation window. Record these alongside the trading settings.
For example, factors from 1 through 5 at a step of 0.5 give nine candidates when both endpoints are included. If a chosen group contains factors 2, 3 and 4, their mean is 3. That is a simple factor-selection illustration, not evidence that factor 3 is optimal for any instrument.
A stop below price can provide an uptrend reference and a stop above price a downtrend reference. The adaptive average and signal metric add context, but a plotted stop is not a submitted broker order. Specify whether a strategy acts on a completed-bar flip, an intrabar event or another condition, and test that exact rule.
AI Channels: Cluster Price Levels
AI Channels (Clustering) groups recent prices over its Window Size. The lowest and highest cluster centroids form the channel extremities, with a center line derived from the clustering. Dispersion areas describe how spread out prices are within the relevant clusters.
A wide dispersion area indicates greater variation in the grouped prices. It does not by itself supply a numerical breakout probability. Similarly, a lower centroid is not proven strong support and a center line is not a fundamental fair value. Treat a touch, rejection or break as an event to define and evaluate.
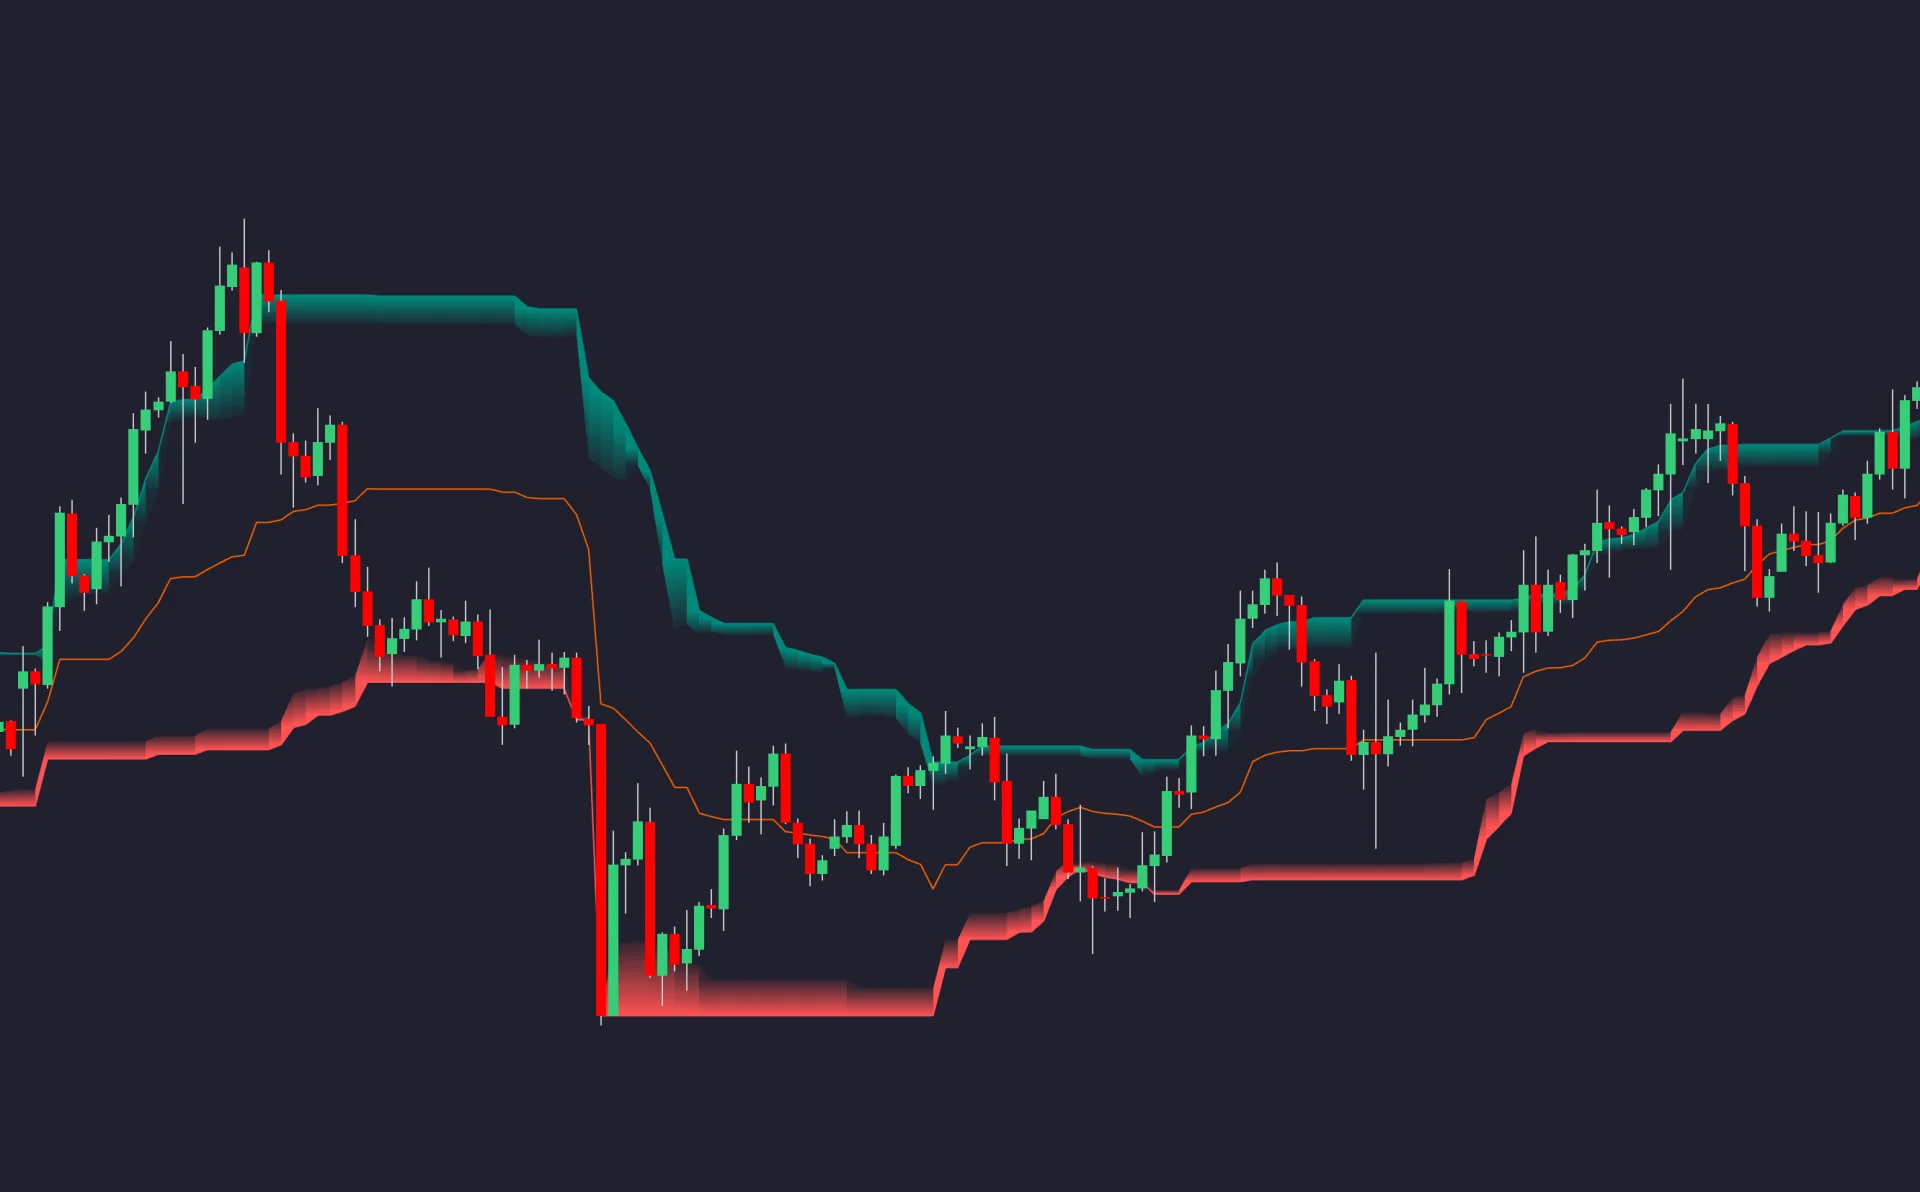
Window Size changes the sample used for clustering, while Clusters changes how that sample is partitioned. Denoise Channels steadies the displayed extremities; disabling it displays the exact centroids with a more irregular appearance. As Trailing Stop changes the display mode. It is not a broker execution instruction.
Keep the display mode consistent when comparing results. A strategy written for a denoised boundary is not necessarily equivalent to one using the raw centroid. Changing the window, group count and smoothing together makes it difficult to identify which change caused a different outcome.
The Clustering Oscillator: Compare SuperTrend Deviations
AI SuperTrend Clustering Oscillator evaluates the difference between the closing price and each SuperTrend variant across a factor range. It groups those differences and plots bullish, bearish and consensus outputs. Its Smooth input steadies the outputs; iteration and historical-calculation limits also affect the work performed.
Here, “bullish” is the relatively strongest group and “bearish” the relatively weakest. All groups can be above zero or all below zero. The labels do not mean that actual buy or sell orders were counted, and the shaded plots are not confidence intervals or probabilities.
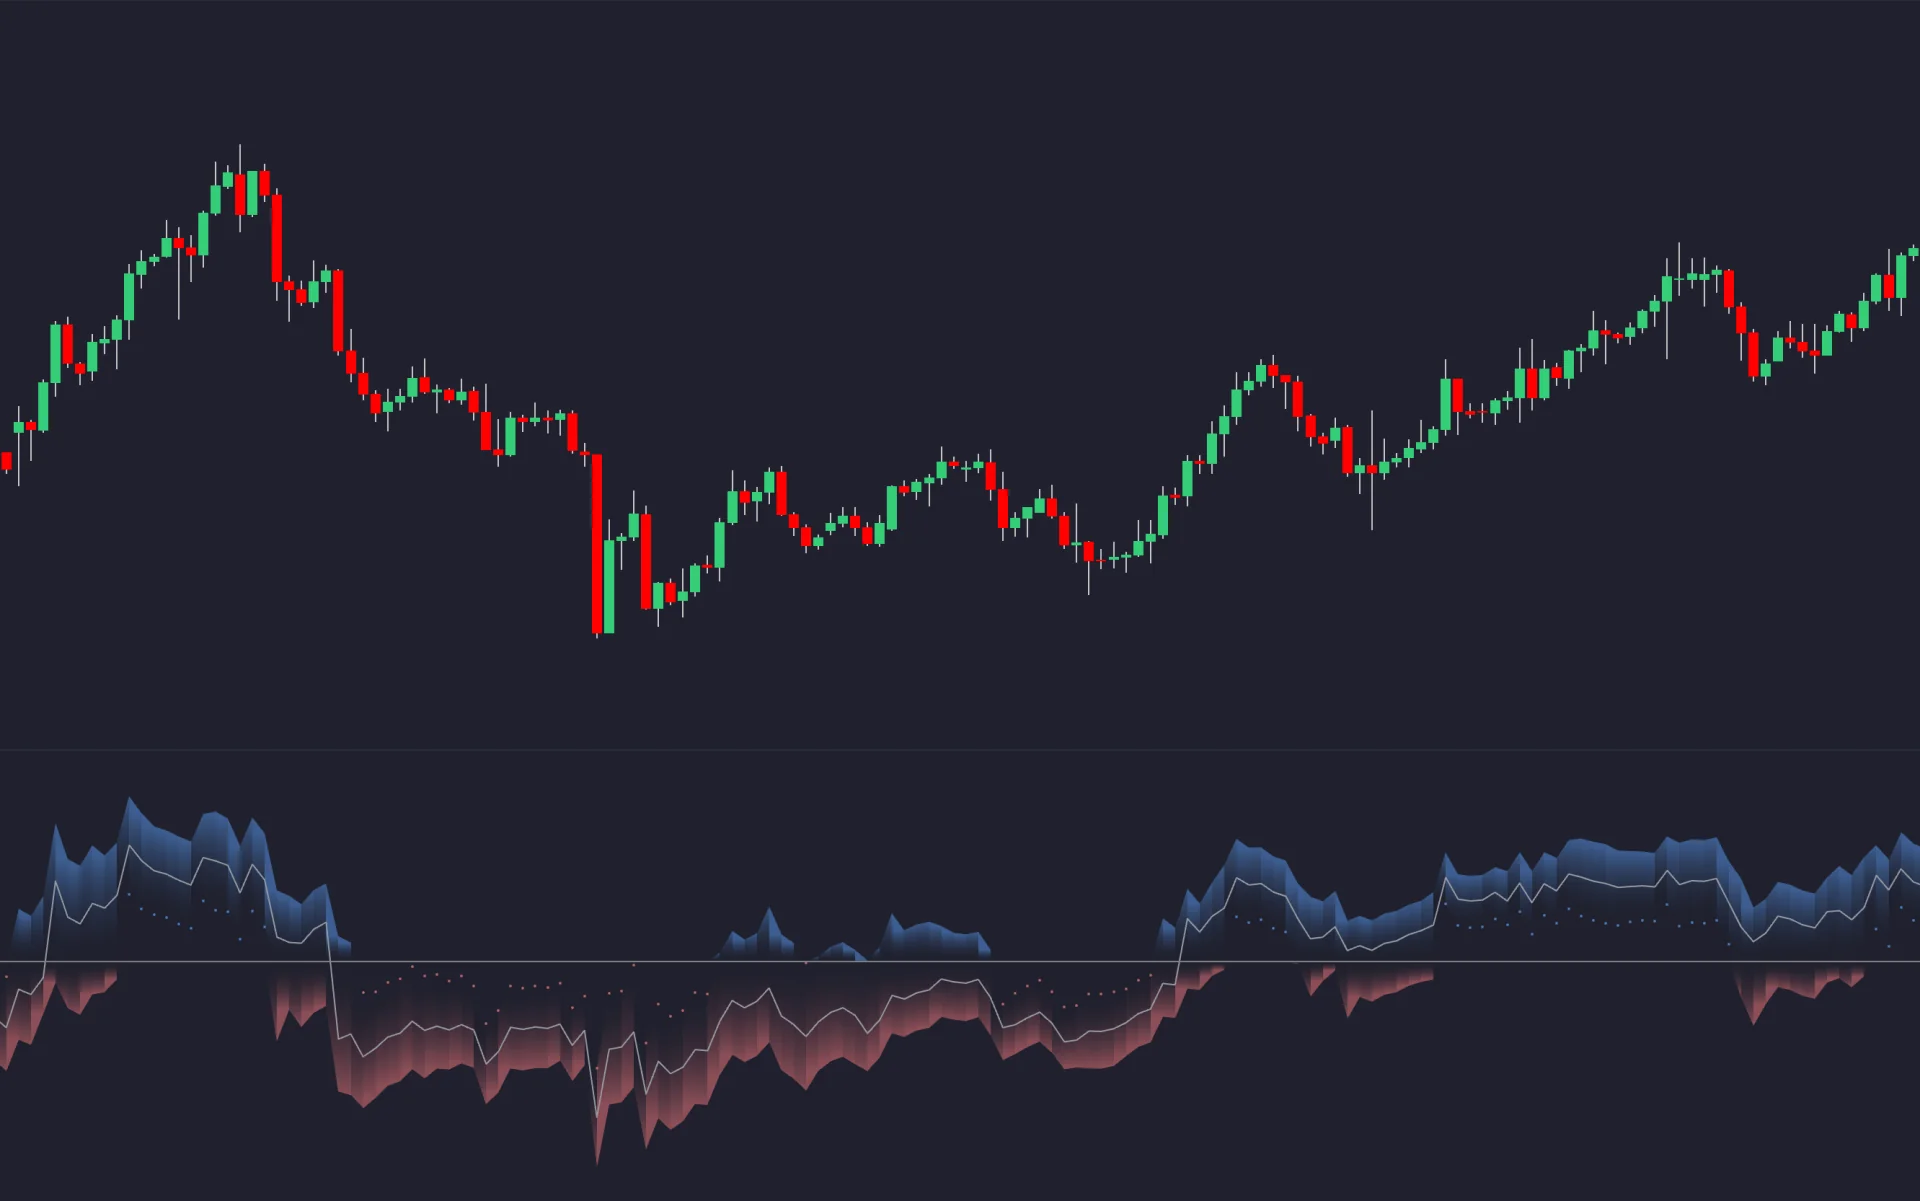
A consensus above zero can be read as an upward bias across the calculation, with the reverse below zero. If even the bearish output is positive, the weakest group is on the positive side; if even the bullish output is negative, the strongest is on the negative side. This describes agreement in the inputs, not certainty about the next price move.
For a simplified unsmoothed example, a close of 102 compared with SuperTrend levels of 98, 100 and 101 produces deviations of 4, 2 and 1. Even the smallest difference is positive. Conversely, a close of 97 gives −1, −3 and −4. These arithmetic examples explain the sign convention; the indicator uses its configured factor set, clustering and smoothing rather than simply plotting these three numbers.
Combining the Indicators Requires a Complete Rule
The tools can play different roles: SuperTrend AI for a trend reference, AI Channels for a price-boundary condition, and the oscillator for agreement across SuperTrend variants. However, two of them share SuperTrend calculations and all depend on price. Agreement is not three independent pieces of evidence.
A research hypothesis might require a completed candle with an upward SuperTrend state, a close above the configured upper channel and a positive oscillator consensus. Define whether the signal is the first qualifying bar or every qualifying bar. An entry based on the close becomes eligible only afterward under the chosen fill model; it cannot assume an earlier favorable price from that same candle.
Also define the exit, stop behavior, position size, session, re-entry policy and handling of simultaneous conditions. A collection of favorable-looking overlays is not a complete trading strategy until those choices are fixed. If a plotted line moves during the candle, record which value the order rule uses.
| Research choice | What to record | Why it matters |
|---|---|---|
| Data and timing | Instrument, provider, interval, session, warm-up and decision time | Different feeds and unfinished bars can produce different signals |
| Parameter selection | Range, step, window, memory, smoothing and cluster choice | Adaptive tools still contain choices that can overfit |
| Execution | Order timing, fill assumptions, spread, commissions and slippage | A visual signal may not be achievable at the plotted price |
| Evaluation | Baseline, later test period, variants tried and rejected | Selecting the best historical curve can exaggerate performance |
| Risk | Sizing, stop logic, exposure and maximum drawdown | A high win rate does not describe the full payoff or loss risk |
Explore and Test in LuxAlgo’s Native Platform
Open the specific indicator’s LuxAlgo Library page to review its description, source view and chart preview. The pages provide an Open on Quant Charts action for the native workflow. Confirm the actual settings and indicator version instead of copying assumptions from an older screenshot.
Ask Quant, our coding agent to express a supported strategy from your written conditions. Inspect the generated code and run it manually. Check that the code uses the intended outputs, smoothing and event timing. Label an approximation clearly rather than claiming it is identical to an original implementation.
Review strategy settings and individual trades against the chart. Include trading costs, inspect ambiguous stop/target candles and compare the combined setup with a simpler baseline. If a required output or execution behavior is unsupported, document that limitation before interpreting the result.
Use chronological development and later evaluation periods. If you repeatedly change the rules after examining the later period, that period has become part of development. Record unsuccessful variants as well as the chosen candidate, and check whether nearby settings produce broadly consistent behavior.
For a simple cost illustration, 50 trades earning 10 units each before costs produce 500 units gross. At 12 units of total round-trip costs per trade, the result is −100 units net. Avoid subtracting costs twice if a reported result is already net. Historical adaptation does not remove this accounting requirement.
Check availability and instructions for the exact indicator. A research result or alert remains separate from an actual broker fill.
Frequently Asked Questions
Does an AI clustering indicator guarantee more accurate trades?
No. Clustering organizes its inputs under chosen settings. It does not establish a profitable strategy, a calibrated probability or a statistically significant forecast.
Does Best select the best future SuperTrend setting?
No. Best refers to the relatively highest-scoring cluster among the evaluated candidates. The final factor comes from that selected group; future outcomes remain uncertain.
Is ordinary ATR static when the multiplier is fixed?
No. ATR updates as price ranges change. A fixed multiplier is a fixed parameter applied to an evolving volatility measure.
Can the bearish oscillator output be positive?
Yes. Bearish names the relatively weakest group of price-to-SuperTrend differences. If all those differences are positive, even that group can remain above zero.
Do the three indicators form a complete trading system?
Not by themselves. You still need explicit entries, exits, sizing, execution assumptions and evaluation. Their shared price and SuperTrend inputs also mean their agreement is not independent confirmation.
Read next