Alternative Data for Algorithmic Trading: What Works?
Alternative data is any information used to trade that does not come from prices, volumes or company filings: web and app traffic, card transactions, satellite images, shipping movements, social and news text, and the positioning and derivatives data that markets themselves generate. The promise is information before it reaches the tape; the reality is that most of it is expensive, most published success figures do not survive scrutiny, and any edge a dataset provides shrinks as the vendor sells it to more funds. This guide separates what the evidence actually supports from what the marketing says, gives a checklist for evaluating a dataset before paying for it, shows how to test whether a series carries information about future returns, covers the legal limits, and identifies the market-derived alternative series a retail trader can use today, several of which are native indicators on Quant Charts, where Quant, our coding agent, can write a rule that combines them with price.
Key points:
- Test the dataset, not the story. A series is useful only if it carried information about future returns at the time it was available, after costs, and the test for that is the same as for any indicator.
- Point-in-time matters more than coverage. A dataset restated after the fact will backtest beautifully and trade badly.
- Edges decay. The same vendor sells the same feed to many buyers; what worked in a published paper years ago is not what works now.
- Retail traders have accessible alternative data: positioning reports, options ratios, open interest and funding rates are public or exchange-published and already on the chart.
Video: How Hedge Funds Use Consumer Data
CNBC Television's report on how hedge funds use consumer data, from card transactions to foot traffic, and what they pay for it. It is a useful picture of the institutional side of the market this guide describes.
What Counts as Alternative Data
| Category | Examples | What it can tell you | Access |
|---|---|---|---|
| Web and app activity | Site visits, app downloads, search interest, review counts | Consumer demand ahead of reported revenue | Paid panels; some public search-trend tools |
| Transactions | Aggregated card spending, receipts, point-of-sale panels | Company and sector sales before earnings | Paid, institutional pricing |
| Geospatial | Satellite imagery, parking-lot counts, shipping and aircraft tracking | Physical activity: retail traffic, storage levels, supply chains | Paid; some public tracking data |
| Text and sentiment | News, filings, transcripts, social posts | Attention and mood; event detection | Public raw text; paid processed feeds |
| Positioning and derivatives | Commitments of Traders, put/call ratios, open interest, funding rates | Who is positioned how, and how crowded a trade is | Public or exchange-published; on the chart |
| On-chain | Wallet flows, exchange balances, network activity | Crypto supply and demand mechanics | Public blockchains; paid analytics |
| Official statistics | Energy inventories, employment, trade flows | Macro and commodity fundamentals on a schedule | Public, published on a calendar |
The last three rows matter for most readers. The first four are the datasets in the headlines, and they are priced for funds. Positioning, derivatives, on-chain and official data are alternative in the useful sense, information that is not price, and available to anyone.
What the Evidence Actually Supports
The most quoted number in this field comes from a 2010 paper by Bollen, Mao and Zeng, which reported 87.6 percent accuracy in predicting the daily direction of the Dow Jones Industrial Average by adding Twitter mood dimensions to a model, over its test period. It is a real result, and it is routinely misreported: it was published in 2010, not 2018, it concerned a short sample, and a research accuracy over a test window is not a trading return after costs and decay. Attempts to trade the finding commercially did not establish a durable edge, and the honest lesson is the general one: text sentiment carries information about attention and mood, and that information is fleeting, crowded and best used as a filter rather than a signal.
The GameStop episode of early 2021 shows the other side. Social media activity plainly drove price, and anyone monitoring the relevant forums saw it, but the relationship was a regime, not a stable rule: the same posting volume meant something different before, during and after the squeeze. Web traffic, transaction panels and satellite counts have documented use in forecasting company revenues, and that is the strongest institutional case for alternative data, because a revenue surprise is a defined event with a defined date. What none of these sources have is a standing, published, out-of-sample edge that survives the vendor selling the feed widely. When a dataset works, its price rises and its buyers multiply until it stops working; that is the market doing its job.
Evaluating a Dataset Before You Pay
Vendors show backtests; buyers should run their own. The questions below decide whether a series can even be tested honestly, and most datasets fail one of them.
| Question | Why it matters | What to ask the vendor |
|---|---|---|
| Is it point-in-time? | If values are revised after the fact, the history you backtest is not the history you would have traded | Do you store the value as first published and the value as revised, with both timestamps? |
| How long is the history? | A few years is not enough to see more than one regime | When did collection start, and did the methodology change? |
| Is there survivorship? | Panels that drop failed companies or delisted tickers flatter every result | Are delisted names retained with their final data? |
| What is the latency? | A signal available a week after the event is a different signal from one available the same day | What is the lag between the real-world event and delivery, historically and now? |
| How was it collected? | Panel bias, scraping breaks and sample changes create false signals | What is the sample, how is it weighted, and what changed over time? |
| Is it legal to use? | Personal data, scraped content and material non-public information carry real liability | Consent basis, anonymisation, terms of the source sites, compliance review |
| What does it cost against the edge? | Institutional datasets cost more than a retail account can earn from them | Full price including data, engineering time and the trades needed to monetise it |
Aligning and Testing a Series
Once a dataset passes the checklist, the test is the same as for any indicator: does the value known at time t say anything about returns after t? Three steps get there. Align the series to bars with an as-of join, so each bar sees only the latest observation published before it. Normalise the series within each name, usually as a rolling z-score, so values are comparable across companies and time. Then measure the information coefficient, the rank correlation between the signal and forward returns over a horizon, and watch how it decays as the horizon lengthens. The snippet does all three with pandas; the frames are placeholders for whatever dataset you are evaluating.
import pandas as pd

# prices: columns [date, symbol, close]        (daily bars)
# altdata: columns [published_at, symbol, value] (irregular observations with publication timestamps)

prices = prices.sort_values("date")
altdata = altdata.sort_values("published_at")

# 1. As-of join: each bar sees only the latest observation published before that bar's date.
merged = pd.merge_asof(prices, altdata, left_on="date", right_on="published_at",
                       by="symbol", direction="backward")

# 2. Normalise within each symbol as a rolling z-score of the last 60 observations.
g = merged.groupby("symbol")["value"]
merged["z"] = (merged["value"] - g.transform(lambda s: s.rolling(60).mean())) / g.transform(lambda s: s.rolling(60).std())

# 3. Forward returns and the information coefficient at several horizons.
for horizon in (1, 5, 20):
    fwd = merged.groupby("symbol")["close"].transform(lambda s: s.shift(-horizon) / s - 1)
    ic = merged.assign(fwd=fwd).groupby("date").apply(
        lambda d: d["z"].corr(d["fwd"], method="spearman")).mean()
    print(f"{horizon}-day horizon: mean cross-sectional IC = {ic:.3f}")
An information coefficient is small even when real: a few hundredths is meaningful for a cross-sectional signal used across many names, and it should decline smoothly as the horizon grows. A large IC on a short history, or one that jumps around by year, is more likely a data artefact than an edge. Treat the result as one input to a strategy that is then backtested with costs like any other, and be suspicious of any dataset whose IC is much larger than what the best-known price-based factors achieve.
Where Retail Traders Can Actually Start
The alternative data a retail trader can realistically use is the kind that markets and regulators publish. It is not exclusive, which is exactly why it is affordable, and it still answers questions price alone cannot: who is positioned how, how crowded a trade is, and whether leverage is building.
- Positioning reports. The CFTC's weekly Commitments of Traders reports break futures positions down by trader category. The Library's Open Interest Chart and Open Interest Inflows & Outflows draw on COT-derived open interest series to show whether money is entering or leaving a market.
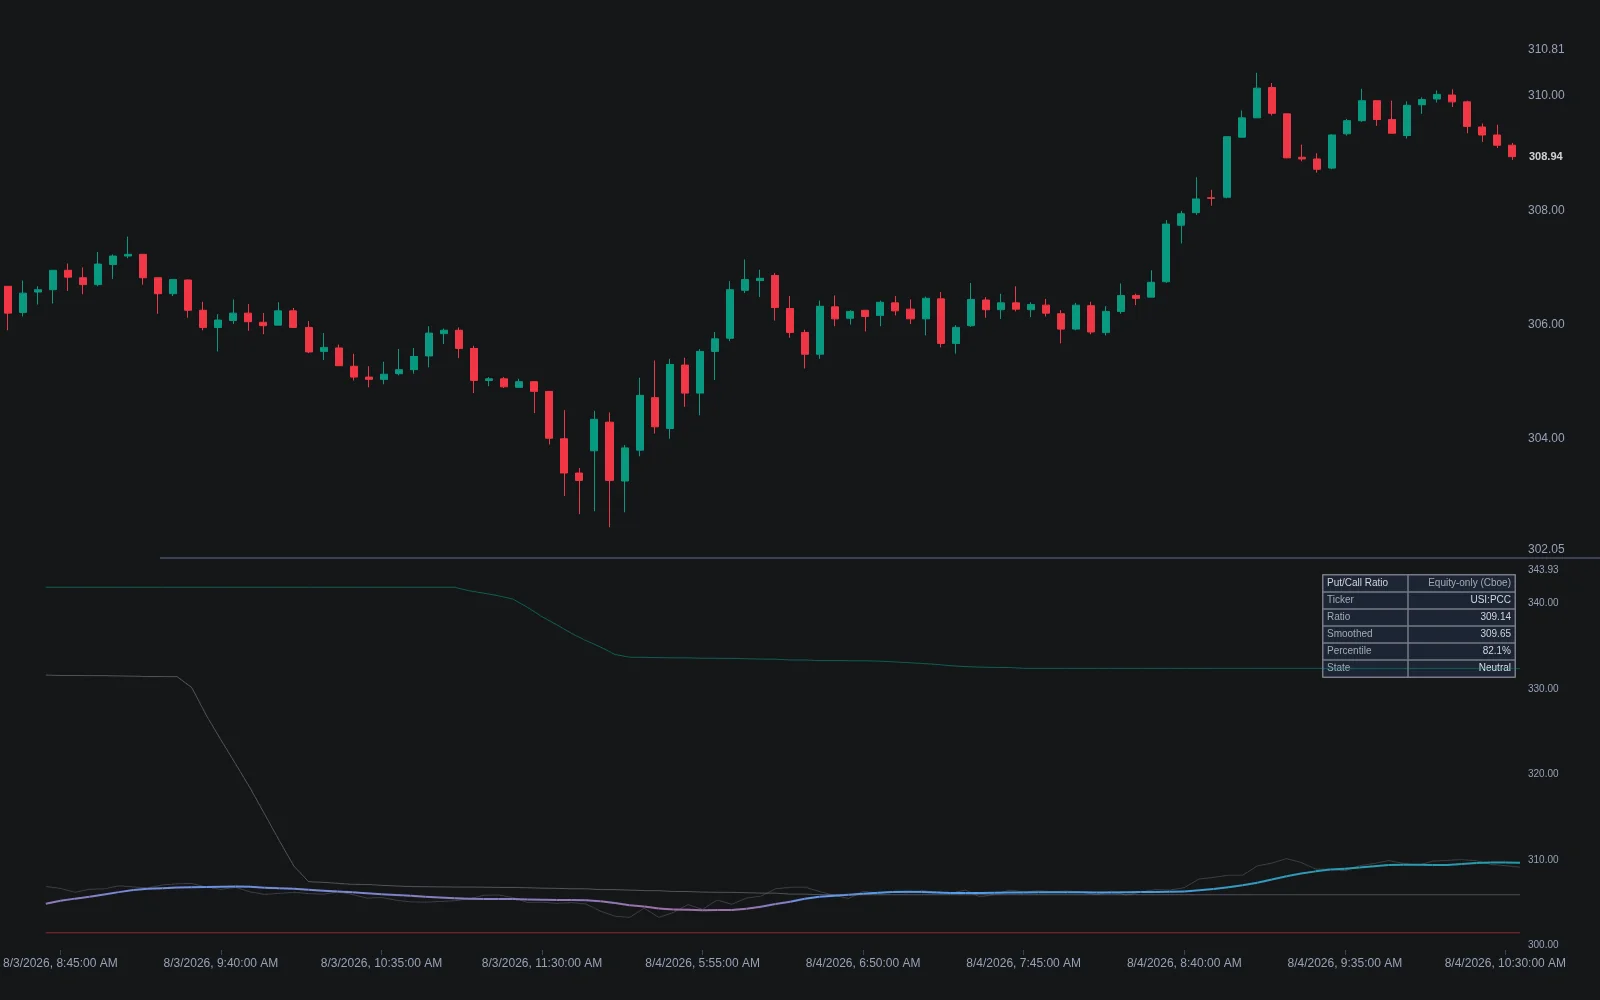
- Options sentiment. The put/call ratio measures daily options volume, and the Library's Put/call Ratio indicator smooths the Cboe series and ranks it against a rolling year, flagging extremes as percentile bands rather than fixed levels.
- Crypto positioning. Open interest and the funding rate on perpetual futures are exchange-published and show leverage and crowding directly.
- Order flow. Quant Charts provides pre-aggregated footprints, volume at price with per-side trade counts, for the crypto venues and US equities listed in the data documentation; it is not an order book or a trade tape, and the documentation says which markets support it.
- Official statistics. Weekly energy inventories, employment releases and trade data arrive on a published calendar and move the markets that depend on them.
Our reviews of QuiverQuant and Unusual Whales cover retail-priced alternative data services, and heatmaps and footprints explains the order-flow tools.
Pitfalls Specific to Alternative Data
| Pitfall | How it shows up | Defence |
|---|---|---|
| Restated history | A vendor backfills or revises values; the backtest uses numbers nobody had at the time | Insist on point-in-time storage; test on the first-published values |
| Publication lag ignored | Joining on the event date rather than the date the data arrived | As-of joins on publication timestamps, as in the snippet |
| Survivorship in panels | Only companies that still exist are in the dataset | Ask for delisted names; test on a universe defined as of each date |
| Regime mistaken for rule | A relationship that held during one episode, such as 2021 social-media squeezes | Test across years and market conditions; expect the relationship to change |
| Multiple testing | Dozens of series screened, one looks predictive by chance | Hold out data; adjust expectations for the number of series tried |
| Costs after edge | Data fees exceed what the signal can earn at your capital | Price the full pipeline, including your time, before subscribing |
| Legal exposure | Personal data, scraped content or leaked non-public information | Compliance review before use; prefer aggregated, consented, public sources |
The Legal Boundaries
Three bodies of rules shape what can be used. In the United States, Regulation Fair Disclosure and insider-trading law mean that material non-public information obtained from a company or its insiders cannot be traded on; alternative data is legitimate precisely because it is gathered from public or consented sources rather than from the company, and firms maintain procedures to check that a dataset has not crossed that line. In Europe, the General Data Protection Regulation governs any dataset derived from individuals, so transaction and location panels must be aggregated and anonymised with a lawful basis for the underlying collection. And web data is bound by the terms of the sites it comes from and by evolving case law on scraping. None of this is a reason to avoid alternative data; it is a reason to buy from vendors who can document their sources and to keep a compliance review in the workflow.
Where Quant Charts Fits
Quant Charts is not a place to load a proprietary transaction panel; its charts use LuxAlgo market data from a single provider in front of several venues, with no exchange accounts or API keys to connect. Where it fits is the category of alternative data that markets themselves publish. The Library's Put/call Ratio, Open Interest Chart and Inflows & Outflows, and the indicators covered by the Library's COT analysis concept bring positioning and options sentiment onto the same pane as price, and the order-flow footprints add executed volume at price for the supported venues. Describe a rule to Quant that combines them, take long signals only while the put/call ratio sits above its fear band, or skip entries when open interest is contracting, and Quant writes it in Pine Script and plots it on the active chart. Open Code to read the logic, click Run, and the Backtest Summary reports net profit, trade count, win rate, maximum drawdown and profit factor with commission and slippage set in the strategy properties, which is the honest test this guide has been describing, applied to alternative data that is already on the chart. The Making Strategies with Quant guide shows the workflow.
One boundary. The LuxAlgo platform does not place orders for you; Quant Charts is where rules are written and tested, and execution stays with your broker or your own code, for example through our open-source Trade Relay and Broker SDK. For the data engineering behind a proprietary dataset, our guides to Python libraries for algorithmic trading and SQL for trading cover the pipeline.
Conclusion
Alternative data is worth exactly what it tells you about future returns after costs, and finding that out requires the same discipline as any indicator: point-in-time history, as-of alignment, a measured and decaying information coefficient, a backtest with costs and an out-of-sample period. Most headline datasets are priced for institutions and lose their edge as they are sold; the published accuracy figures that circulate are research results from years ago, not tradable returns. The alternative data that is both accessible and durable is the kind markets publish about themselves, positioning, options sentiment, open interest, funding, order flow, and much of it is already on Quant Charts, where Quant can write the rule and the Backtest Summary can judge it.
Key Takeaways
- Evidence over marketing. The 87.6 percent Twitter result is a 2010 research figure, not a trading record; treat every vendor number the same way.
- Point-in-time or nothing. Restated history and ignored publication lags are the two ways alternative-data backtests lie.
- Measure the IC and its decay. Small, stable and smoothly decaying beats large and erratic.
- Know the law. Regulation FD and insider-trading rules, GDPR, and site terms bound what can be used.
- Start with market-published data. Put/call ratios, open interest, funding rates and COT positioning are on Quant Charts; Quant writes rules that combine them with price.
FAQs
What is alternative data in trading?
Information used to make trading decisions that does not come from prices, volumes or company filings: web and app activity, card transactions, satellite and location data, news and social text, positioning and derivatives data such as Commitments of Traders reports and put/call ratios, on-chain flows and official statistics. It is useful when it carries information about future returns that price has not yet absorbed.
Does social media sentiment predict stock prices?
Sometimes and briefly. The widely cited 2010 study by Bollen, Mao and Zeng reported 87.6 percent accuracy for daily Dow direction over its test period using Twitter mood, but that is a research result on a short sample, not a trading return after costs. Sentiment carries information about attention and mood, it is crowded and fleeting, and it works better as a filter or a regime indicator than as a standalone signal.
How do I evaluate an alternative dataset?
Ask whether it is point-in-time, how long and consistent its history is, whether delisted names are retained, what the publication lag is, how the sample was collected, whether it is legal to use, and what it costs against the edge you could earn. Then align it to bars with as-of joins, normalise it, measure the information coefficient against forward returns and its decay, and backtest any resulting rule with costs and an out-of-sample period.
What alternative data can a retail trader access?
Positioning and derivatives data published by regulators and exchanges: the CFTC's weekly Commitments of Traders reports, Cboe put/call ratios, futures and perpetual open interest, funding rates, and pre-aggregated order-flow footprints for supported venues. Official statistics such as energy inventories arrive on a public calendar. Several of these are Library indicators on Quant Charts.
Is using alternative data legal?
Yes when it is gathered from public or consented sources and does not contain material non-public information obtained from a company or its insiders, which Regulation Fair Disclosure and insider-trading law prohibit trading on. Datasets derived from individuals must comply with privacy law such as the GDPR, and web data is bound by the terms of the sites it comes from. Buy from vendors who document their sources and keep a compliance review in the workflow.
How does Quant Charts use alternative data?
Quant Charts does not import proprietary datasets; it uses LuxAlgo market data. It does carry the market-published kind of alternative data as Library indicators, including the Put/call Ratio, Open Interest Chart and Inflows & Outflows, and the COT analysis indicators, plus order-flow footprints for supported venues. Describe a rule combining them with price to Quant, read the Pine Script in Code, click Run, and the Backtest Summary reports the result with costs. No LuxAlgo tool places orders.
References
LuxAlgo Resources
- Quant Charts
- LuxAlgo Quant
- Making Strategies with Quant
- Quant Charts Data Documentation
- Order Flow Documentation
- Put/call Ratio Indicator
- Open Interest Chart Indicator
- Put/call Ratio Concept
- Open Interest Concept
- Funding Rate Concept
- COT Analysis Concept
- QuiverQuant Review: See Insider Trades and Alternative Data
- Unusual Whales Flow: Decode Option Whales Fast
- Heatmaps and Footprints: Visual Market Tools
- Python for Algorithmic Trading: Essential Libraries
- SQL for Trading: Unlock Financial Data
- Backtesting Traps: Common Errors to Avoid
- Backtesting with Quant
External Resources
- Bollen, Mao and Zeng — Twitter Mood Predicts the Stock Market (arXiv, 2010)
- Wikipedia — Alternative Data (Finance)
- Wikipedia — GameStop Short Squeeze
- CFTC — Commitments of Traders Reports
- EIA — Weekly Petroleum Status Report
- Wikipedia — Regulation Fair Disclosure
- EUR-Lex — General Data Protection Regulation (EU) 2016/679
- QuantConnect — Datasets
- Nasdaq Data Link
Read next