Average Day Range Indicator: Measuring Daily Volatility on TradingView
The Average Day Range (ADR) indicator measures how far an asset typically travels between its daily low and its daily high: ADR = average of (daily high − daily low) over N completed days. A stock with a $3.00 ADR has averaged a $3.00 low-to-high span per session. Because ADR uses only each day’s high and low, it ignores overnight gaps, which is the main difference from Average True Range (ATR).
Traders use ADR to judge whether a stop sits inside normal daily noise, whether a target asks for more movement than the asset usually delivers, and how much of the typical day has already been used. None of those readings predicts direction. ADR describes recent volatility; the trade rules still have to be defined and tested.
TradingView ships ADR as a built-in study, and the LuxAlgo Average Daily Range indicator can be added to Quant Charts in one click, where it projects the day’s expected high and low from the daily open. When a rule such as “enter after 25% of ADR is used, exit at 75%” needs testing, ask Quant, our coding agent, to help implement it, inspect the Code, and click Run. This guide covers the calculation, platform settings, strategy uses and the risk arithmetic that goes with them.
How the Average Day Range Indicator Works
ADR Calculation Method
ADR subtracts each completed day’s low from its high and averages those ranges over a chosen number of days. The formula is ADR = Σ (High − Low) ÷ N. TradingView’s ADR help article describes the same result differently: the average of the highs minus the average of the lows over the Length. Because averaging is linear, the two expressions are identical.
For example, if hypothetical daily ranges are $3.20, $2.85, $4.10, $2.95 and $3.40, the five-day ADR is $16.50 ÷ 5 = $3.30. A 14-day length is the default on both TradingView’s built-in study and the LuxAlgo indicator, and both can be changed.
| Day | High | Low | Range | Running five-day ADR |
|---|---|---|---|---|
| 1 | $151.10 | $147.90 | $3.20 | Not enough days |
| 2 | $150.60 | $147.75 | $2.85 | Not enough days |
| 3 | $153.00 | $148.90 | $4.10 | Not enough days |
| 4 | $152.40 | $149.45 | $2.95 | Not enough days |
| 5 | $153.90 | $150.50 | $3.40 | $3.30 |
The value updates once per completed day. The LuxAlgo implementation uses only completed daily ranges, so the current session’s developing range does not alter today’s ADR; it is compared against it instead. Check how any other implementation treats the current bar before comparing values across platforms.
ADR is in price units, so it only has meaning relative to the asset. A $100 stock with a $2.00 ADR moves about 2% of its price per day, while a $20 stock with the same $2.00 ADR moves about 10%. Dividing ADR by price gives ADR percent, which makes different assets comparable. TradingView’s screener column ADR% divides by the close; the LuxAlgo information table divides by the daily open, so the two percentages can differ slightly on the same day.
ADR vs. ATR
Average True Range starts from a bar’s true range: the largest of high minus low, the distance from the high to the prior close, and the distance from the low to the prior close. That anchoring to the previous close counts gaps that a plain high-minus-low range misses. ATR is also traditionally smoothed with Wilder’s RMA rather than a simple average.
| Measure | Day 1 (H $102, L $99, C $101.50) | Day 2 gap up (H $106, L $104) | What it counts |
|---|---|---|---|
| Daily range (ADR input) | $3.00 | $2.00 | Intraday travel only |
| True range (ATR input) | $3.00 (no prior close in the example) | $4.50, from $101.50 to $106 | Intraday travel plus the gap |
On the gap day the daily range is $2.00 while the true range is $4.50. A stop sized from ADR therefore understates the risk of holding through the open. ADR suits intraday range planning within a session; ATR is the more common unit for overnight stop distances and position sizing. TradingView’s note on ADR% and ATR% documents the same distinction for its screener columns.
TradingView Customization Settings
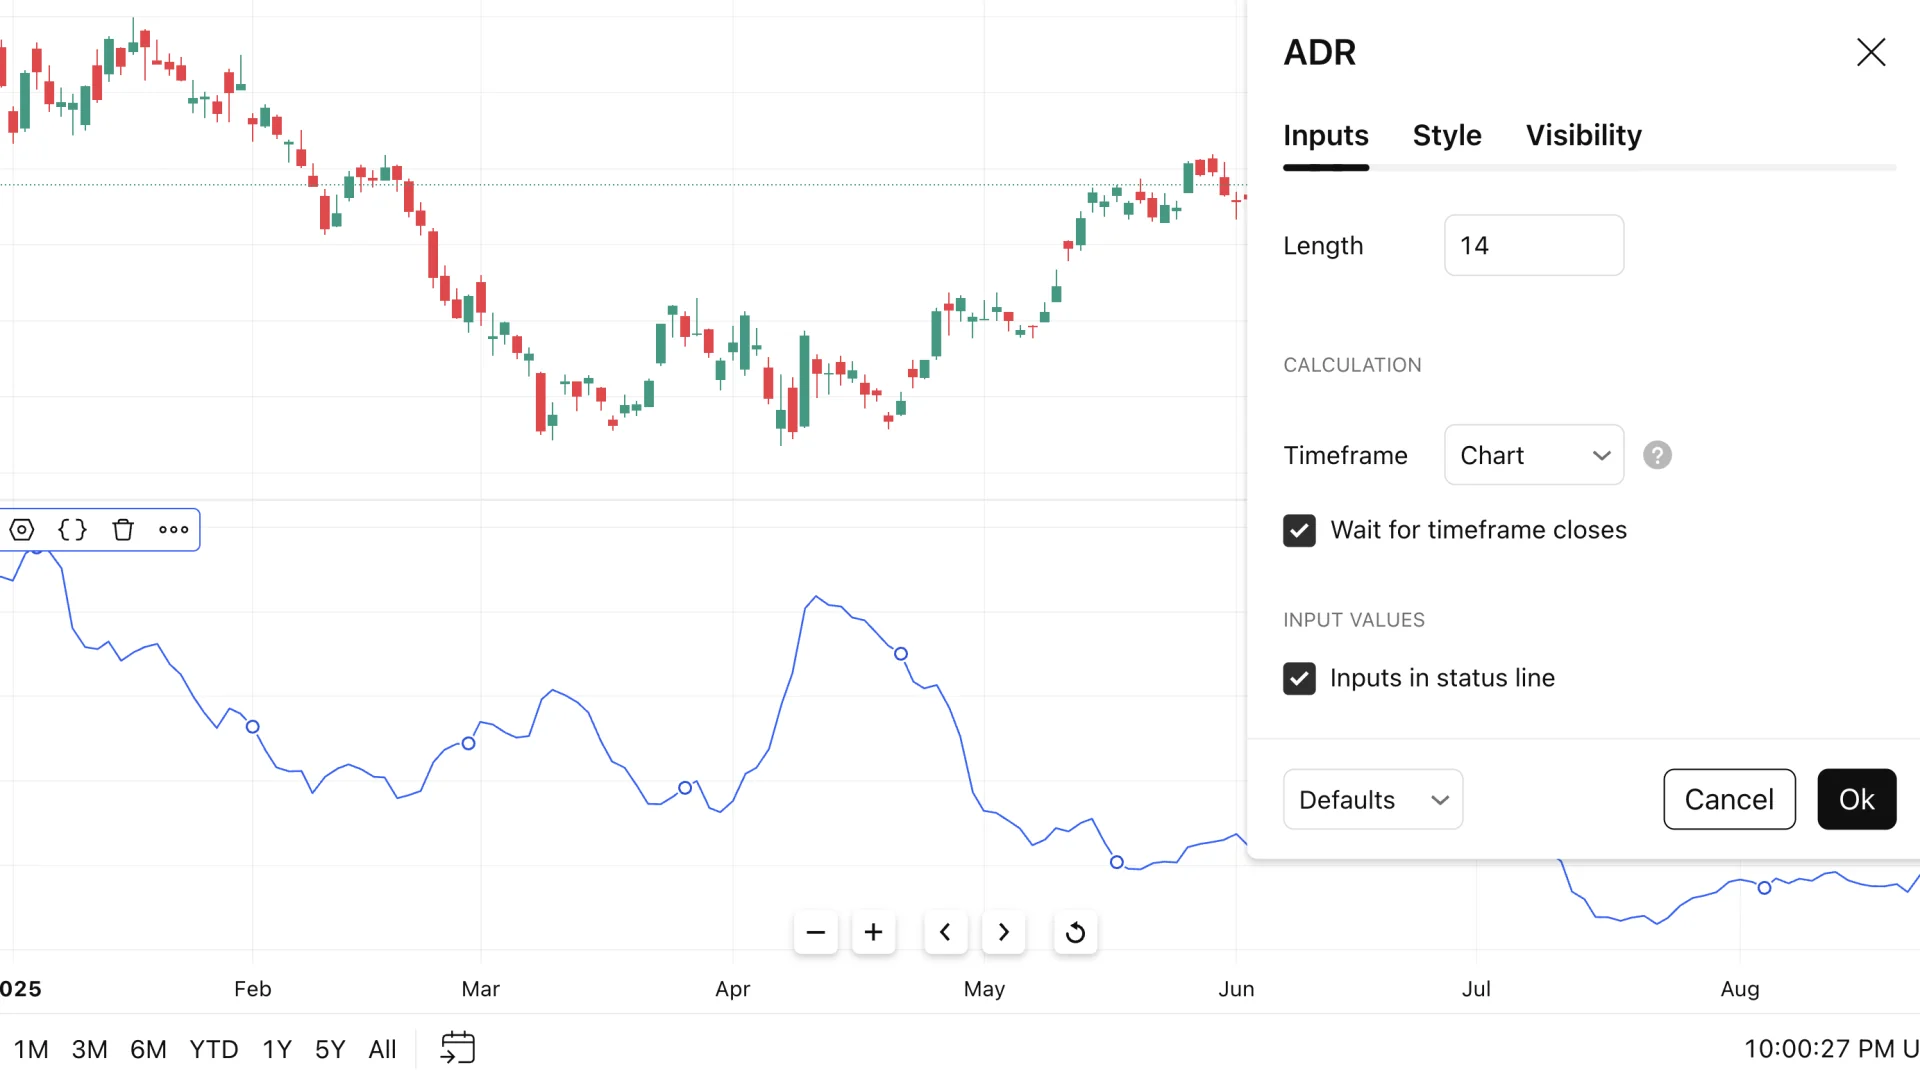
The built-in study’s main input is Length, the number of days averaged. The panel in the screenshot shows 14. Shorter lengths, such as 5 to 10 days, respond quickly to a change in volatility but let a single outlier day dominate; longer lengths, such as 20 to 50 days, smooth those outliers and lag when conditions change.
The Timeframe input allows the study to compute on a higher timeframe than the chart, and Wait for timeframe closes controls whether the value updates only when that timeframe’s bar completes. Style and Visibility tabs cover color, line width and which chart intervals show the study.
The built-in indicator does not offer a percentage display, alternative smoothing methods or fractional 25%, 50% and 75% levels. Those appear in community scripts and in the LuxAlgo implementation described below. If a percentage reading is needed on TradingView, the screener’s ADR% column provides it.
The daily candle follows the exchange session of the symbol. Changing the chart’s display time zone does not change a stock’s daily high and low, but whether extended-hours trading is part of the daily data does. NYSE core trading runs 9:30 a.m. to 4:00 p.m. ET; a range that includes pre-market and after-hours prints can be materially wider than a regular-session range. Record which basis the ADR reading uses.
ADR for Different Asset Classes
The formula is the same everywhere, but the unit and the session definition change. The figures below are illustrative magnitudes for reading the indicator, not current market statistics; read the live value on the chart.
- Stocks: ADR is quoted in currency. Two stocks can share a $3.00 ADR at very different prices, so compare ADR percent when screening. Regular-session and extended-hours bases produce different readings.
- Forex: ADR is usually read in pips. For most pairs a pip is 0.0001; for yen pairs it is 0.01. A pair averaging 80 pips per day and one averaging 140 pips need different stop distances and position sizes for the same cash risk. Spot forex trades roughly 24 hours a day, five days a week, so the “day” boundary depends on the broker’s server time.
- Cryptocurrencies: Markets trade continuously, and most charts roll the daily candle at 00:00 UTC. A 15-minute BTC chart with the LuxAlgo ADR indicator shows the levels reset at that boundary. There is no gap between sessions, so ADR and ATR are closer than they are for stocks.
- Commodities: Futures sessions have their own open and close times, and scheduled reports or supply announcements can expand a day’s range well beyond the average. Treat those days as regime information rather than as errors in the indicator.
Setting Up ADR on TradingView and Quant Charts
Adding ADR to Your Chart
On TradingView, open the chart, click Indicators, choose Technicals and select Average Daily Range, or type “ADR” in the search box. The built-in study plots the average value in its own pane below the price chart.
On Quant Charts, open the Average Daily Range page in the LuxAlgo Library and click Open on Quant Charts. The indicator is an overlay: it draws the projected ADR high and low around the current daily open, together with the open, an optional midpoint and an information table.
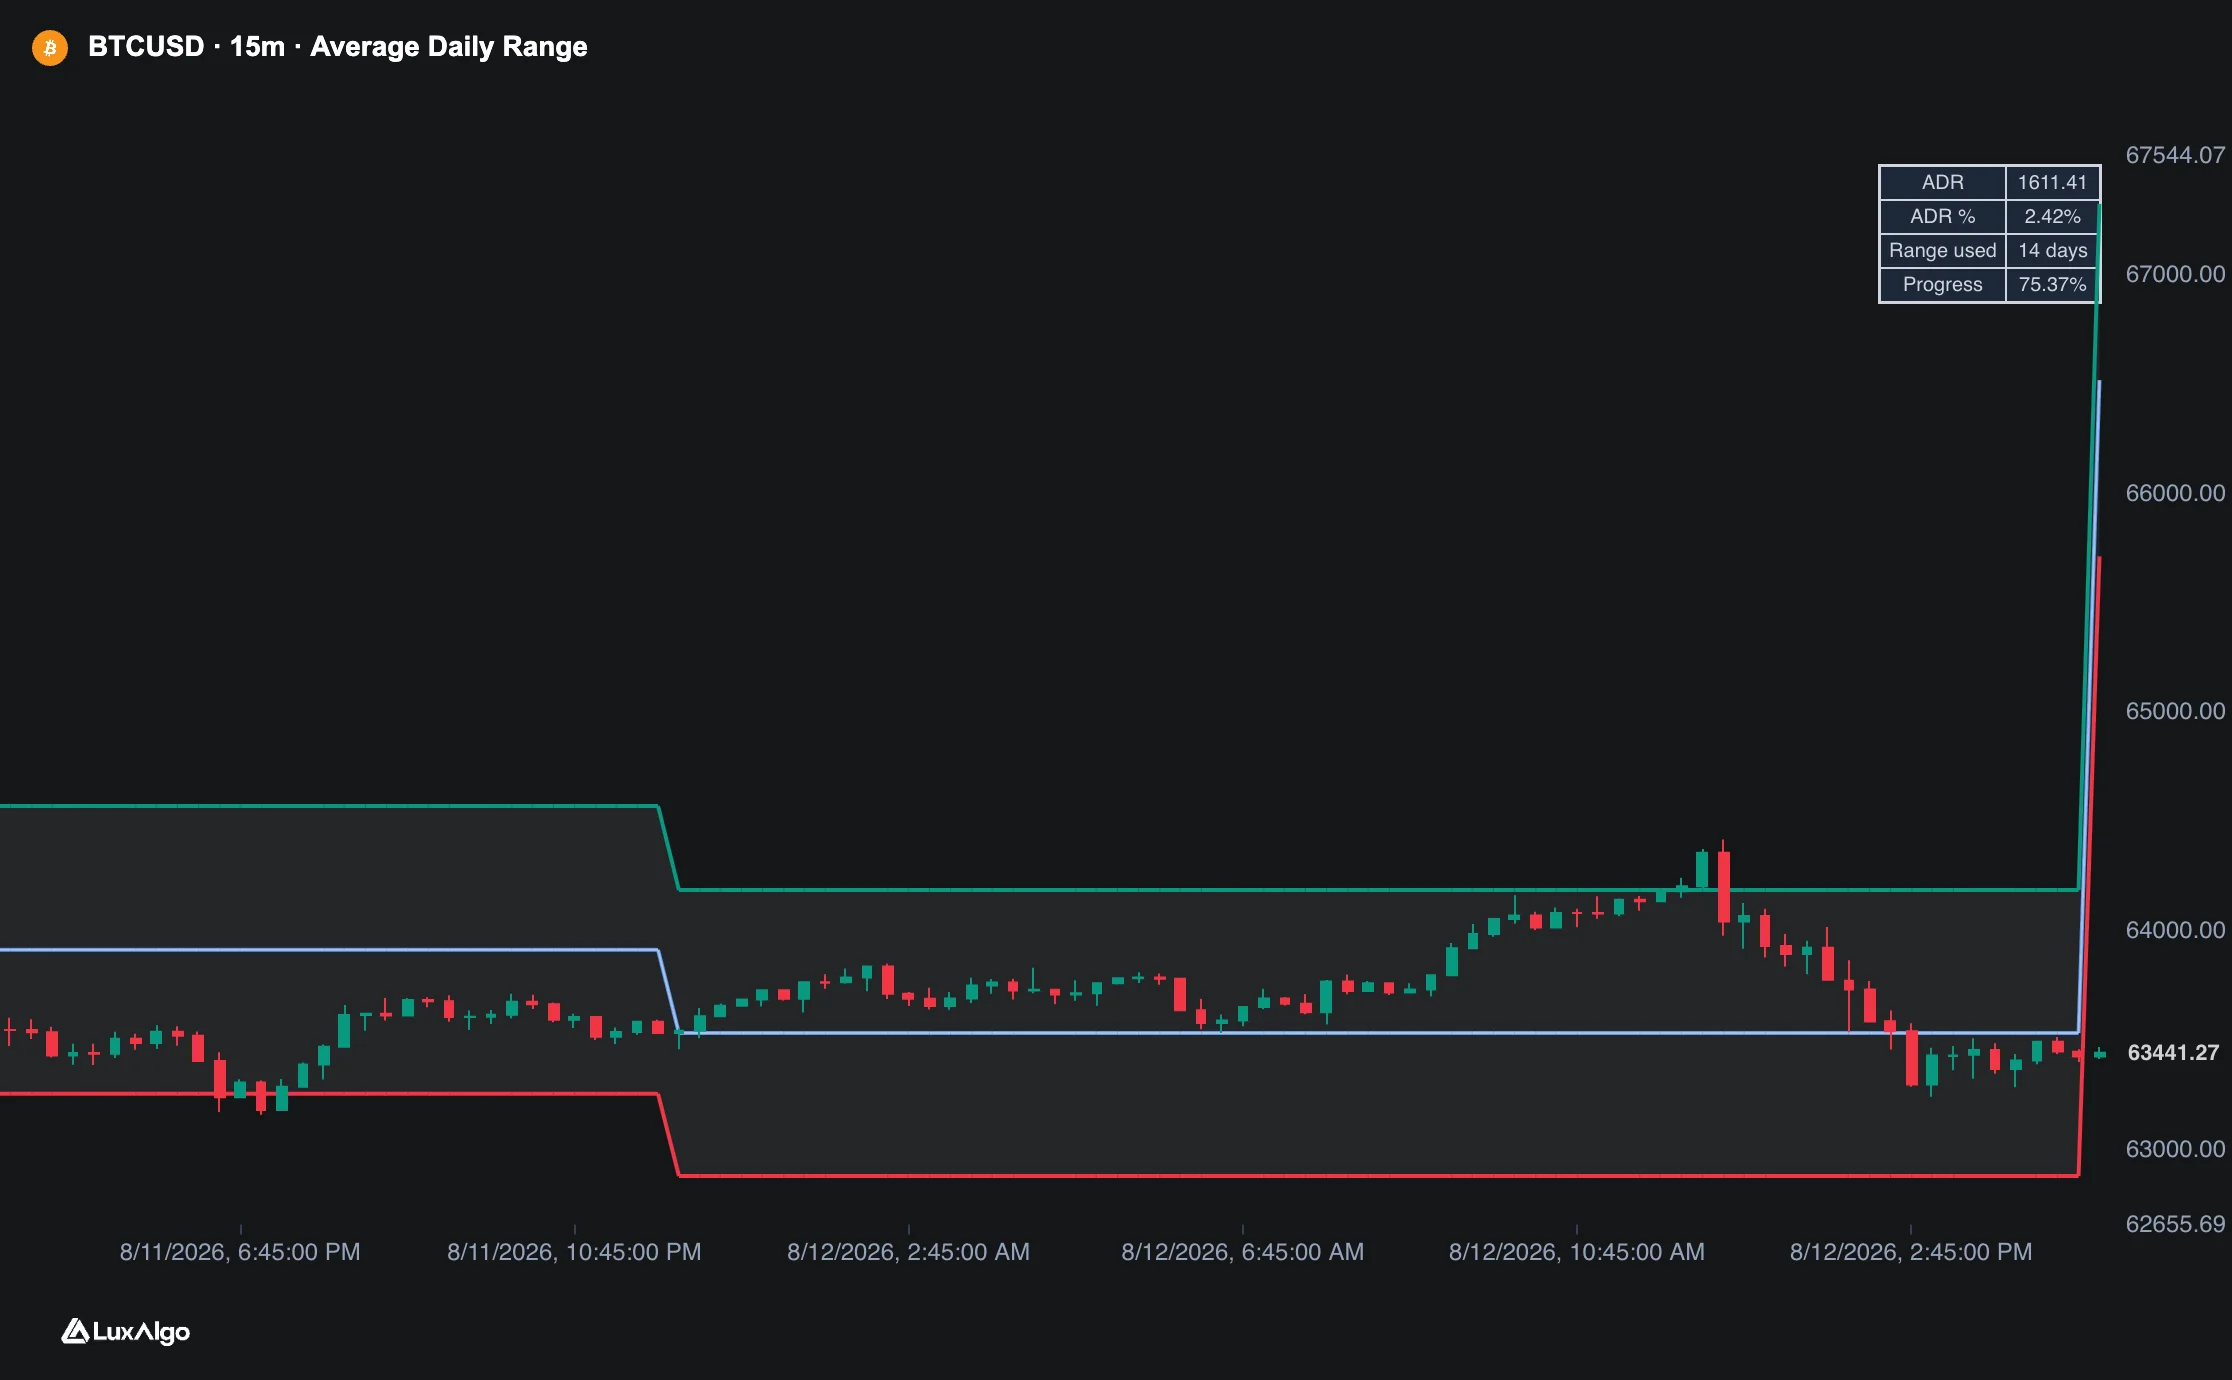
With the daily open as the anchor, the projected high is open + ½ ADR and the projected low is open − ½ ADR, so the zone between them is exactly one ADR wide. When a new day opens, the levels step to the new open, which is why the lines jump at the session boundary in the capture above. The projection assumes the day will travel about its average distance; it does not know which way.
Adjusting Settings for Your Trading Style
| Setting | Default | What it changes |
|---|---|---|
| ADR Length | 14 | Number of completed daily ranges averaged |
| Range Basis | Daily | Daily uses the exchange daily candle; Regular session uses the symbol’s regular-session daily candle when available |
| Show Daily Open | On | Plots the anchor price for the projection |
| Show ADR Midpoint | On | Plots the midpoint between projected high and low, which equals the open |
| Show Information Table | On | Displays ADR, ADR %, Range used and Progress |
| ADR High / ADR Low / Daily Open colors | Green / red / blue | Line colors only |
Day traders who need the indicator to track the current week’s conditions often shorten the length toward 5 to 10 days. Swing traders who use ADR as a sizing baseline usually prefer 20 days or more so that one news day does not reset every position size. Neither choice is “correct”; keep the same length long enough for today’s reading to be comparable with past readings.
The Progress row is the current day’s high-minus-low divided by ADR. A reading of 25% means the day has covered a quarter of its typical span so far; 100% means the day has already matched its average. The indicator also exposes three alert conditions: ADR High Reached, ADR Low Reached and ADR Completed, which fires when Progress crosses 100%.
Using LuxAlgo with ADR
The Average Daily Range indicator is a native Quant Charts tool. The Library’s market-structure and trend tools add context to an ADR study, but they do not compute ADR levels, and a signal from one of them is not an ADR reading.
To test an ADR rule rather than eyeball it, describe the rule to Quant in concrete terms, open Code to read the generated Pine Script® and click Run. The Making Strategies with Quant guide shows the workflow, and the native backtest guide explains the summary strip: net profit, trade count, win rate, maximum drawdown and profit factor, with inputs and properties such as commission and slippage adjustable without regenerating the code.
Using ADR in Trading Strategies
Setting Price Targets and Stop Losses
ADR gives a stop distance a reference point. If a stock averages a $3.00 daily range and a long entry sits near the day’s low, a stop $1.50 below the entry is inside the movement a normal day produces. Whether that is acceptable depends on the strategy; the point is to know it in advance rather than to discover it after a routine swing stops the trade.
Consider a hypothetical stock that opened at $50.00 with a 14-day ADR of $3.00, so ADR percent is 6%. The day’s low so far is $49.45 and the high is $50.20, a range of $0.75 or 25% Progress. A trader buys at $49.60 with a $25,000 account and a 0.5% risk budget of $125 per trade. See Risking It Right for the budgeting logic.
| Scenario | Calculation | Outcome before costs |
|---|---|---|
| Stop at ½ ADR below entry | $49.60 − $1.50 = $48.10; $125 ÷ $1.50, rounded down | 83 shares; $124.50 planned risk; $4,116.80 notional |
| Target if the day completes one full ADR from its low | $49.45 + $3.00 = $52.45; 83 × $2.85 | $236.55, about 1.9R |
| Target at 75% of ADR from the low | $49.45 + $2.25 = $51.70; 83 × $2.10 | $174.30, about 1.4R |
| Stop fills at $47.90 instead of $48.10 | 83 × $1.70 | $141.10 loss, about 1.13R |
| Stop at ¼ ADR instead | $125 ÷ $0.75 | 166 shares, but the stop sits inside ordinary intraday noise |
| ADR doubles to $6.00 | ½ ADR = $3.00; $125 ÷ $3.00 | 41 shares for the same $125 budget |
The targets assume the day reaches its average range in the trade’s direction. Many days do not, and some days reach it on the other side first. Position size falls as ADR rises because the stop distance grows; if the share count stays fixed while volatility doubles, the planned loss doubles with it. For swing trades that span several days, ADR describes one session and gaps are excluded, so an ATR-based distance is usually the better reference.
Finding Trading Opportunities with ADR Zones
Progress toward ADR is a context reading rather than a signal. The following interpretations are hypotheses to test on the specific market and timeframe, not rules that hold everywhere.
| Progress reading | Common interpretation | What can go wrong |
|---|---|---|
| Below 30% after the open | Compressed day; a breakout attempt may still have room | Quiet days can stay quiet; low progress is not a trigger |
| 80% to 100% early in the session | Typical range mostly used; continuation needs an above-average day | Trend and news days routinely exceed 100% |
| Above 100% | Range expansion; volatility is above its recent average | An expansion day can be the start of a new regime, not its end |
Morning breakouts that move quickly past the projected ADR high or low show that the day is already unusual. That fact supports a wider stop or a smaller size; it does not by itself confirm that the move will continue. Mean-reversion ideas near the ADR extremes need a defined trigger, a stop beyond the extreme, and evidence from a backtest, because an asset at 150% of ADR is by definition doing something its recent history did not.
In range-bound conditions the projected ADR high and low can serve as reference levels, and the range expansion and contraction cycle explains why several narrow days often precede a wide one. Direction still has to come from structure or a separate filter.
Automating ADR Strategies with LuxAlgo
An ADR rule is only testable once every part is explicit. A complete specification might read: compute the 14-day ADR from completed daily ranges; on a five-minute chart, enter long when price closes above the day’s opening range while Progress is below 30%; exit at the projected ADR high, or at a stop ½ ADR below entry, or at the session close. Give that description to Quant, review the Code for the exact comparisons, and click Run.
Read the whole Backtest Summary rather than one number. Trade count tells you whether the result is meaningful, profit factor and maximum drawdown describe the shape of the outcome, and the settings gear lets you add commission and slippage before deciding anything. Results depend on the symbol and interval tested; avoid Heikin Ashi charts for backtests because their averaged prices cannot be traded.
For monitoring without a full strategy, the native indicator’s alert conditions cover the projected high, the projected low and the completion of the average range. An alert tells you a level was reached; it does not evaluate the trade.
Reading ADR Data and Managing Risk
Narrow vs Wide ADR Ranges
Narrow readings mean recent days have covered less ground than usual. A stock whose ADR drifts from $4.00 to $1.50 is consolidating, and a run of narrow days such as an NR7 session is often watched for the eventual expansion. Compression raises the odds that the regime will change; it says nothing about the direction or the date.
Wide readings mean the average has been pulled up by large days. Stops sized in fixed dollars become too tight, and a position sized during the quiet period carries more risk than planned. Wide regimes tend to fade back toward normal eventually, but “eventually” can outlast a trading account, so size to current conditions rather than to the hoped-for reversion.
Earnings dates, central-bank decisions and geopolitical headlines can inflate a short ADR for weeks. When the average includes an event day, decide deliberately whether that day belongs in the baseline or whether a longer length should dilute it.
ADR Settings for Different Markets
- Equities: Large-cap names usually show steadier ADR readings than small caps, whose averages can be dominated by a single spike. Compare ADR percent across candidates rather than raw dollars, and check whether extended hours are in the daily data.
- Forex: Liquidity varies by session, so a day’s range depends on which sessions the broker’s daily bar spans. Compare readings only across charts that use the same daily boundary.
- Cryptocurrencies: Continuous trading and 00:00 UTC daily boundaries make the calendar day arbitrary. Weekend ranges can differ from weekday ranges, which a 14-day average blends together.
- Commodities: Scheduled inventory reports, production decisions and contract rollovers produce expansion days. Note them when reading a short length, and check the futures session definition the daily bar uses.
Short vs Long Period ADR Settings
| Aspect | Short length (5 to 10 days) | Long length (20 to 50 days) |
|---|---|---|
| Responsiveness | Adapts quickly to a change in volatility | Reflects changes more slowly |
| Noise | One outlier day can move the average sharply | Outliers are diluted |
| Typical use | Intraday range planning | Position-sizing baseline for swing trades |
| Risk management | Stops and sizes change often | More stable stops and sizes |
| Trade-off | Faster but less stable | Steadier but can lag a regime change |
Running two lengths at once, such as 10 and 30 days, shows whether current volatility is a temporary blip or a sustained shift. When the two readings agree, conditions are stable; when the short length is far above the long one, volatility has recently expanded and stop distances sized from the longer average will be too tight.
Conclusion
Key Takeaways
ADR is the average of daily high-minus-low ranges. It tells you how much an asset usually moves within a session, which makes it useful for judging stop distances, target sizes and how much of a typical day has been used. It excludes gaps, so ATR remains the better reference for risk held overnight.
TradingView’s built-in study plots the value; the LuxAlgo Average Daily Range indicator on Quant Charts projects the levels around the daily open, reports Progress and ADR percent, and exposes alerts. Neither version predicts direction, and every threshold in this article is a hypothesis until a backtest with costs supports it.
Next Steps for Traders
Add ADR to a chart you already trade, record the length and range basis, and compare its readings with the stops and targets you have actually been using. If a rule emerges, write it out completely, ask Quant to help implement it, inspect the Code and Run it across the symbols and intervals you trade. Pair the result with structure, support and resistance, and volume context before acting on it.
FAQs
How does the Average Day Range indicator help traders manage risk?
It quantifies the movement a normal day produces, so a stop can be compared with that distance before the trade. A stop well inside the average range is likely to be hit by ordinary fluctuation; a target beyond it asks for an above-average day.
What is the difference between ADR and ATR?
ADR averages each day’s high minus low. ATR averages true range, which also counts the gap from the prior close, and traditionally uses Wilder’s smoothing. On gap days ATR is larger, which matters for positions held overnight.
What ADR length should I use?
Both TradingView and LuxAlgo default to 14 days. Shorter lengths react faster but let one outlier dominate; longer lengths are steadier but lag regime changes. Keep one length consistently so readings are comparable over time.
Why do ADR values differ between platforms?
Different daily session definitions, extended-hours inclusion, treatment of the current bar and percentage denominators produce different numbers. TradingView’s ADR% divides by the close, while the LuxAlgo table divides by the daily open.
Does reaching 100% of ADR mean price will reverse?
No. It means the day has matched its recent average range. Trend and news days often exceed it, and an expansion day can begin a new volatility regime. Treat the reading as context and test any reversal rule before relying on it.
How can I test an ADR strategy with LuxAlgo?
Add the Average Daily Range indicator from the Library to Quant Charts, define the entry, exit and stop rules explicitly, ask Quant to help implement them, inspect the Code and click Run. Review trade count, drawdown and profit factor with commission and slippage applied.
References
LuxAlgo Resources
- Quant Charts
- LuxAlgo Quant
- Average Daily Range Indicator
- ATR Concept and Formula
- Average True Range Indicator
- Range Expansion and Contraction
- NR4/NR7 Narrow-Range Bars
- Period Opens
- Making Strategies with Quant
- Native Backtest Guide
- Risking It Right
External Resources
Read next