Balance of Power Indicator: Understanding Buyer vs Seller Control
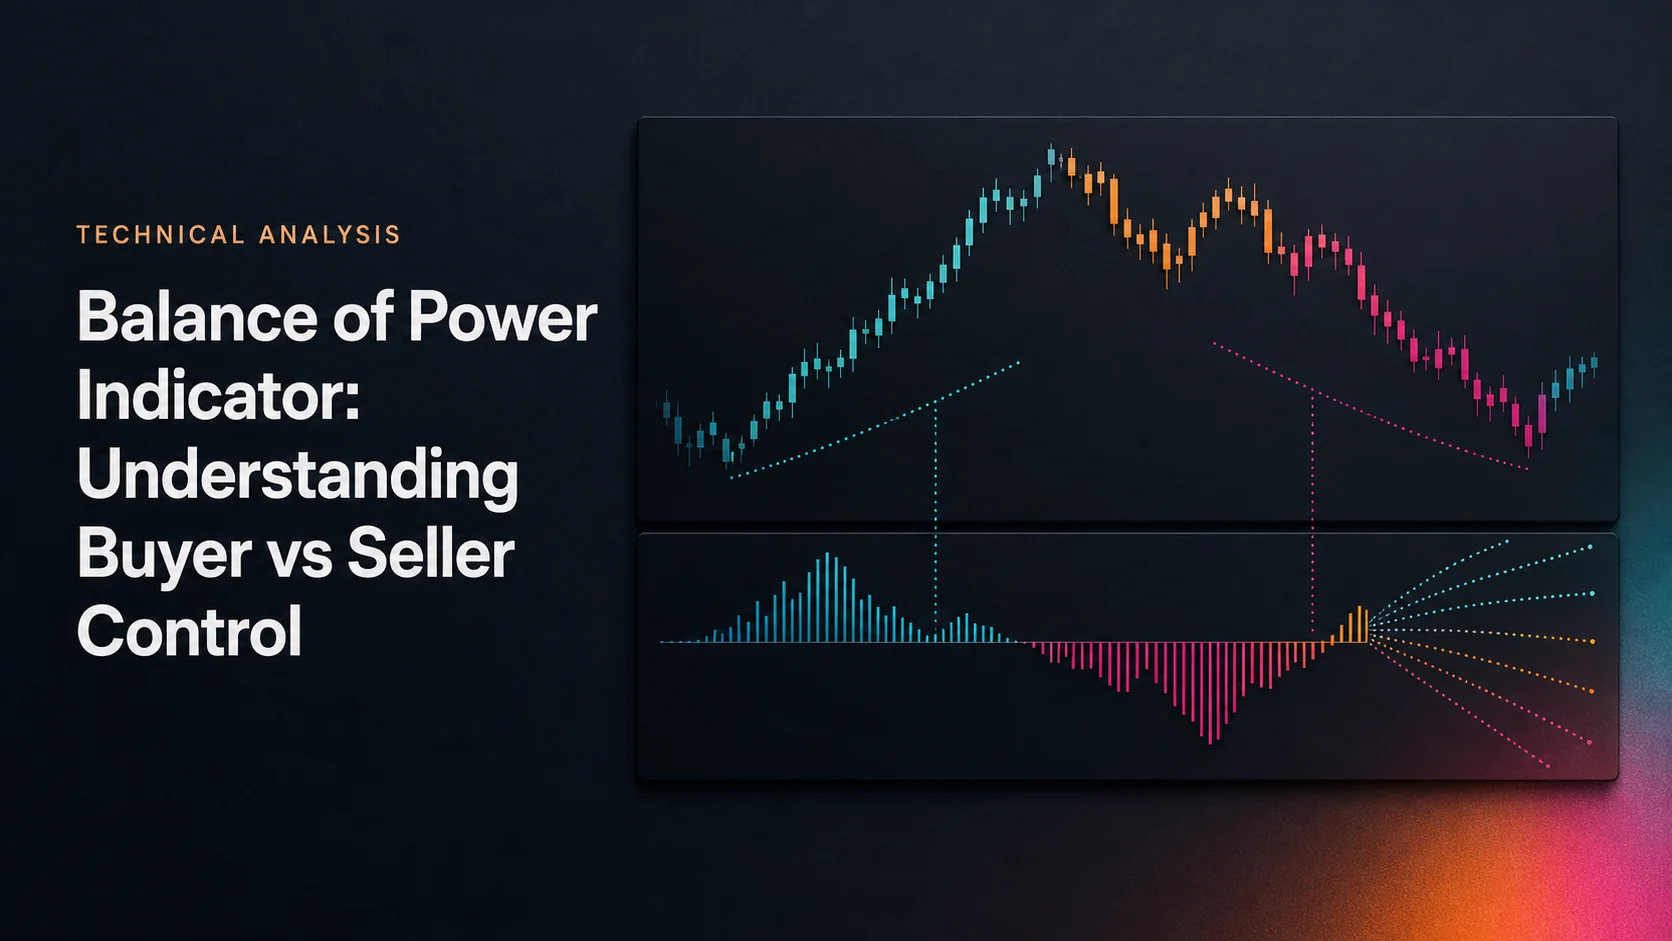
The Balance of Power (BOP) indicator scores who won each bar. It divides the distance from open to close by the bar's full range from low to high, so a bar that opens at its low and closes at its high scores +1, a bar that does the reverse scores −1, and a bar that closes back where it opened scores 0 however far it ranged in between. Igor Livshin introduced the formula in the technical press around 2001, and it spread because it packages an old tape-reading instinct, who controlled the session, into one bounded number per bar. Positive readings mean buyers kept the close near the top of the range; negative readings mean sellers kept it near the bottom. Because each bar is normalized by its own range, a quiet day's decisive close counts the same as a wild day's, which is exactly what a measure of control, rather than of movement, should do.
Key points:
- Formula: BOP = (Close − Open) ÷ (High − Low), bounded between −1 and +1, with 0 returned when high and low are equal.
- Raw versus smoothed: the raw series changes completely from bar to bar and is rarely readable on its own; most uses smooth it, commonly with a 14-period simple moving average, and read the smoothed line against zero.
- Signals: zero-line crossings of the smoothed line as regime shifts, divergence between price extremes and smoothed BOP, and the raw value as a bar-quality filter on entry bars.
- Not a volume indicator: BOP uses only open, high, low and close, which is what makes it useful where volume is missing or unreliable and an independent second opinion where volume exists.
- Blind spot: it measures control, not importance. A decisive close on a tiny inside bar and one on a huge breakout bar both score near +1.
The LuxAlgo Balance of Power in the Library is the standard build with optional smoothing and zero-cross alerts, and it opens on Quant Charts in one click. Quant, our coding agent, can turn a BOP rule into a strategy you can inspect in Code and test with Run.
Balance of Power (BOP) Indicator: Video Explainer
DouglasOnTrading published this explainer in February 2020. It walks through the formula and the basic zero-line reading; treat any chart examples as illustrations of the mechanics rather than as evidence about results.
How the Balance of Power Indicator Works
BOP looks inside a single bar and asks where the close landed relative to the open, as a fraction of everything the bar covered. It does not compare one bar with the next, which is what separates it from momentum and RSI, and it does not look at volume.
BOP Calculation Formula
BOP = (Close − Open) ÷ (High − Low)
The numerator is the signed candle body; the denominator is the full range including both wicks. The hypothetical table scores five bars with different anatomies at the same price level to show what the number rewards.
| Bar (hypothetical) | Open, High, Low, Close | Calculation | BOP |
|---|---|---|---|
| Bullish marubozu | $50.00, $52.00, $50.00, $52.00 | ($52.00 − $50.00) ÷ ($52.00 − $50.00) | +1.00 |
| Strong close with a lower wick | $50.50, $52.00, $49.50, $51.75 | ($51.75 − $50.50) ÷ ($52.00 − $49.50) | +0.50 |
| Doji | $51.00, $52.20, $49.80, $51.00 | ($51.00 − $51.00) ÷ ($52.20 − $49.80) | 0.00 |
| Long upper wick, weak close | $50.80, $53.00, $50.60, $50.70 | ($50.70 − $50.80) ÷ ($53.00 − $50.60) | −0.04 |
| Bearish marubozu | $52.00, $52.00, $50.00, $50.00 | ($50.00 − $52.00) ÷ ($52.00 − $50.00) | −1.00 |
The fourth row is the instructive one. The bar travelled $2.40 and finished ten cents below where it opened, so BOP scores it as a slight seller win; the long upper wick that a candlestick reader would call a rejection is captured only as a smaller body relative to the range. And because every bar is divided by its own range, a $2 body in a $4 range on a $50 stock and a $4 body in an $8 range on a $100 stock both score +0.50, which is what makes the reading comparable across instruments and volatility regimes.
Reading BOP Values and Charts
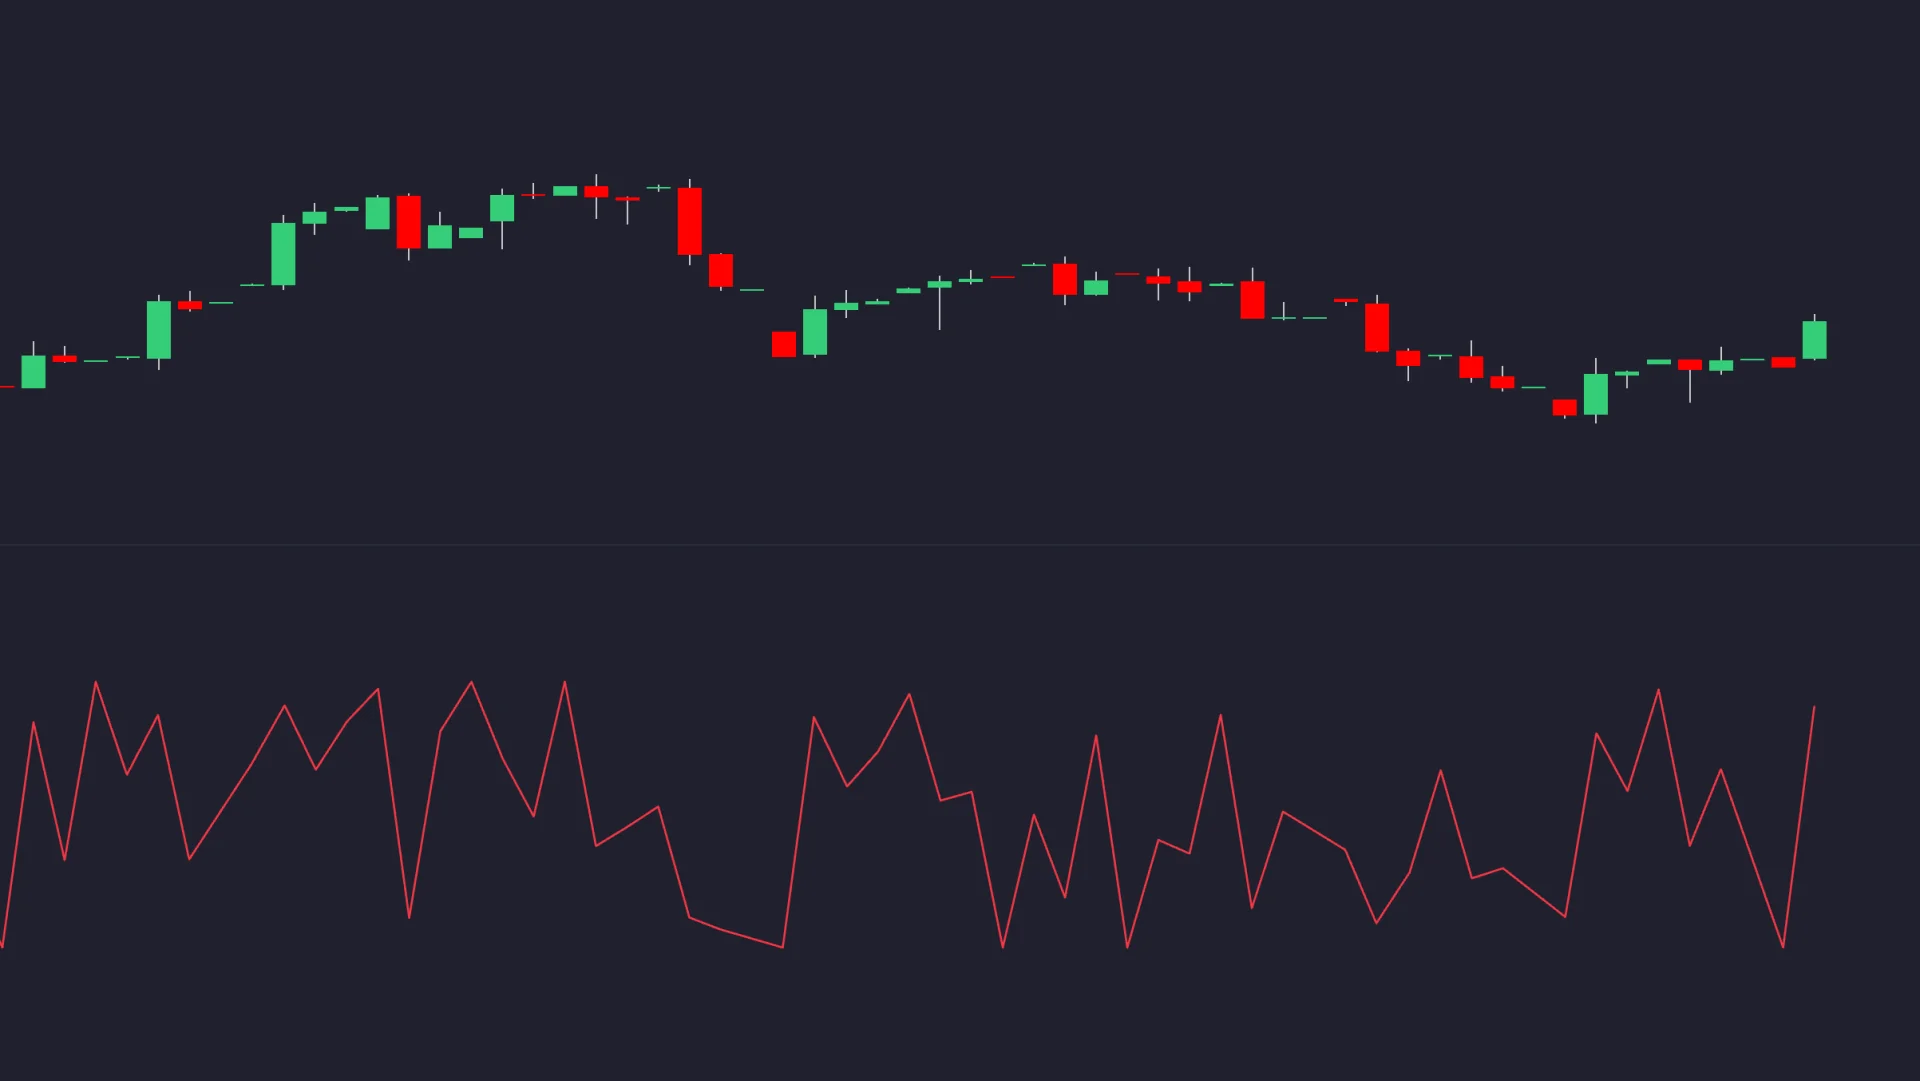
The scale runs from −1 to +1, but the limits are rare; they require a bar with no wicks at all. Most bars land well inside them, and the raw line jumps around: a marubozu followed by a doji swings the series from +1 to 0 with no memory in between. That per-bar independence is what makes BOP honest as a bar-quality check and unreadable as a raw line, so the standing convention is to smooth it before interpreting it. On the smoothed line, a persistent reading above zero means buyers keep winning the closes bar after bar; a persistent reading below zero means sellers do. That is a centerline regime read, and it says nothing about how far price has moved, only about who has been controlling the closes.
Smoothing BOP Data with Moving Averages
A 14-period simple moving average is the common default, and it is the smoothing the native indicator applies when its Smoothing input is enabled. Shorter smoothing flips the regime read quickly and noisily; longer smoothing holds a steadier but later verdict. The trade-off is the usual one and no length tests best across markets. Whatever you choose, note that smoothing changes the indicator's job: the raw value answers "who won this bar", the smoothed line answers "which side has been winning lately", and a rule should say which of the two it uses.
Reading Balance of Power Signals
Zero-Line Crossovers
A smoothed BOP crossing above zero says the average bar over the smoothing window has started closing above its open; crossing below says the reverse. TradingView's own documentation frames these crosses as the basic buy and sell suggestions, and the native indicator's two alerts, Zero Cross Up and Zero Cross Down, fire on them. Read them as regime shifts rather than triggers. When the line hovers near zero in rotational conditions it will cross repeatedly, and each cross means little; a cross that follows a sustained stretch on the other side, and that holds for several bars, carries more information. Test the cross with and without a hold requirement before deciding which version to trade.
Spotting Divergences
Smoothed BOP swings compared with price pivots follow the same grammar as any oscillator's regular divergence. Price grinding to new highs while smoothed BOP sinks toward zero means candle bodies are shrinking relative to their ranges: each push is being won by a thinner margin. That is a warning that conviction behind the advance is thinning, not a sell signal by itself; trends routinely extend through divergences. The mirror case at lows, price making a lower low while smoothed BOP makes a higher low, says selling pressure is easing. Either read needs a price trigger, such as a close through the most recent swing point, before it becomes a trade.
Extreme Readings Are Bar Quality, Not Overbought
Because BOP is a per-bar control score, a reading near +1 does not mean the market is overbought; it means one bar opened at its low and closed at its high. That makes the raw value a bar-quality filter rather than a stretch gauge. Requiring a strongly positive raw BOP on a breakout or entry bar biases entries toward bars that actually closed near their extreme instead of long-wick pokes, and it certifies the close, not the follow-through. If you want a measure of how stretched price is relative to its recent range, that is the job of the stochastic oscillator, which scores the close within the last N bars' range rather than within a single bar.
Using Balance of Power on Quant Charts
Setting Up the BOP Indicator
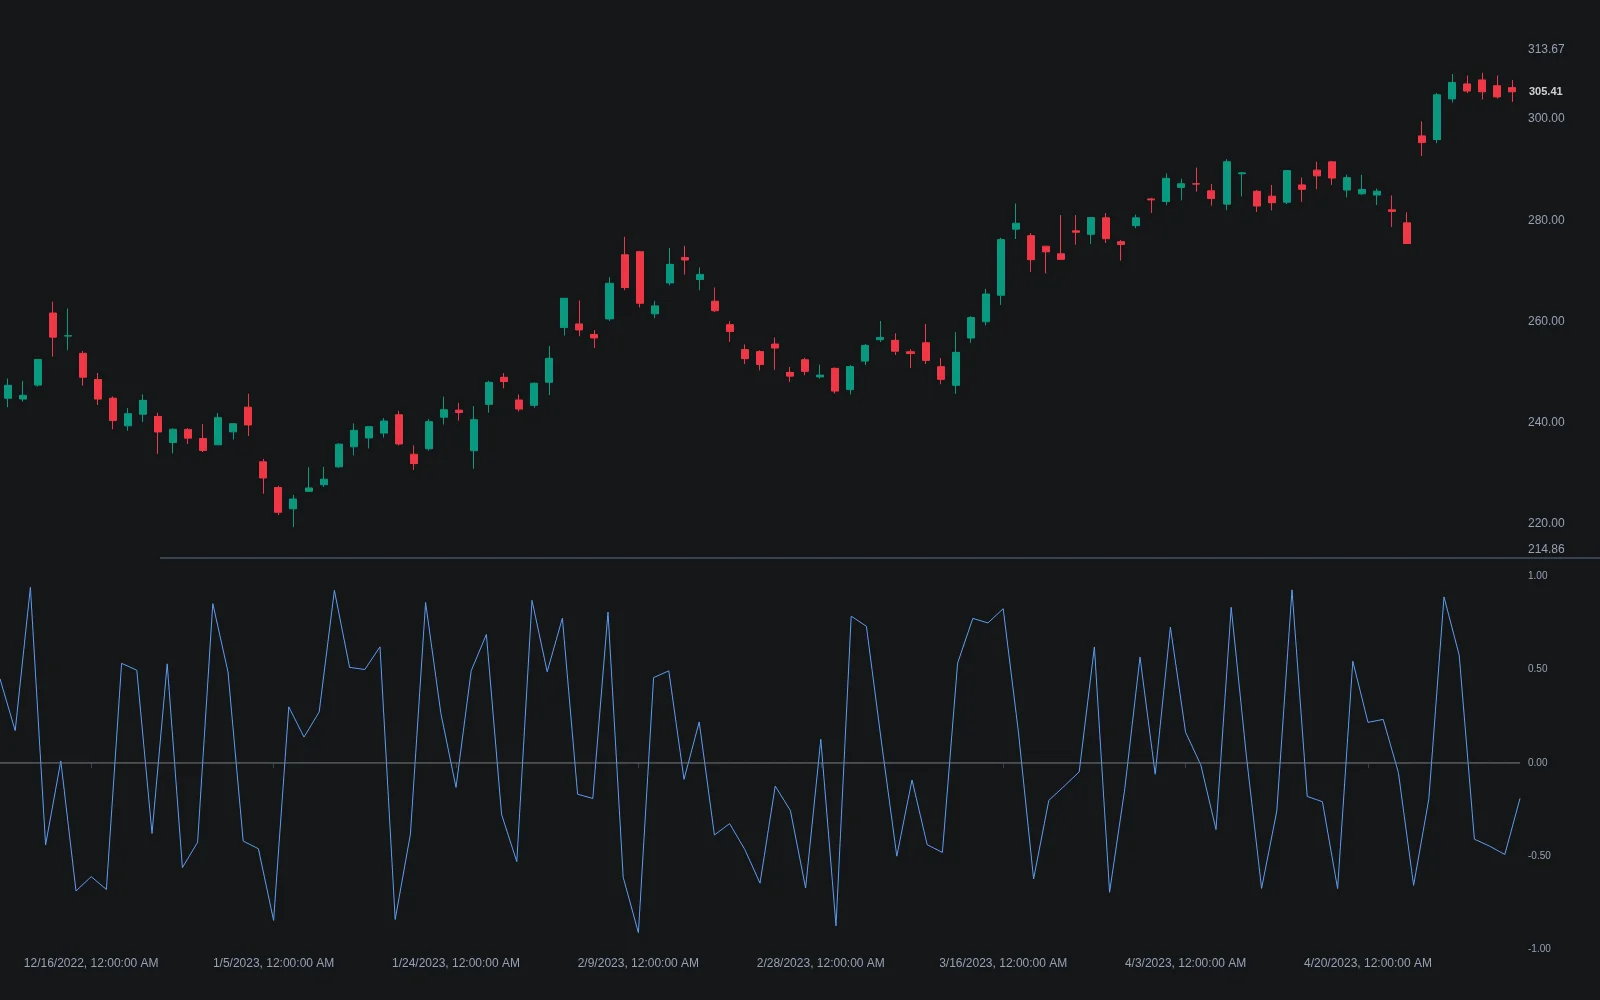
The Library's Balance of Power is Livshin's formula with nothing added: the raw per-bar value by default, 0 when a bar's high equals its low, a dashed zero line, and two inputs, Smoothing (off by default) and Length (14), which replace the raw series with its simple moving average when enabled. The two alerts, Zero Cross Up and Zero Cross Down, track whichever series is plotted. Its source is published on the page. A common setup is two copies: one raw, used to check the quality of the entry bar, and one smoothed, used to read the regime.
| Tool | What it measures | How it pairs with BOP |
|---|---|---|
| Balance of Power | Per-bar control: signed body over range | Raw as a bar-quality filter; smoothed against zero for regime; Zero Cross alerts |
| Stochastic | Where the close sits within the last 14 bars' range | Answers the stretch question BOP does not; both bounded and price-only |
| Relative Strength Index | Average gains versus losses between bars | Structurally independent of BOP, so agreement between them is worth something |
| Support and Resistance Levels with Breaks | Pivot levels with volume-filtered breaks | Supplies the location and volume read that BOP lacks |
Pairing BOP with Other Reads
BOP is built within bars, RSI between them and the stochastic across a window, so the three are structurally independent and their agreement is a stronger claim than any one alone. Where volume data is trustworthy, a flow measure such as volume delta scores participation while BOP scores control; they usually agree, and their disagreements, a strong close on weak delta or the reverse, flag bars where shape and flow tell different stories. Where volume is missing or unreliable, spot forex, thin crypto feeds and synthetic spreads, BOP stands in for the flow measures that cannot be computed honestly. Location comes from structure: a bar-quality read means more at a tested support or resistance zone than in the middle of nowhere, and the native Support and Resistance Levels with Breaks supplies that context.
A Worked Rule with Position Sizing
Consider a hypothetical stock on a daily chart, a $25,000 account and a 1% risk budget of $250. The rule: buy the next open after a close above a tested resistance zone when the raw BOP of the breakout bar is at least +0.6 and the 14-period smoothed BOP is above zero, with the stop below the zone's far edge and a first target at the next zone. See Risking It Right for the budgeting logic.
| Step | Calculation | Result before costs |
|---|---|---|
| Breakout bar | Open $61.10, high $62.40, low $60.90, close $62.20; resistance zone $61.20 to $61.60 | Raw BOP = ($62.20 − $61.10) ÷ ($62.40 − $60.90) = +0.73; smoothed BOP +0.18 |
| Entry | Buy next open | $62.30 |
| Stop beyond the zone's far edge | $61.20 minus a $0.30 allowance | Stop $60.90; $1.40 risk per share |
| Position size | $250 ÷ $1.40, rounded down | 178 shares; $249.20 planned risk; $11,089.40 notional |
| First target at the next resistance zone | $65.10 − $62.30 | $2.80 reward, about 2.0R |
| Filter rejects a second setup | Breakout bar with raw BOP +0.15 (long upper wick) | No trade; the rule demanded a decisive close |
| Gap through the stop, fill at $60.40 | 178 × ($62.30 − $60.40) | $338.20 loss, about 1.36R; a stop level is not a guaranteed fill |
The filter row is the point of using BOP this way: it does not predict the follow-through, it declines the breakouts whose bars did not close with conviction. Whether declining them improves results is what the test reports, and the honest comparison is the same breakout rule with and without the BOP condition.
Testing a BOP Rule with Quant
Write the rule completely: the zone definition, the trigger close, the raw BOP threshold on the entry bar, the smoothed length and its zero condition, the stop, the target and the position sizing. Describe it to Quant, inspect the Code to confirm that BOP is read from the closed breakout bar and that the smoothed length matches what you intend, and click Run. The Making Strategies with Quant guide shows the workflow, and the native backtest guide explains the Backtest Summary: net profit, trade count, win rate, maximum drawdown and profit factor, with commission and slippage set in the strategy properties.
Compare the rule with the BOP condition against the same rule without it, and the raw threshold at two or three levels, on identical data and costs. Read trade count before return, and hold out a period the thresholds never saw.
BOP Pros, Cons and Trading Tips
Benefits of the BOP Indicator
BOP is bounded, price-only and comparable across instruments and volatility regimes, because every bar is normalized against itself. It works where volume is missing or unreliable and gives an independent second opinion where volume exists. Its smooth swings, once averaged, make divergences easy to mark against price. And its raw value is one of the few honest bar-quality filters available: it says, without interpretation, whether a bar closed with conviction.
BOP Indicator Drawbacks
The raw series is noise by construction, and smoothing it introduces the lag that comes with every average. It measures control, not importance, so it cannot tell a decisive close on an inside bar from one on a breakout bar; significance has to come from structure, location or a volatility read alongside. A long-wick rejection registers only as a small body relative to range, which understates what candlestick readers see in it. And gaps enter the calculation only through the bar that follows them: a bar that gaps up and drifts lower all day scores negative, however bullish the gap.
Trading Tips
- Say which series a rule uses. Raw BOP is a bar-quality filter; smoothed BOP is a regime read. Mixing the two without saying so produces rules that cannot be tested.
- Pair it with a location. A decisive close at a tested zone means more than the same close mid-range; the indicator supplies control, structure supplies significance.
- Demand a price trigger for divergence. A fading smoothed BOP at new highs is a warning; a close through the most recent swing low is the event.
- Prefer BOP where volume is untrustworthy, and treat it as a second opinion, not a replacement, where volume is good.
- Test the filter, not the story. Compare the rule with and without the BOP condition on identical data and costs before making it a requirement.
Conclusion
Balance of Power asks one narrow question of each bar, who won the close, and answers it with one bounded number. Smoothed and read against zero it describes which side has been controlling the closes; raw, it grades the conviction of a single bar. What it cannot do is say whether a bar mattered, how far price has travelled or how many participants were involved, and its noisiness means it is rarely useful unsmoothed as a line. Used as a filter inside a rule that takes location from structure and size from the stop, it earns a place; used as a standalone signal, it produces the whipsaw that its own zero-line crosses generate in rotational tape.
The native Balance of Power on Quant Charts provides the standard calculation with optional smoothing and zero-cross alerts, and Quant can build and test the complete rule around it. Whatever the test shows, the scores will be the same; the question is whether the rule around them earns its place.
FAQs
Is Balance of Power a volume indicator?
No. Despite the name it is computed from open, high, low and close only: the candle body divided by the candle range. It infers buying or selling pressure from where the bar closed within its range, not from traded volume, which makes it usable on markets with missing or unreliable volume and complementary to true flow measures such as volume delta.
What do BOP readings of +1 and −1 mean?
A reading of +1 means the bar opened exactly at its low and closed exactly at its high, a full bullish marubozu; −1 is the bearish mirror. Those are the scale's hard limits and they are rare. Most bars land well inside them, and single-bar readings are noisy, which is why BOP is normally smoothed before anyone reads it.
What smoothing should Balance of Power use?
A 14-period simple moving average is the common default and the native indicator's Length when Smoothing is enabled. Shorter smoothing preserves responsiveness and noise together; longer smoothing cleans the zero-line read and delays it. No length tests best across markets, and a rule should state whether it reads the raw or the smoothed series.
Does a BOP reading near +1 mean the market is overbought?
No. BOP scores a single bar's control, so +1 says one bar closed at its high after opening at its low. It says nothing about how stretched price is relative to recent bars, which is the stochastic's question. Treat extreme raw readings as a bar-quality filter, not as an overbought or oversold gauge.
How does BOP differ from the stochastic and RSI?
The stochastic scores the close within the last N bars' range and RSI aggregates gains and losses between bars, while BOP scores the close against the open within each single bar. The three are structurally independent, so their agreement is a stronger claim than any one of them alone, and their disagreements are information too.
Can I test a Balance of Power rule on Quant Charts?
Yes. Open the Balance of Power from the Library with Open on Quant Charts, describe the complete rule to Quant including the raw threshold, the smoothed length and zero condition, the zone, trigger, stop and sizing, inspect the Code and click Run. Compare it with the same rule without the BOP condition under the same costs.
References
LuxAlgo Resources
- Quant Charts
- LuxAlgo Quant
- Balance of Power Indicator
- Balance of Power Concept
- Stochastic Indicator
- Relative Strength Index Indicator
- Support and Resistance Levels with Breaks
- Centerline Regime
- Regular Bullish and Bearish Divergence
- Stochastic Oscillator
- Volume Delta
- Simple Moving Average
- S/R Zone
- Making Strategies with Quant
- Native Backtest Guide
- Risking It Right
External Resources
Read next