BBTrend Indicator: Combining Bollinger Bands and Trend Analysis
BBTrend is John Bollinger's trend indicator built from two sets of his own bands. It plots 20-period and 50-period Bollinger Bands, both at two standard deviations, and asks how the two envelopes sit relative to each other: in an uptrend the upper bands converge while the lower bands spread apart, in a downtrend the lower bands converge while the upper bands spread, and in a range the two pairs are roughly equidistant. The histogram is the difference between those two gaps, so it reads positive in uptrends, negative in downtrends and near zero when nothing is trending. The bar shading adds a second layer: a bar that is larger than the one before it marks momentum building, a bar that is smaller marks momentum fading, and Bollinger's published guidance treats those shading changes, the peaks and troughs of the histogram, as the moments to pay attention rather than the zero line itself.
Key points:
- Two envelopes, one difference: BBTrend = |lower20 − lower50| − |upper20 − upper50|, normalised; the sign gives direction and the magnitude gives trend strength.
- Peaks and troughs matter: a histogram peak inside a trend often marks a consolidation, and a bar-shading flip is the early sign that momentum has turned.
- Not a signal generator: crosses of the zero line whipsaw in ranges like every trend indicator; Bollinger pairs the histogram with structure such as a two-bar reversal at a band.
- Lengths are adjustable: 20 and 50 are the published defaults, and any pair of lengths can be substituted to match the holding period.
BBTrend itself is a TradingView built-in. The LuxAlgo Bollinger Bands and Bollinger Bands Breakout Oscillator cover the underlying bands and band-pressure reads on Quant Charts, and Quant, our coding agent, can reproduce the BBTrend formula from the description above as a script you can inspect in Code and test with Run.
BBTrend on a Chart
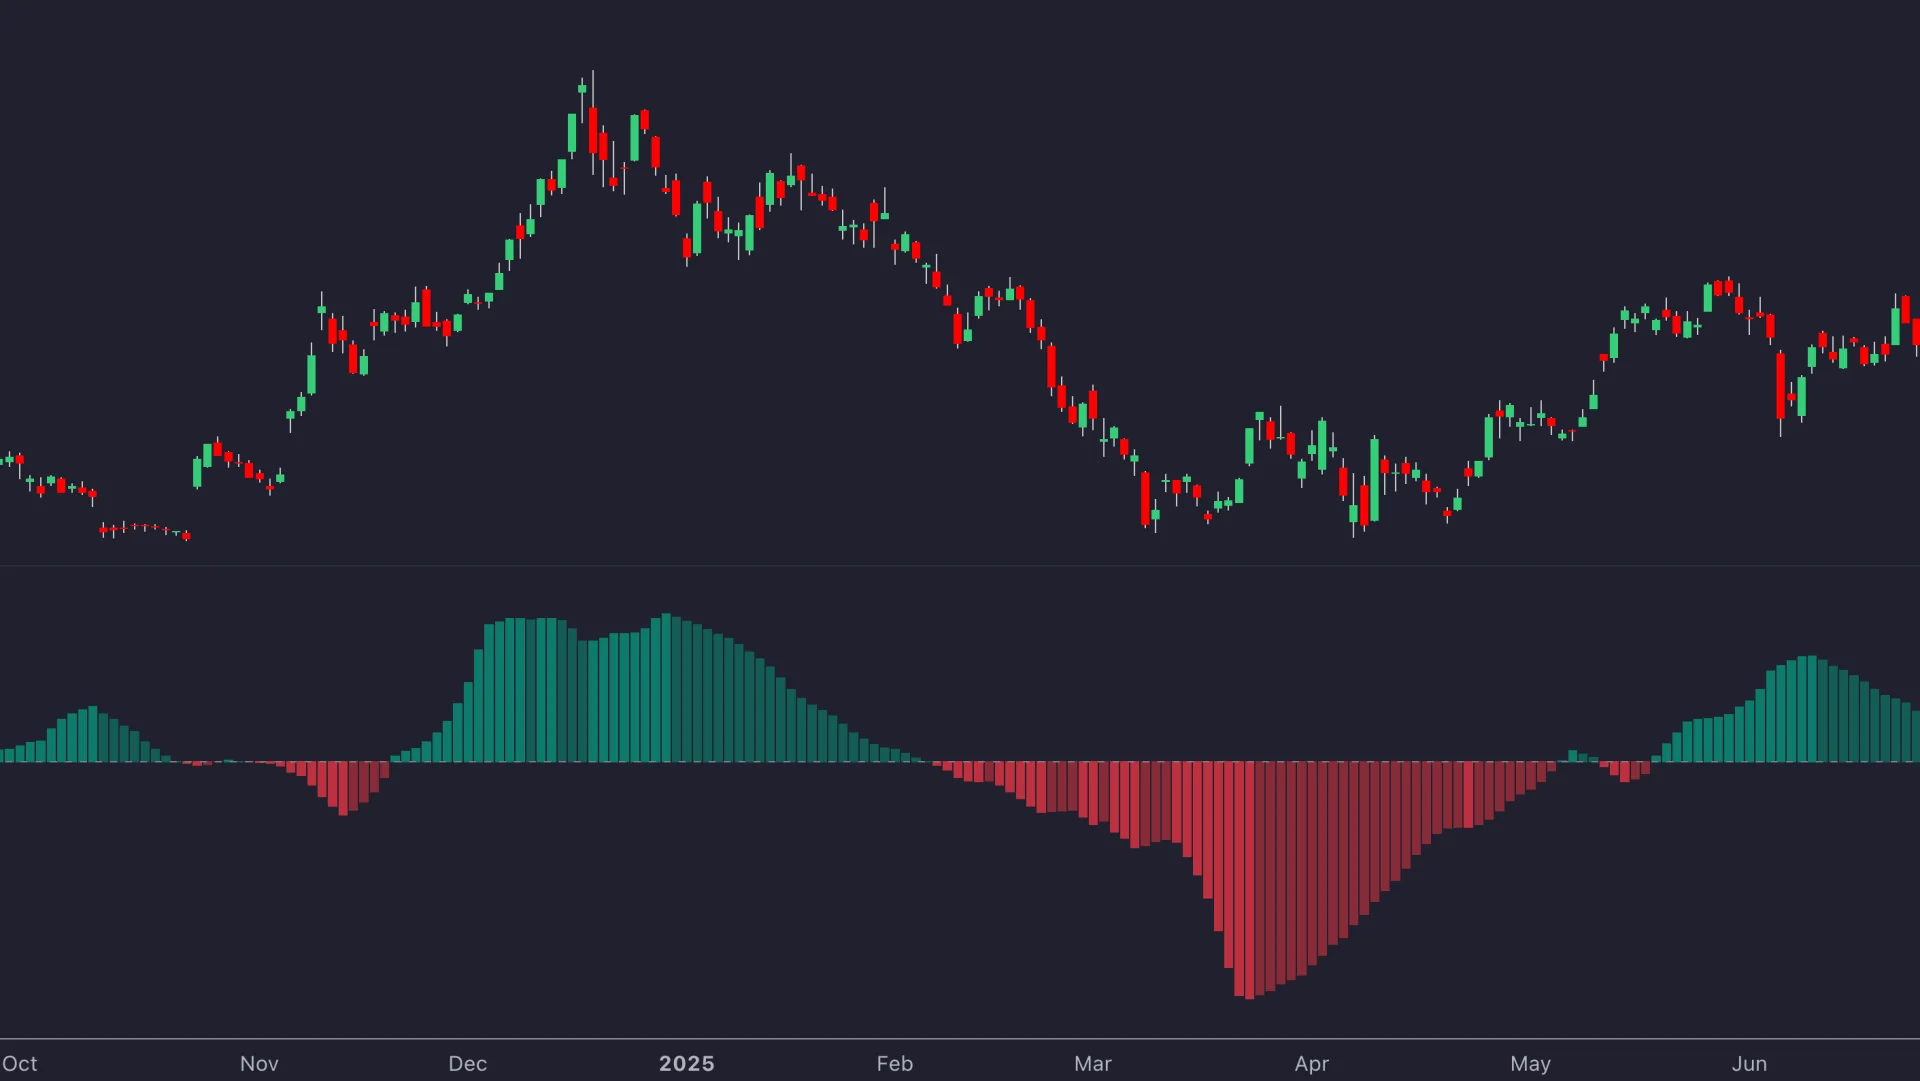
Video: TradingView's BBTrend Tutorial
TradingView published this tutorial in June 2024 when BBTrend was added as a built-in. It walks through the two-envelope construction, the histogram shading and the settings.
How BBTrend Is Calculated
The indicator came from an observation Bollinger describes in his published notes: traders often plot the 20- and 50-period bands on the same chart, and the way the two pairs of bands move relative to each other tracks the trend. In an advance the 20-period envelope sits high inside the 50-period one, so the two upper bands run close together while the two lower bands separate. In a decline the picture inverts. BBTrend measures exactly that.
The Formula
- Compute 20-period Bollinger Bands: a 20-bar simple moving average with bands two standard deviations above and below.
- Compute 50-period Bollinger Bands the same way.
- Take the absolute gap between the two lower bands and subtract the absolute gap between the two upper bands.
- Normalise the result. TradingView's built-in divides by the 20-period middle band and multiplies by 100, so the histogram reads as a percentage of price.
The table applies the formula to three hypothetical band configurations at a price near $100.
| Regime | 20-period bands (upper / lower) | 50-period bands (upper / lower) | Lower gap − upper gap | BBTrend |
|---|---|---|---|---|
| Uptrend: 20-period average above the 50-period average | $104 / $96 | $103 / $91 | |96 − 91| − |104 − 103| = 5 − 1 = +4 | +4.0 |
| Downtrend: 20-period average below the 50-period average | $104 / $96 | $109 / $97 | |96 − 97| − |104 − 109| = 1 − 5 = −4 | −4.0 |
| Range: averages aligned, 50-period bands slightly wider | $104 / $96 | $105 / $95 | |96 − 95| − |104 − 105| = 1 − 1 = 0 | 0.0 |
Two properties follow from the arithmetic. Because both envelopes are built from the same price series, BBTrend is really a statement about where the short-term average and its volatility sit relative to the longer-term average and its volatility; it is a smoothed, volatility-aware cousin of a moving-average spread. And because standard deviation reacts to outlier bars, a single wide-range bar can move the 20-period bands sharply and produce a histogram jump that the trend itself did not earn, which is one reason the published reading rules emphasise shading changes and structure rather than the raw level.
Reading the Histogram
Positive bars mark an uptrend, negative bars a downtrend, and the bar height tracks trend strength. The shading is the more useful layer. In TradingView's implementation a bar that is larger in magnitude than the previous bar prints in the lighter shade and a bar that is smaller prints in the darker shade, so a switch from light to dark in either direction says the trend's momentum has stopped increasing. Bollinger's published guidance, as summarised in TrendSpider's release notes, reads the indicator as follows.
| Read | What it means | How it is used |
|---|---|---|
| Sign of the histogram | Positive: uptrend. Negative: downtrend. Near zero: no trend | Direction filter, not an entry trigger |
| Bar shading flip | Momentum has stopped building (light to dark) or resumed (dark to light) | Early warning; a peak or trough in the histogram is a candidate trend start or end |
| Peak or trough inside a strong trend | Often a consolidation rather than a reversal | Expect a pause; look for the next dark-to-light flip to confirm resumption |
| Peak or trough plus a two-bar reversal at a band | The histogram turn coincides with a price reversal pattern at the upper or lower band | Bollinger's stated confirmation for a reversal read |
| Trend line drawn on the histogram | A break of the histogram's own trend line | The 'time to pay attention' warning ahead of a price change |
What the Zero Line Is and Is Not
A cross of the zero line is the simplest read and the one most write-ups over-sell. It fires when the 20-period average moves through the 50-period average with the band geometry agreeing, which is genuinely later and cleaner than a raw 20/50 average crossover, but it inherits the same weakness: in a range the two averages braid and the histogram flips sign repeatedly around zero. Treat the cross as a regime label that says which side to trade, and take the trade from price structure. The band-shading peaks and troughs, not the crosses, are where Bollinger's own guidance puts the timing information.
Using BBTrend in a Strategy
Regime First
The most defensible use is as a regime filter. Trade long setups only while the histogram is positive and short setups only while it is negative, and stand aside, or switch to mean-reversion tactics, when it hovers near zero. That filter costs trades in the transitions and earns its keep by removing counter-trend entries during sustained moves. A higher-timeframe version of the same read, for example a daily BBTrend positive before taking hourly longs, is a standard trend regime label and behaves like one: late at turns, valuable in the middle of trends.
Consolidation, Squeeze and Breakout
A histogram that fades toward zero after a strong run usually marks consolidation, and Bollinger's notes say exactly that: peaks and troughs during strong trends often flag pauses rather than reversals. The bands themselves carry the complementary read. A Bollinger squeeze, measured with BandWidth falling to a lookback low, says volatility has compressed and a directional move may be building without saying which way; the direction comes from the breakout itself and, on the BBTrend pane, from the histogram leaving zero and building lighter-shaded bars. Bollinger's own warning applies to the first move out of a squeeze: it can be a head fake, so the histogram's follow-through over the next several bars matters more than the first cross.
Confirmation That Uses Different Inputs
BBTrend is built from price alone, so the confirmation that adds information comes from inputs it does not already contain: market structure (a break of structure or a higher low in the direction of the histogram), volume on the breakout bar, and the position of price within the bands read through %B. Adding another price-based oscillator mostly adds correlation. Position sizing should not be scaled up by histogram height; a tall bar means the move has already happened, and the stop distance, not the indicator's enthusiasm, decides the size.
A Worked Regime-Filtered Trade
Consider a hypothetical stock on a daily chart, a $25,000 account and a 1% risk budget of $250. The rule is a long when the daily BBTrend is positive with a dark-to-light shading flip, price has printed a higher low, and the entry is the close above that swing's high, with the stop below the higher low and a target at 2R. See Risking It Right for the budgeting logic.
| Step | Calculation | Result before costs |
|---|---|---|
| Regime | Daily BBTrend positive; bar shading flips dark to light after a pullback | Longs permitted |
| Entry | Close above the pullback swing high | Buy $64.80 |
| Stop below the higher low | $63.10 low minus a $0.20 allowance | Stop $62.90; $1.90 risk per share |
| Position size | $250 ÷ $1.90, rounded down | 131 shares; $248.90 planned risk; $8,489 notional |
| Target | Entry plus 2 × $1.90 | $68.60; 2.0R |
| Gap through the stop, fill at $62.30 | 131 × ($64.80 − $62.30) | $327.50 loss, about 1.3R; a stop level is not a guaranteed fill |
| Exit on momentum | Histogram peaks and shades dark for two bars before the target | Optional scale-out; the rule for it must be written before the trade |
BBTrend supplied the regime and the timing cue, structure supplied the entry and the stop, and the stop distance supplied the size. Whether the shading flip improves on a plain positive-histogram filter is the question the test answers.
Bollinger Tools on Quant Charts
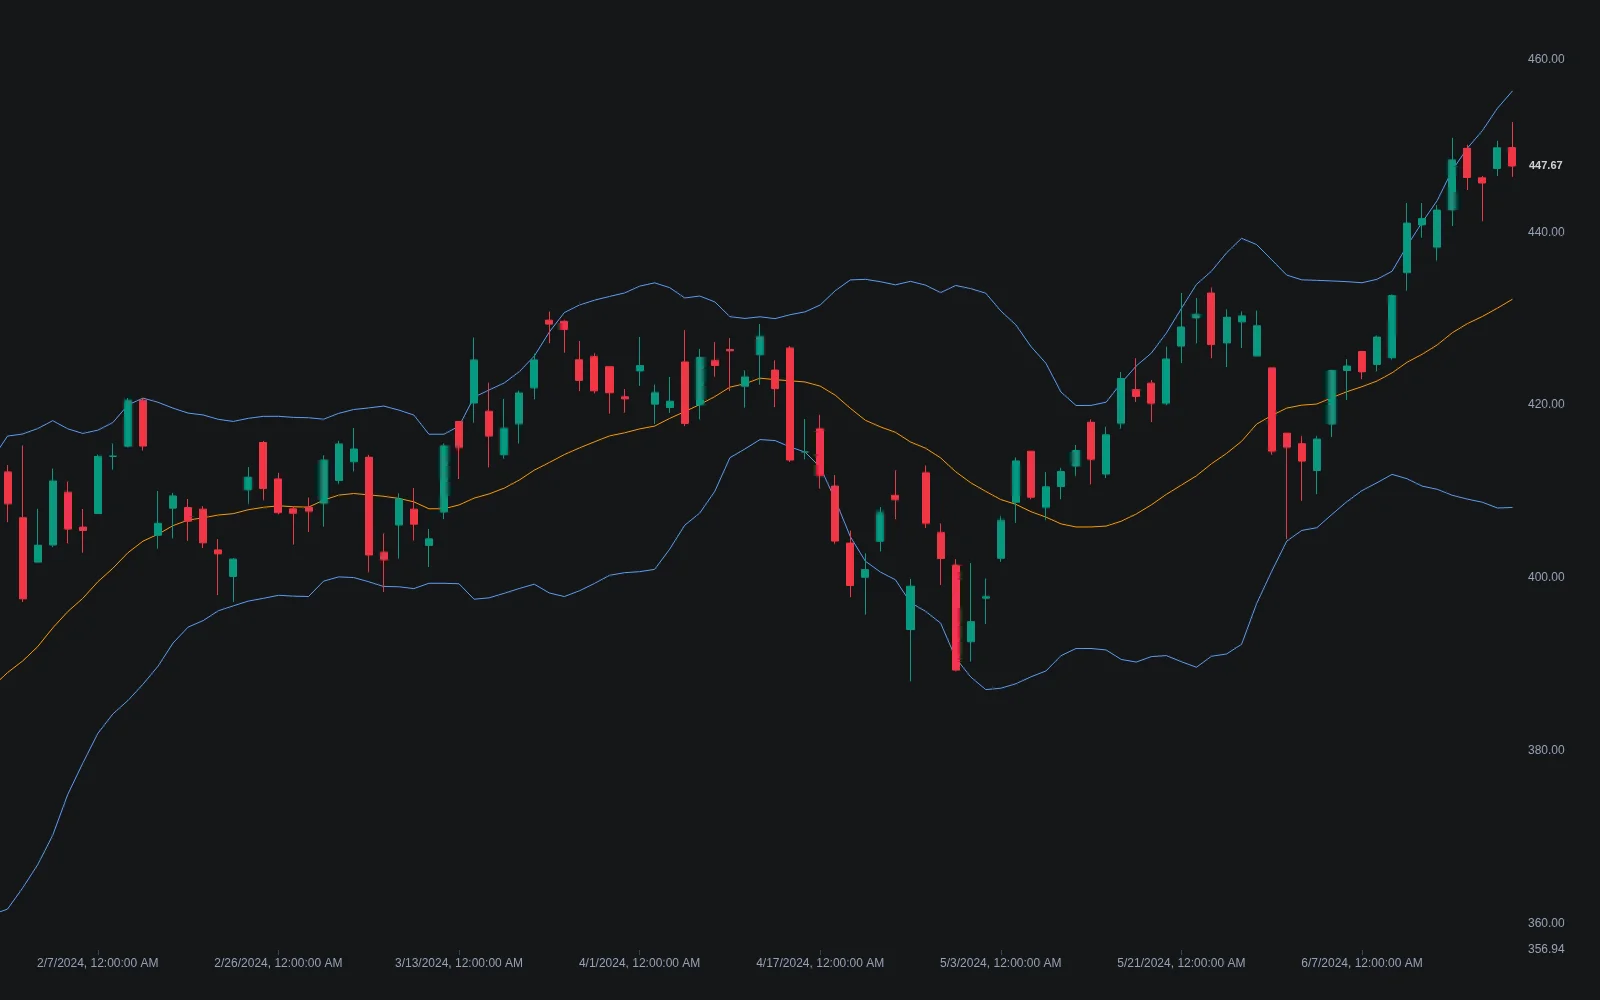
Native Bollinger Bands and the Breakout Oscillator
The Library's Bollinger Bands is the classic 20/2.0 construction with Length, Source and Multiplier inputs and a Display selector that shows the bands, %B (price's position within the bands, 1 at the upper band and 0 at the lower) or Bandwidth (band separation relative to the basis, the squeeze gauge). Two alerts fire when the close crosses above the upper band or below the lower band. Load it twice, at 20 and at 50, and the two-envelope geometry BBTrend measures is visible directly on the price chart: in an uptrend the two upper bands run close together while the lower bands separate.
The Bollinger Bands Breakout Oscillator quantifies a different aspect of the same envelope: whenever price trades outside a band it sums the excursion, normalises it over the lookback and plots bullish and bearish areas, so trend conviction is read from pressure at the bands rather than from the band spread. Its Length, Mult and Src inputs mirror the bands'. Both open on Quant Charts from their Library pages with published source.
| Tool | What it adds | Where it runs |
|---|---|---|
| Bollinger Bands | 20/2.0 envelope with %B and Bandwidth displays and band-cross alerts; two copies show the BBTrend geometry | Quant Charts, from the Library page |
| Bollinger Bands Breakout Oscillator | Normalised breakout pressure outside the bands as bullish and bearish areas | Quant Charts, from the Library page |
| Keltner Channels | ATR-based channel; bands inside the channel is one squeeze definition | Quant Charts, from the Library page |
| BBTrend (Quant script) | The two-envelope difference reproduced from the formula, with shading and alerts you specify | Quant Charts, written by Quant and inspectable in Code |
Reproducing and Testing BBTrend with Quant
Describe the indicator to Quant exactly as the formula section states it: 20- and 50-period Bollinger Bands at two standard deviations, the absolute lower-band gap minus the absolute upper-band gap, divided by the 20-period basis and multiplied by 100, plotted as a histogram with lighter bars when the magnitude grows and darker bars when it shrinks. Then write the rule: the regime condition, the shading flip, the structure entry, the stop, the target and the sizing. Inspect the Code to confirm the bands use the same source and that the shading compares magnitudes rather than signed values, and click Run. The Making Strategies with Quant guide shows the workflow, and the native backtest guide explains the Backtest Summary: net profit, trade count, win rate, maximum drawdown and profit factor, with commission and slippage set in the strategy properties.
Three comparisons are worth running. A plain positive-histogram filter against the filter plus the shading flip, to see whether the timing cue earns its extra selectivity. BBTrend as a regime filter against a 20/50 moving-average spread, to see what the band geometry adds over the averages alone. And the 20/50 defaults against a longer pair such as 50/100 on the same rule, to see how the lengths trade whipsaw for lag. Read trade count and maximum drawdown before headline return, and hold out data the lengths never saw. The Library's trend and market-structure tools run their own calculations on a Quant Chart; none of them reads BBTrend, and a Library signal beside a histogram turn is confluence to test rather than confirmation. The LuxAlgo platform does not place orders for you; it is a charting platform.
Strengths and Limitations
| Aspect | Strength | Limitation |
|---|---|---|
| Construction | Direction and strength in one histogram from a published, reproducible formula | Built from price alone; a smoothed cousin of a moving-average spread, not new information |
| Timing | Shading flips flag momentum changes earlier than the zero line | Crosses of the zero line lag turns and whipsaw in ranges |
| Volatility awareness | Band geometry adapts to volatility automatically | A single wide-range bar can jerk the 20-period bands and the histogram |
| Reading rules | Bollinger published specific reads: peaks, troughs, two-bar reversals, histogram trend lines | Those reads are discretionary; they need to be written as rules before they can be tested |
| Settings | Lengths adjustable to the holding period | Two lengths and a multiplier are three dials to curve-fit |
| Regimes | Excellent middle-of-trend filter | Late at the start and end of trends; near-zero readings in ranges are noise |
Conclusion
BBTrend turns a chart habit, plotting two Bollinger Band envelopes at once, into a single histogram that reads trend direction and strength from how the envelopes sit relative to each other. Its real value is the shading: the light-to-dark flips that mark momentum stalling are the earliest information the indicator carries, and Bollinger's own guidance builds the reading rules around them and around structure at the bands, not around the zero line. Used as a regime filter with structure supplying entries and stops, it is a disciplined way to stay on the right side of a trend. Used as a crossover signal generator, it whipsaws like everything else built from two averages.
Key Takeaways
- Two envelopes, one difference. Lower-band gap minus upper-band gap, normalised; positive in uptrends, negative in downtrends, near zero in ranges.
- Read the shading. Peaks, troughs and light-to-dark flips carry the timing; the zero line is a regime label.
- Confirm with different inputs. Structure, volume and %B add information; another price oscillator adds correlation.
- Size from the stop. Histogram height describes what has already happened.
- Native bands, reproducible histogram. Bollinger Bands and the Breakout Oscillator open on Quant Charts, and Quant can write BBTrend from its formula and test the rule.
FAQs
What is the BBTrend indicator?
BBTrend is a trend indicator from John Bollinger that compares 20-period and 50-period Bollinger Bands. It subtracts the absolute gap between the two upper bands from the absolute gap between the two lower bands and normalises the result, producing a histogram that is positive in uptrends, negative in downtrends and near zero in ranges. It is a TradingView built-in.
How is BBTrend calculated?
Compute both sets of bands at two standard deviations, take |lower20 − lower50| − |upper20 − upper50| and normalise; TradingView's implementation divides by the 20-period middle band and multiplies by 100. In an uptrend the upper bands converge and the lower bands diverge, so the value is positive; in a downtrend the reverse holds.
What do the light and dark bars on BBTrend mean?
A bar larger in magnitude than the previous one prints in the lighter shade and a bar smaller in magnitude prints in the darker shade. A switch from light to dark says the trend's momentum has stopped increasing, and Bollinger's guidance treats the resulting peaks and troughs as candidate trend starts and ends, or as consolidations when they occur inside a strong trend.
Is a BBTrend cross of the zero line a buy or sell signal?
Not on its own. The cross says the 20-period average has moved through the 50-period average with the band geometry agreeing, which is a regime change, but in a range the histogram flips around zero repeatedly. Use the sign as a filter for which side to trade and take entries from price structure such as a higher low or a break of structure.
Can I change the BBTrend settings?
Yes. The 20 and 50 lengths and the two-standard-deviation multiplier are the published defaults, and any pair of lengths can be used to match a holding period: shorter pairs react sooner and whipsaw more, longer pairs are steadier and later. Three parameters are three chances to curve-fit, so check that neighbouring settings give similar results.
Can I use BBTrend on Quant Charts?
The Library's Bollinger Bands and Bollinger Bands Breakout Oscillator open on Quant Charts directly, and loading the bands at 20 and 50 shows the geometry BBTrend measures. For the histogram itself, describe the formula to Quant, inspect the Code and click Run; Quant writes the script, and a regime-filtered rule can then be backtested with commission and slippage set in the properties.
References
LuxAlgo Resources
- Quant Charts
- LuxAlgo Quant
- Bollinger Bands Indicator
- Bollinger Bands Breakout Oscillator
- Keltner Channels Indicator
- Bollinger Bands
- Bollinger Squeeze
- BandWidth
- %B
- Breakout
- Two-Bar Reversal
- Trend Regime Label
- Making Strategies with Quant
- Native Backtest Guide
- Risking It Right
External Resources
Read next