Bear Flag Pattern: A Guide to Ride Downtrends Safely
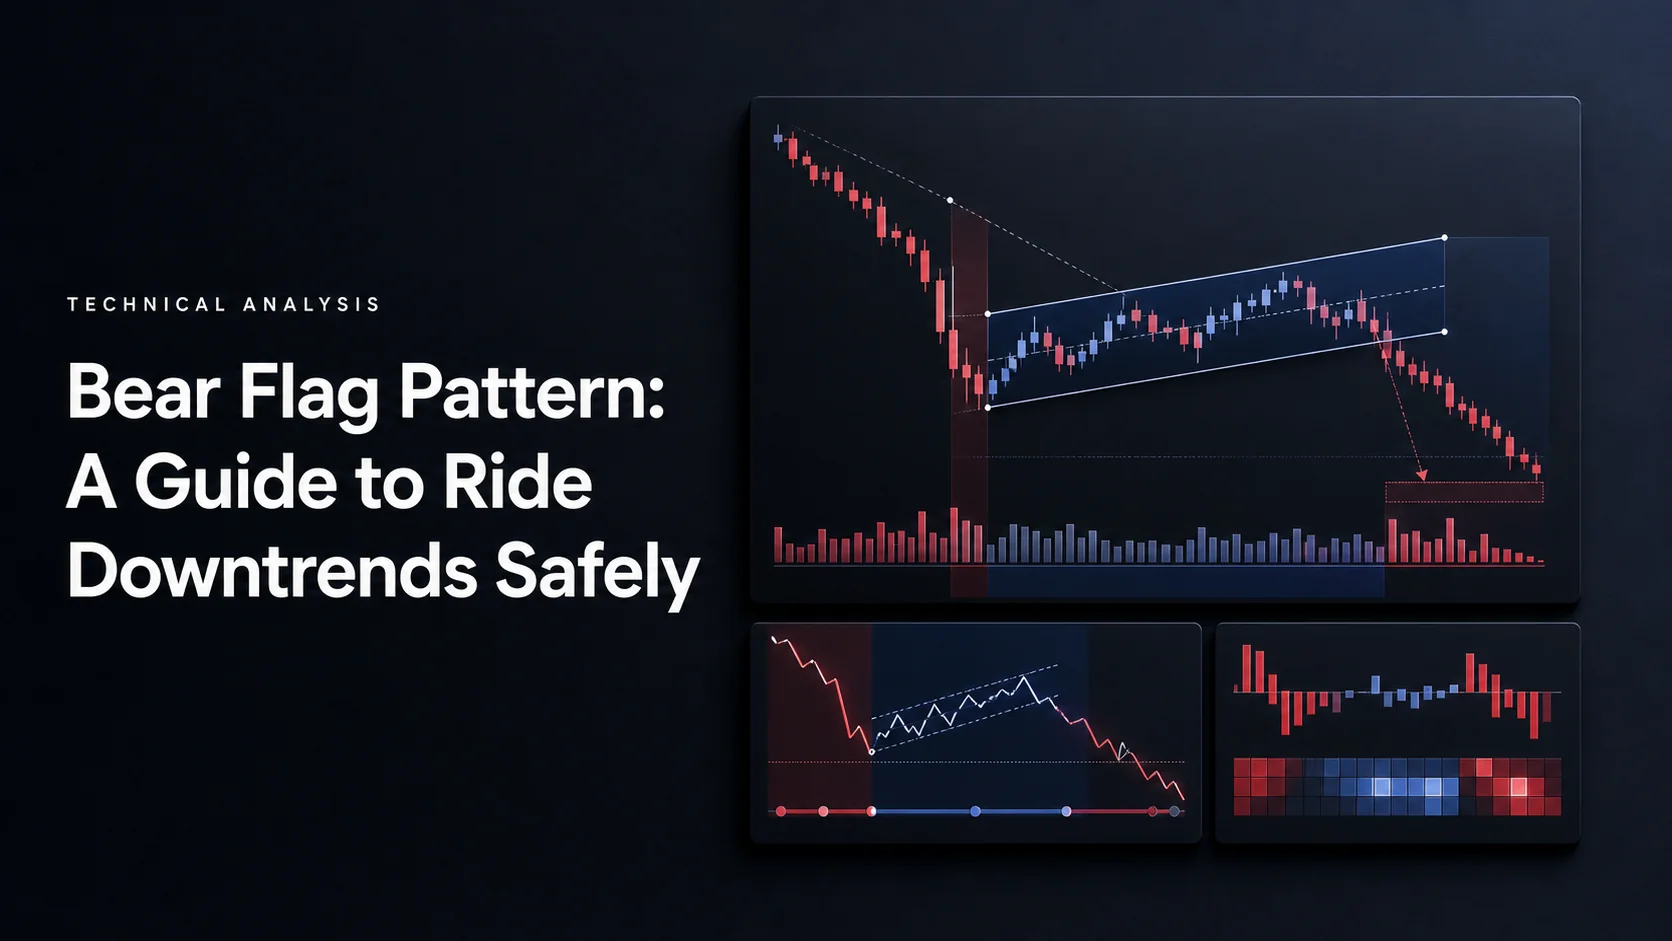
A bear flag is a potential continuation setup: a sharp decline followed by a smaller consolidation, then a possible break lower. It organizes the trend, entry and invalidation levels into a testable plan. It does not make short selling safe or guarantee another decline.
Use LuxAlgo’s charting and AI platform to move from recognition to evaluation. Quant Charts lets you inspect the setup, the Library provides a current Bull/bear Flag implementation, and Quant, our coding agent, can help turn your chosen conditions into a strategy for testing.
Recognizing a Bear Flag
Start with the Flagpole
The pole is the preceding directional decline. Identify its origin and low consistently before measuring the subsequent pause. A gradual drift without a distinct impulse is a weaker match to the classical formation.
The StockCharts flag and pennant guide describes a sharp move, a brief consolidation and a break in the original direction. The pole’s length can be projected from that break as a measured target. These are charting conventions, not a probability estimate or a promise that price will reach the projection.
A 10–20% fall is not a universal requirement. A percentage move that is substantial for a major currency pair may be ordinary in another market. Normalize the impulse to the instrument’s volatility or define a percentage threshold for the particular dataset you are studying.
Identify the Flag
The classical bear flag resembles a small, roughly parallel channel angled against the prior decline. A flatter pause may be included in a particular method, but record that choice. A converging pause is a pennant or another structure rather than the same parallel-channel definition.
| Feature | What to measure | What to avoid |
|---|---|---|
| Pole | Defined origin, low and duration | Selecting endpoints after seeing the result |
| Flag boundaries | Approximately parallel upper and lower edges | Calling every pause a flag |
| Retracement | Flag high relative to pole low and height | Switching between 38% and 50% limits within one test |
| Duration | Number of bars on the specified interval | Treating three to ten sessions as universal |
| Slope | Change in price per bar, with a consistent scale | Using screen angles as fixed trading rules |
A quoted 30-degree angle changes when you resize the chart or alter its scale. Price change per bar, optionally expressed relative to volatility or pole height, is more reproducible. Likewise, a 50-period moving-average condition is an optional trend filter; it is not part of every bear-flag definition.
Define the Breakdown
Separate a temporary move beneath the lower boundary from a completed candle close below it. If your setup needs an additional follow-through candle, specify that before testing. The additional wait may filter some failed breaks while also worsening the entry price or missing a fast move.
A flag can fail before a valid short entry appears. A close above the far boundary, excessive retracement or a timeout may invalidate it under your rules. Keep those events in the study rather than redrawing the channel until the chart appears successful.
Volume, Trend and Failure Checks
Use Volume as a Defined Filter
The traditional sequence is active selling during the pole, quieter activity during the pause and renewed activity at the break. Treat that as supporting evidence. A volume surge cannot certify continuation, and a breakout without a surge is not automatically false.
If you require volume 50% above average, define the lookback, whether the current candle is excluded from the average, and whether only completed bars count. That threshold is a test parameter, not a universal market rule.
Volume over time is different from volume at price. A tool such as Volume Profile Maps can help identify where activity accumulated, but it does not directly establish that volume declined across the flag’s candles. Compare like-for-like feeds: forex tick volume, one crypto exchange’s volume and consolidated stock volume measure different things.
Check the Broader Trend
Review the flag in its wider context. A short setup into nearby support may offer less room than the projected pole length suggests. A higher-timeframe downtrend, momentum condition or moving average can be included, but every additional requirement changes the sample and needs testing.
RSI, MACD and Bollinger Bands answer different questions. RSI measures relative momentum, MACD compares moving-average behavior, and Bollinger Bands describe price relative to a moving average and dispersion bands. A squeeze does not determine the breakout direction, and an oversold reading can persist during a downtrend.
Recognize Invalidation
- A close through the upper flag boundary can invalidate the bearish structure.
- A retracement beyond your preset limit disqualifies that particular method, even if another method permits it.
- A pause that exceeds the allowed duration has expired under the chosen rules.
- A breakdown followed by a return inside the channel may trigger a separate failed-break exit.
- A gap through a stop can create a larger loss than the initial cash-risk calculation.
Distinguish a pattern label, an entry signal and a completed trade. A chart that later falls may still contain an invalidated flag or a stopped-out short.
Entries, Stops and Position Size
Compare Entry Models
| Entry model | Rule to specify | Main trade-off |
|---|---|---|
| Breakdown close | Enter after a completed close below the lower edge | A large trigger candle may leave poor remaining reward |
| Retest entry | Enter after a defined recovery and rejection near former support | The retest may never occur or may invalidate the setup |
| Follow-through entry | Require an additional completed candle to hold below the break | Later entry changes both risk and target distance |
A measured target subtracts the pole’s height from the selected breakdown level. Do not subtract it from whichever later entry gives the most appealing result. Prior support or a fixed multiple of initial risk provides an alternative exit model; compare those models rather than treating them as interchangeable.
Choose an Invalidation Level
A stop above the entire flag tests whether the overall structure fails. A stop above a retest high tests a narrower entry hypothesis. Neither has a universally correct 1–2% buffer. Set the buffer using the instrument’s tick size, spread and volatility, then calculate the resulting position size.
For a TSLA case study, record the actual date, adjusted chart, trigger, stop and fill assumptions. A general reference to “early 2023” cannot establish that above-flag stops kept losses small. Use a clearly specified hypothetical example until the historical data is available.
Worked Example: Projection Is Not Profit
Suppose a hypothetical stock falls from $110 to $100, creating a $10 pole. Its flag reaches $104 before a completed breakdown near $101. The $4 retracement is 40% of the pole; subtracting the $10 pole from $101 projects a $91 target.
If the short entry is $101 and the initial stop is $105, planned risk is $4 per share and potential reward to $91 is $10, or 2.5R before costs. For a $20,000 account using an illustrative 0.5% cash-risk budget, $100 divided by $4 permits 25 shares. The position’s notional value is $2,525.
A cover at $105 loses $100 before costs. Covering after a gap to $108 loses $175. If entry occurs later at $99 with the same stop and target, risk becomes $6 and reward $8, about 1.33R. The original 2.5R calculation no longer applies.
The example risk percentage is not a recommendation for every account. A favorable reward-to-risk ratio can still lose money if failures, slippage, fees and average outcomes overwhelm the winners. For equity shorts, also account for borrow availability, borrowing costs, margin and the possibility of losses beyond the initial proceeds; the SEC short-sales overview explains the basic mechanics.
Evaluate Bear Flags with LuxAlgo
Use the Current Bull/bear Flag Indicator
The Bull/bear Flag Library indicator provides an explicit implementation and an Open on Quant Charts action. Its current documented defaults include a pole of at least 3 ATR, a 4–15-bar flag and a maximum flag depth of 50% of pole height. These are this implementation’s settings, not universal requirements.
It also checks the share of strong closes and bar-range contraction. Its documented volume filter defaults to off and is bypassed when volume data is unavailable. Do not claim that every label requires a volume surge.
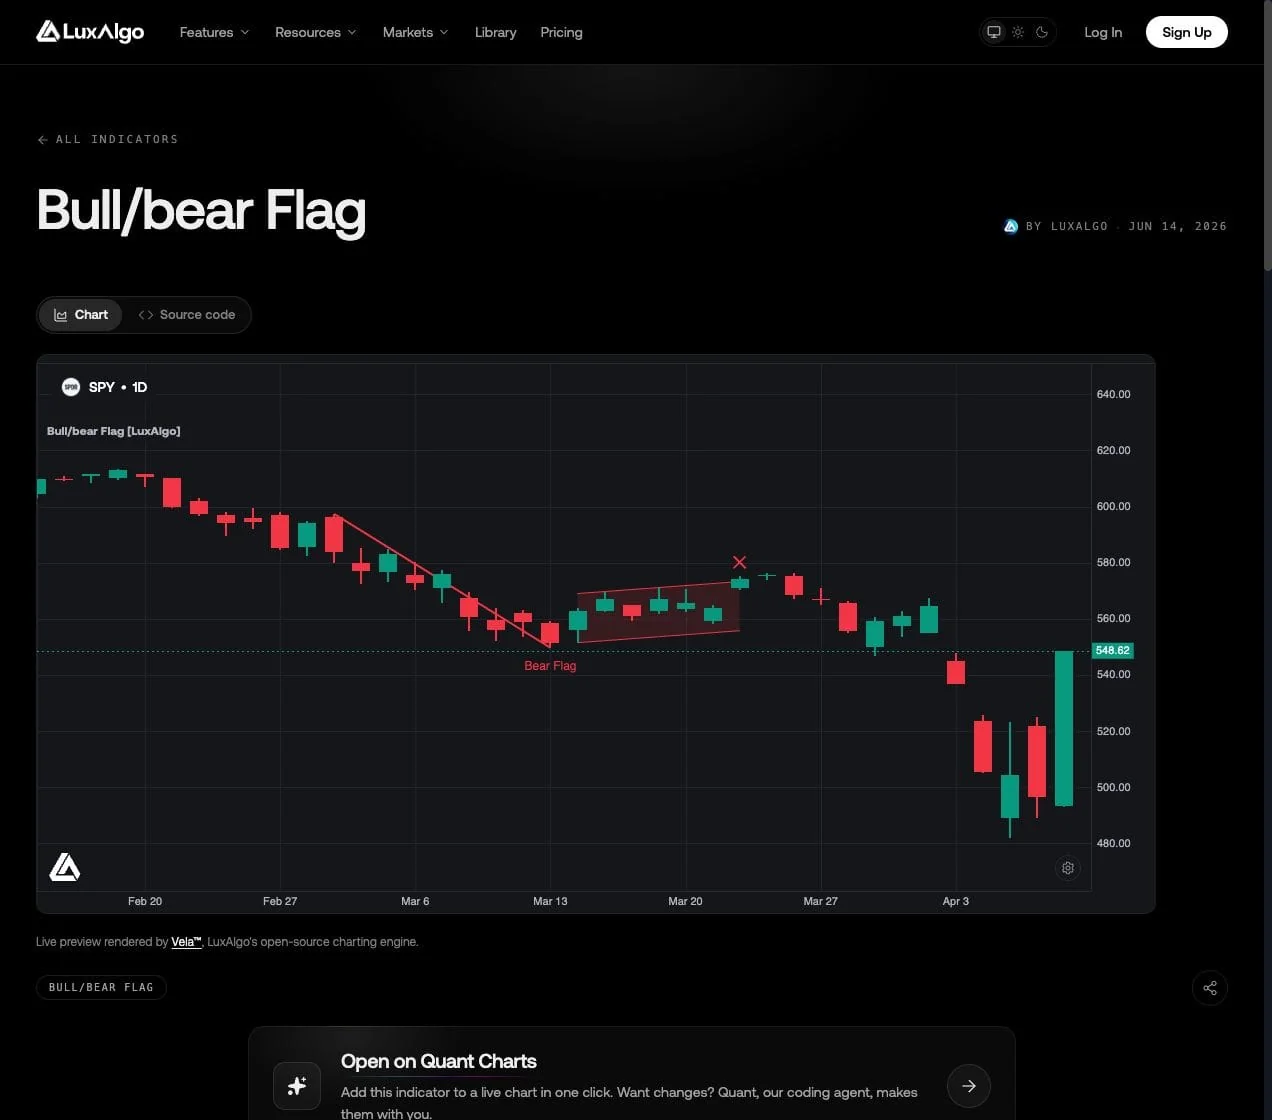
The product distinguishes a qualifying flag label from a breakout triangle, a target diamond and an invalidation cross. Review the event sequence before interpreting the picture. A detector is not a verified strategy track record.
Review the Setup on Quant Charts
Use Quant Charts to inspect the symbol, interval and surrounding price action, then add the relevant Library indicator. Keep the chosen timeframe and settings consistent when comparing examples.
Test the Rules with Quant
Ask Quant, our coding agent, to help implement your pole, flag, breakdown, stop and exit definitions. Include the trading session, costs, maximum holding period and any higher-timeframe filter. If you adapt a Library indicator, distinguish its event markers from executable strategy orders.
Follow Making Strategies with Quant: inspect the generated code and click Run yourself. Review fills and metrics using the native backtest guide. Ensure pivots and completed higher-timeframe values are available at the time the strategy uses them.
Compare the breakdown and retest models on the same sample, include failed setups and keep an untouched evaluation period. Report the symbol set, dates, number of trades, costs, drawdown and average wins/losses. There is no substantiated universal 60–70% continuation rate or 8% median move for the rules in this guide.
Bear Flag Video Example
Build a Repeatable Bear-Flag Process
Define the impulse and pause, wait for the trigger your method requires, and calculate risk from the actual entry. Use the LuxAlgo Library and Quant Charts to inspect examples, then use Quant to help test the rules. Keep invalidated flags, losing trades and missed retests in the analysis.
FAQs
How does volume help evaluate a bear flag?
Compare activity during the pole, pause and breakdown using a consistent feed and a defined lookback. Volume can support a filter, but expansion does not guarantee continuation.
What separates a bear flag from a pennant?
A classical flag uses approximately parallel boundaries, usually angled against the preceding decline. A pennant has converging boundaries. Define which structure your strategy accepts.
Does a bear flag need to retrace less than 50%?
That is a common filter and the current default maximum depth for LuxAlgo’s Bull/bear Flag indicator. It is not a universal law, and a 38% rule is a different strategy choice.
Can bear flags be used in forex and crypto?
The geometry can be studied in both markets, but volume feeds, contract sizes, funding, spreads and execution differ. Recalculate risk and test each market rather than transferring a stock result unchanged.
What are common bear-flag mistakes?
Examples include missing a distinct pole, redrawing failed channels, entering before the defined trigger, ignoring short-sale costs and assuming a measured target must be reached.
Does LuxAlgo guarantee a bear flag will work?
No. The Library detector identifies events under documented rules. Quant can help implement a test, but the code, fills, assumptions and results still need review.
References
LuxAlgo Resources
- Quant Charts
- Bull/bear Flag Indicator
- LuxAlgo Quant
- Making Strategies with Quant
- Native Backtest Guide
- LuxAlgo Pricing
External Resources
Read next