Best Indicators For Unusual Volume Screening
Start unusual-volume screening with a volume comparison, then use indicators to interpret the candidates. Relative volume asks whether activity is unusually high against a defined baseline. OBV, VWAP, Accumulation/Distribution, CMF, and the Library’s money-flow tools answer different questions about price and participation; none is a universal ranking of the best trades.
LuxAlgo’s native charts help you examine shortlisted symbols, while Quant can help build a custom indicator from explicit rules. Use a watchlist to organize candidates and review the chart context. Distinguish this workflow from a market-wide scanner.
First Define What Counts as Unusual Volume
A basic relative-volume ratio is observed volume / average volume over a specified comparison sample. For intraday screening, compare equivalent session times rather than a partial morning session with full trading days. Relative Volume at Time documents regular-bar and cumulative modes with matched historical time offsets. Its current bar remains incomplete until it closes.
For example, 2.4 million shares through a completed interval versus a comparable 1.0-million-share historical average gives 2.4 times relative volume, or 140% above that baseline. This is an illustrative candidate filter, not a proven entry threshold. Record the interval, session, lookback, and treatment of incomplete bars so the result can be reproduced.
Also check absolute activity and execution conditions. A very large ratio from a tiny denominator can still describe a thinly traded instrument. Historical share or contract volume does not tell you the spread or depth available at your intended order size. Verify whether your feed reports exchange volume, one crypto venue’s activity, or spot-forex tick activity; see LuxAlgo’s data coverage.
Quick Comparison of the Five Indicators
| Indicator | Useful question | Key limitation |
|---|---|---|
| OBV | Is close-to-close signed volume broadly aligning with price? | Whole-bar classification does not reveal actual trade aggressors |
| VWAP | Where is price relative to its volume-weighted anchored average? | A price benchmark does not directly measure unusual volume |
| Accumulation/Distribution Line | How does cumulative volume weighted by close location evolve? | Within-bar location can disagree with gap direction |
| Chaikin Money Flow | Is close-location-weighted volume positive or negative over a window? | Near zero does not mean low or normal activity |
| Library money-flow tools | Is money flow leaning positive or negative by the tool’s model? | Model interpretation is not measured institutional identity or order-book liquidity |
Use these as context after a volume filter. Their suitability depends on the instrument, timeframe, available data, and tested rules. There is no inherent requirement to reserve OBV for investing, CMF for swing trades, or every VWAP for one-day analysis.
1. On-Balance Volume (OBV)
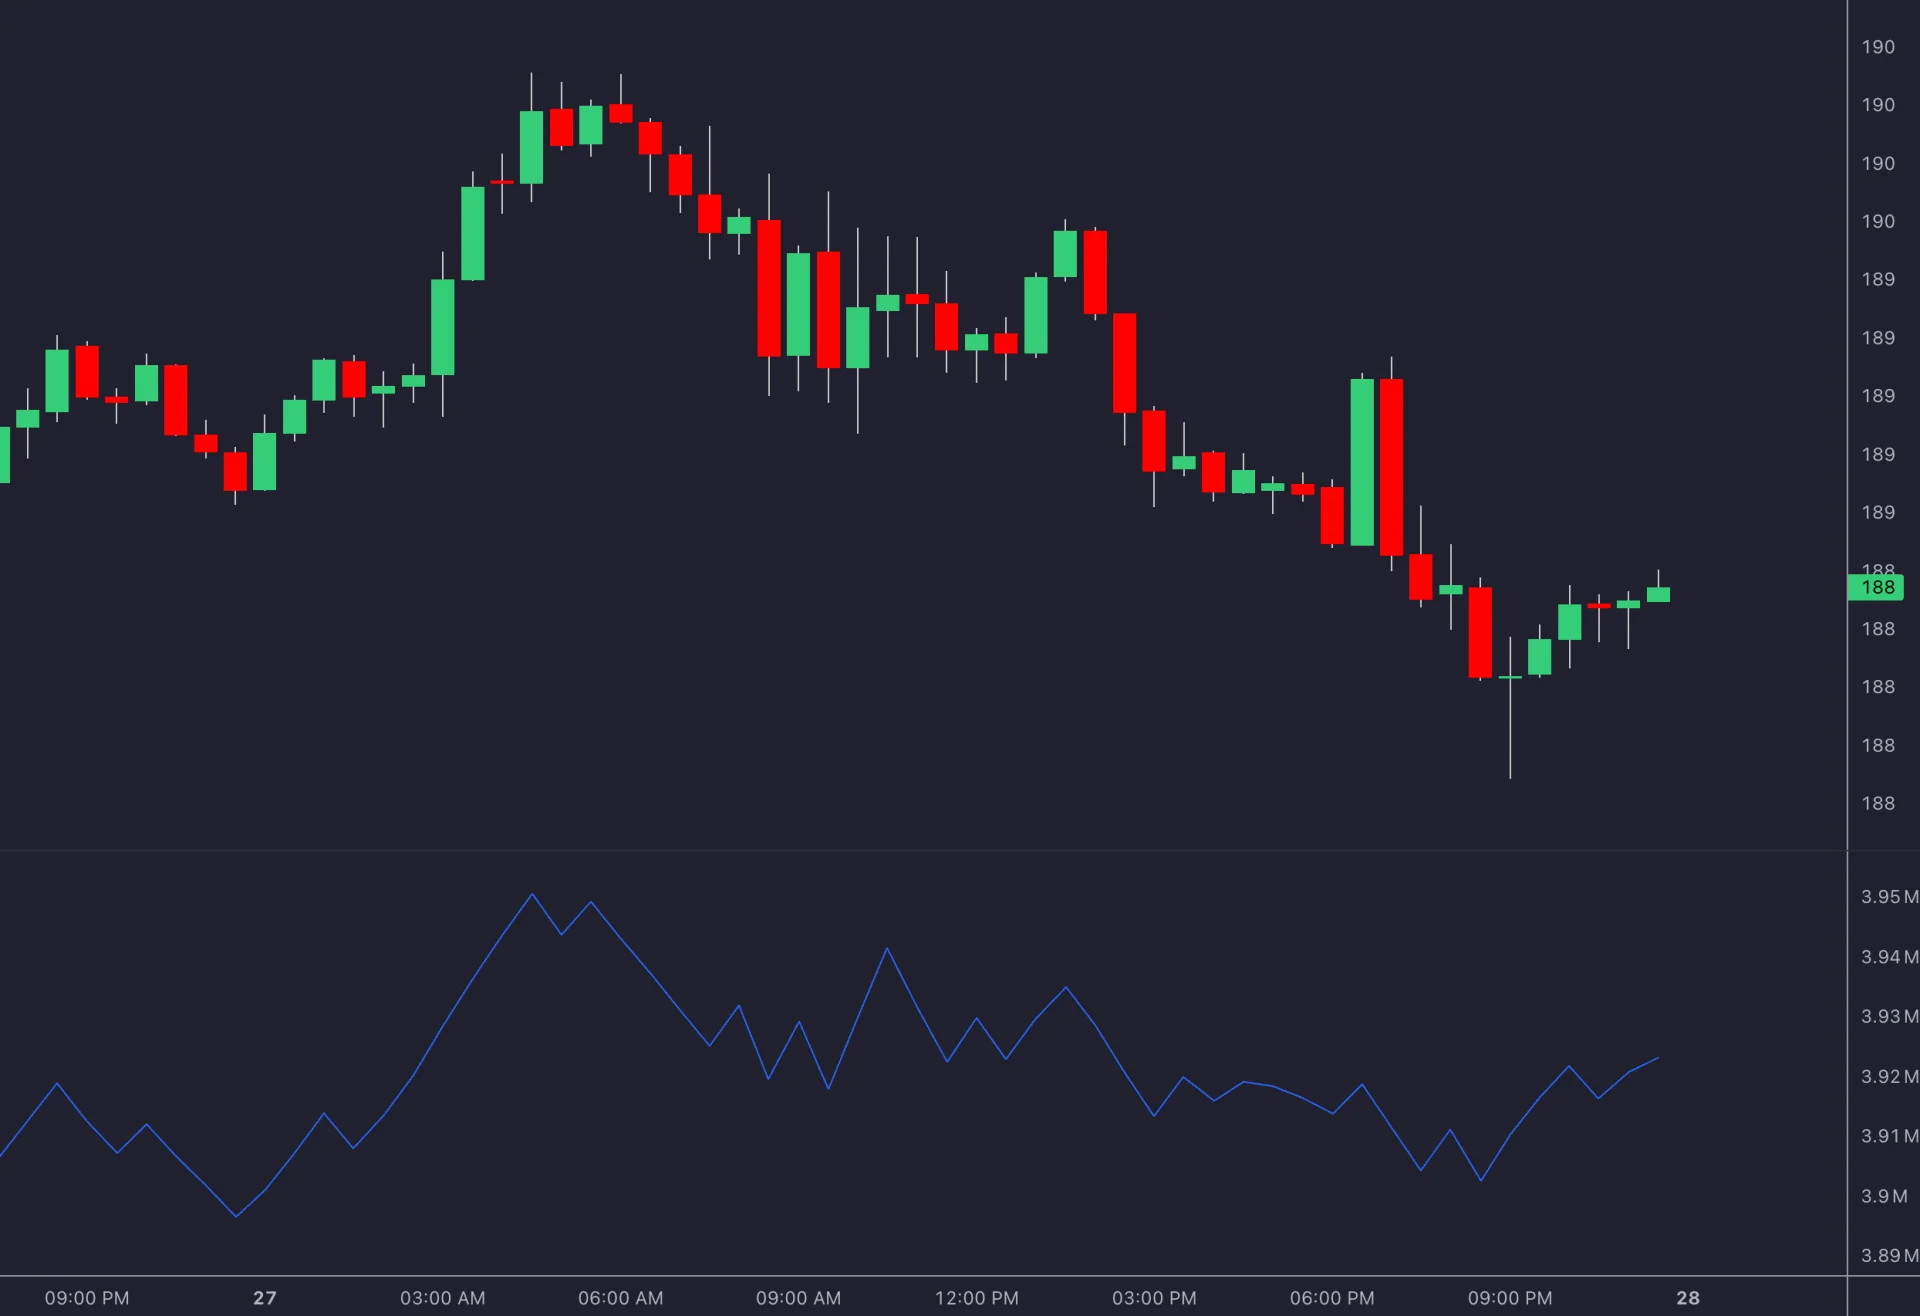
OBV adds the entire bar’s volume if the close exceeds the previous close and subtracts it if the close falls. An unchanged close leaves OBV unchanged. This works on the chart’s bars, not only daily observations.
If OBV starts at 10,000, an up-close bar with 2,000 volume takes it to 12,000; a subsequent down-close bar with 1,500 takes it to 10,500. This is signed volume under a close-to-close rule, not a count of buyers minus sellers.
After screening a symbol for unusual activity, inspect whether OBV supports the price structure. A higher price high with a lower OBV high is a bearish divergence candidate; a lower price low with a higher OBV low is a bullish candidate. Neither specifies when price must reverse. Large-volume bars can dominate the cumulative series, so inspect the underlying event and data quality.
Rising OBV while price stalls can be worth investigating, but it does not identify institutional accumulation. Compare the signal with a defined price trigger and risk limit rather than using OBV alone as an entry instruction.
2. Volume-Weighted Average Price (VWAP)
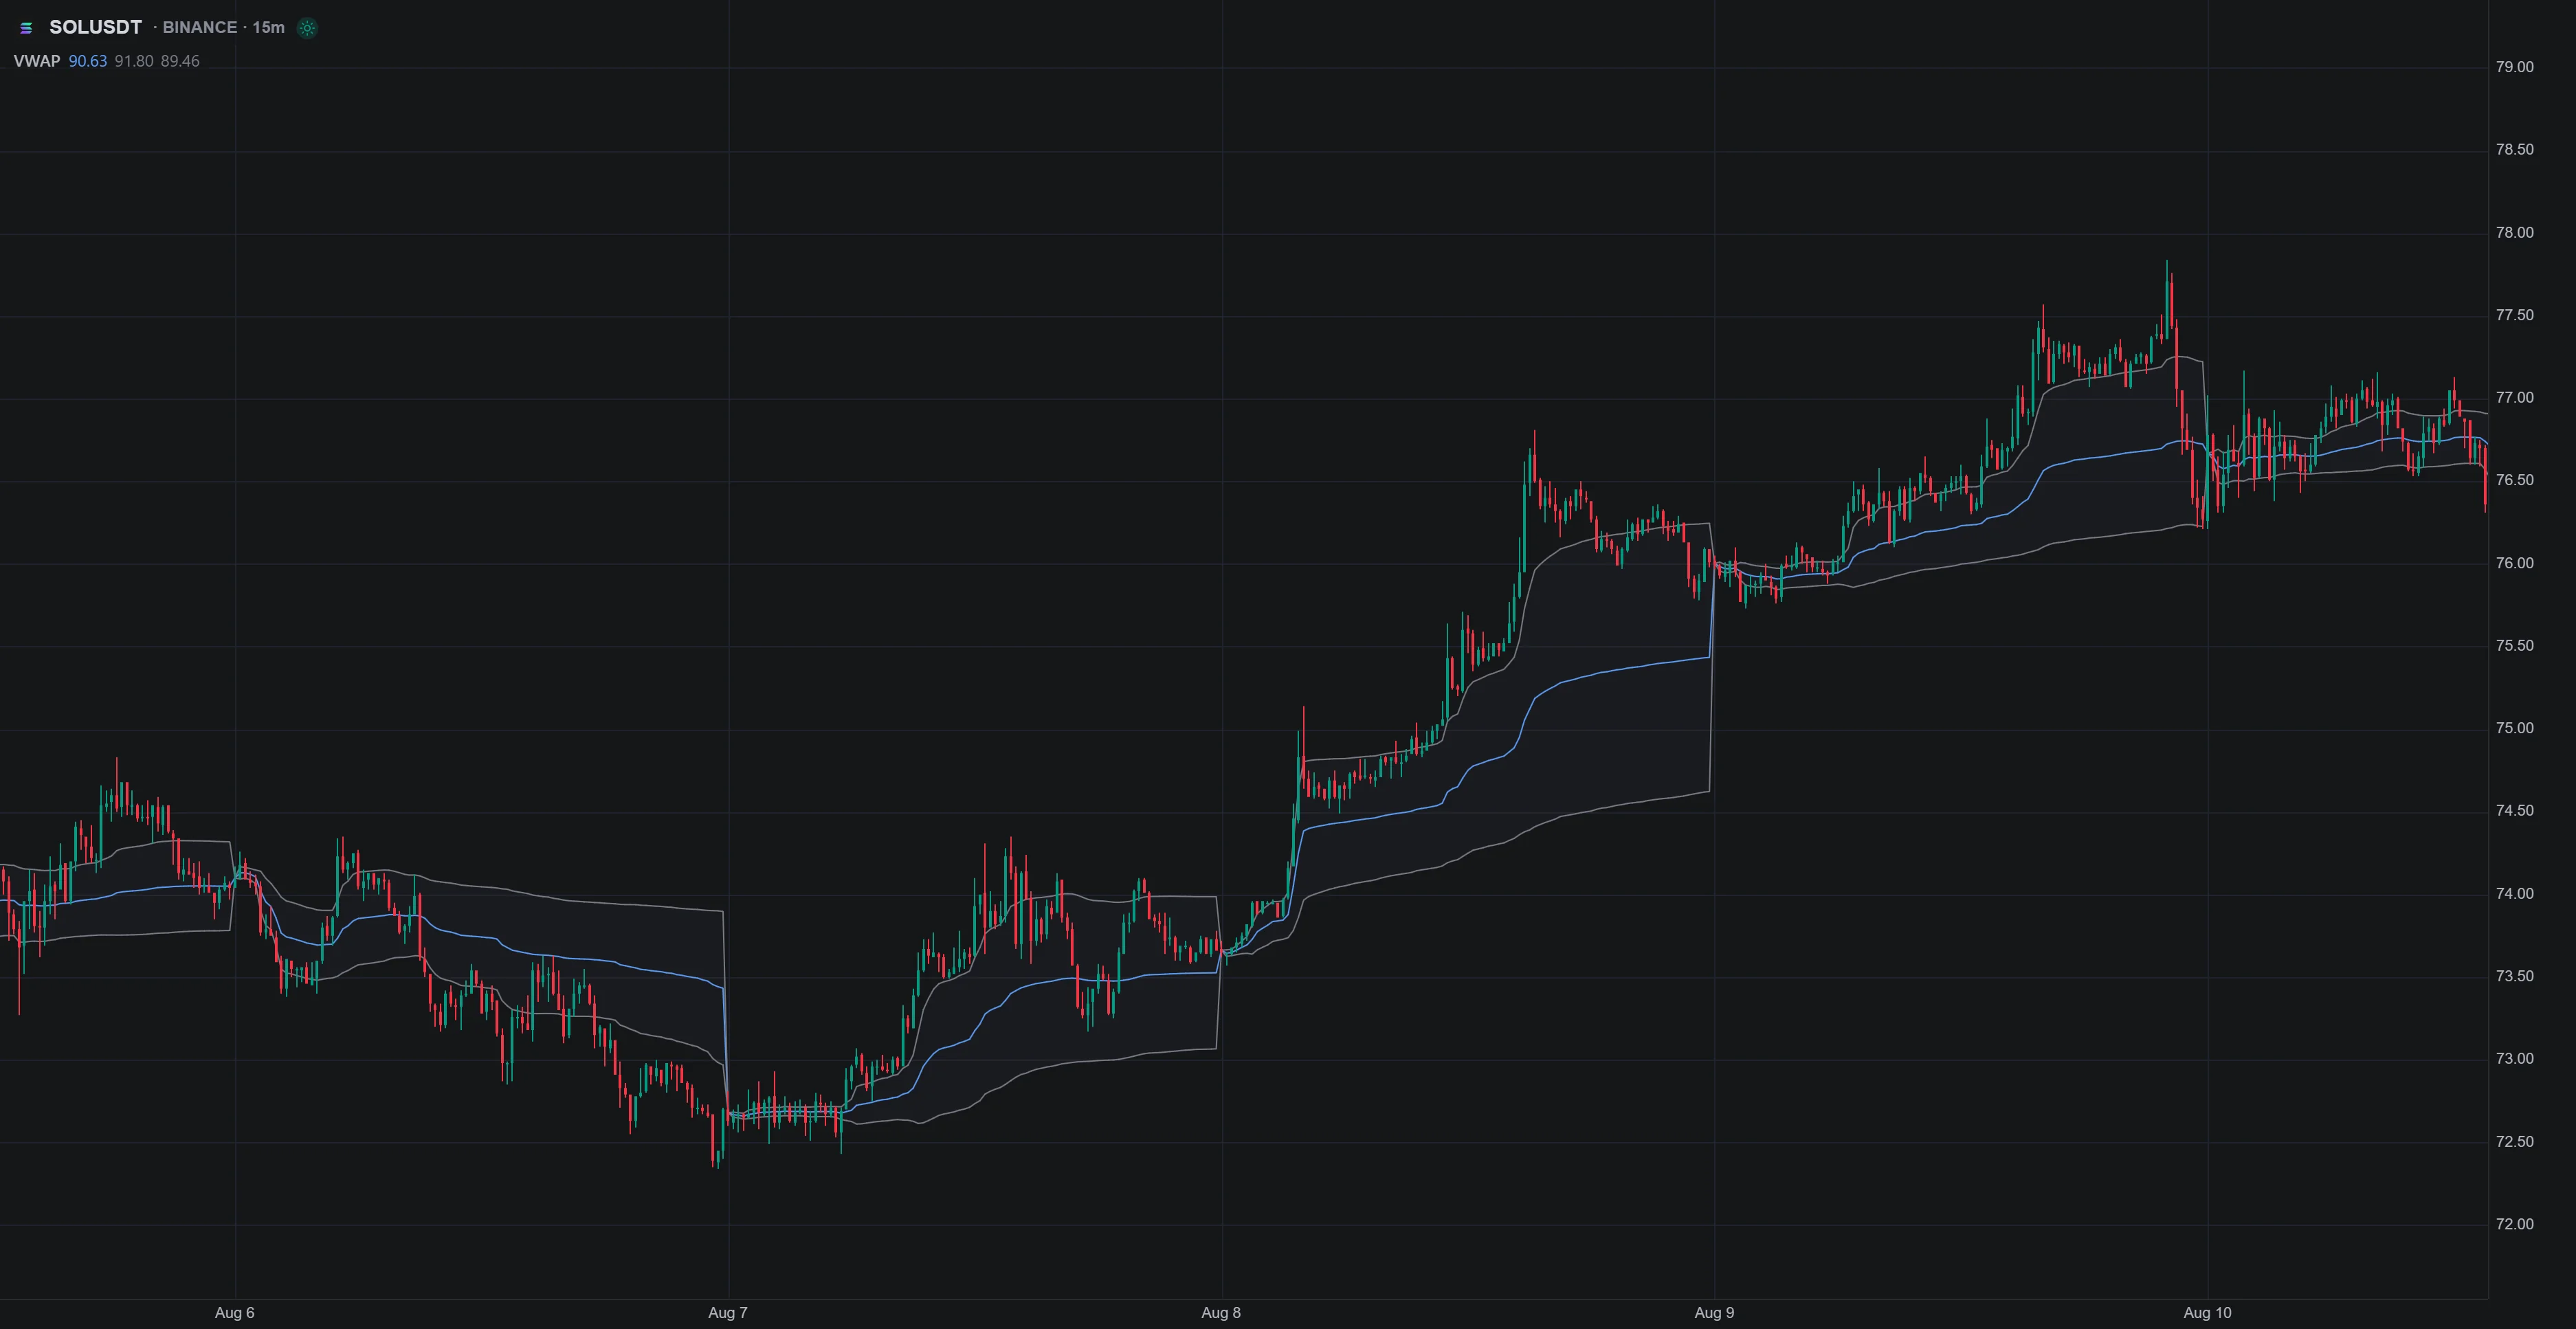
VWAP is the sum of price multiplied by volume divided by total volume over the chosen window. Using two hypothetical trades, 100 shares at $10 and 200 at $11 give a VWAP of $10.67. Candle-based versions use a selected bar price source, so they need not equal a calculation from every individual execution.
LuxAlgo’s native VWAP supports Day, Week, and Month UTC anchors and selectable price sources. It is not restricted to a single trading day, and an exchange’s regular-session boundary may differ from the selected UTC reset.
Price above VWAP is above that weighted reference; price below it is below the reference. Neither proves strong buying, institutional activity, or an imminent trend. VWAP is especially useful here as a location filter: after finding elevated activity, assess whether price is breaking a level, reclaiming the reference, or repeatedly crossing it in a range.
Keep the anchor consistent when comparing candidates. Changing only the chart timeframe does not necessarily change the accumulation window in the same way as changing the anchor.
3. Accumulation/Distribution Line
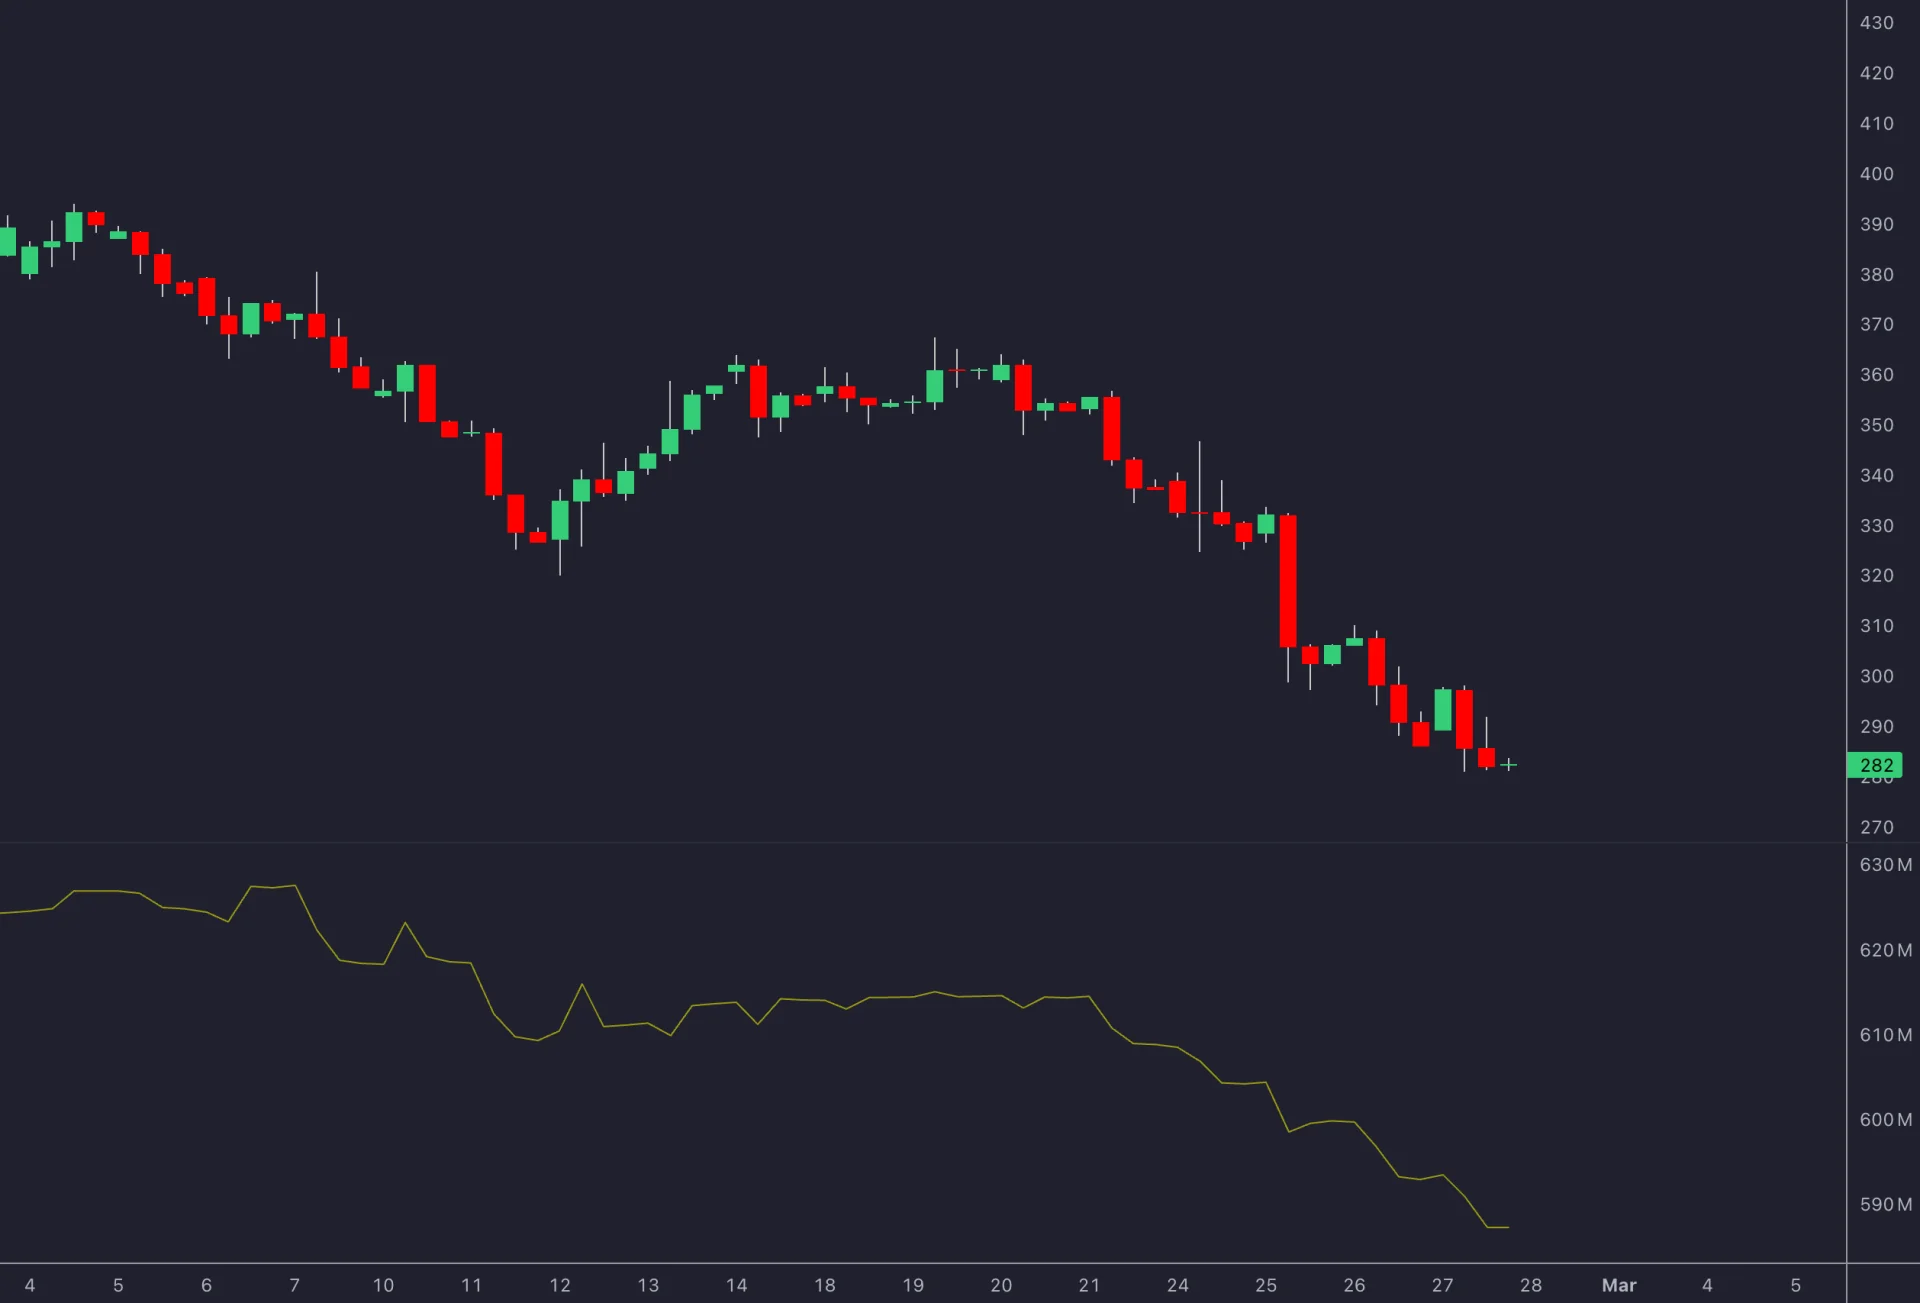
The Accumulation/Distribution Line (ADL) accumulates each bar’s Money Flow Volume. First calculate ((close − low) − (high − close)) / (high − low), then multiply by bar volume and add the result to the previous ADL. This is distinct from the market-breadth Advance/Decline Line.
A bar with high $110, low $100, close $108, and 1,000 volume has a multiplier of 0.6 and adds 600 to ADL. It does not show $600 entering the security. Define how the implementation handles bars whose high equals low.
Price making a higher high while ADL fails to do so can highlight a disagreement worth reviewing. However, ADL ignores the gap from the prior bar: a gap-down bar can still add positive Money Flow Volume if it closes near its own high. Rising ADL is therefore not proof that price rose or that identifiable large investors bought.
Use this study to investigate the structure behind a screened candidate. A divergence supplies context; the price trigger and trade invalidation still need separate rules.
4. Chaikin Money Flow (CMF)
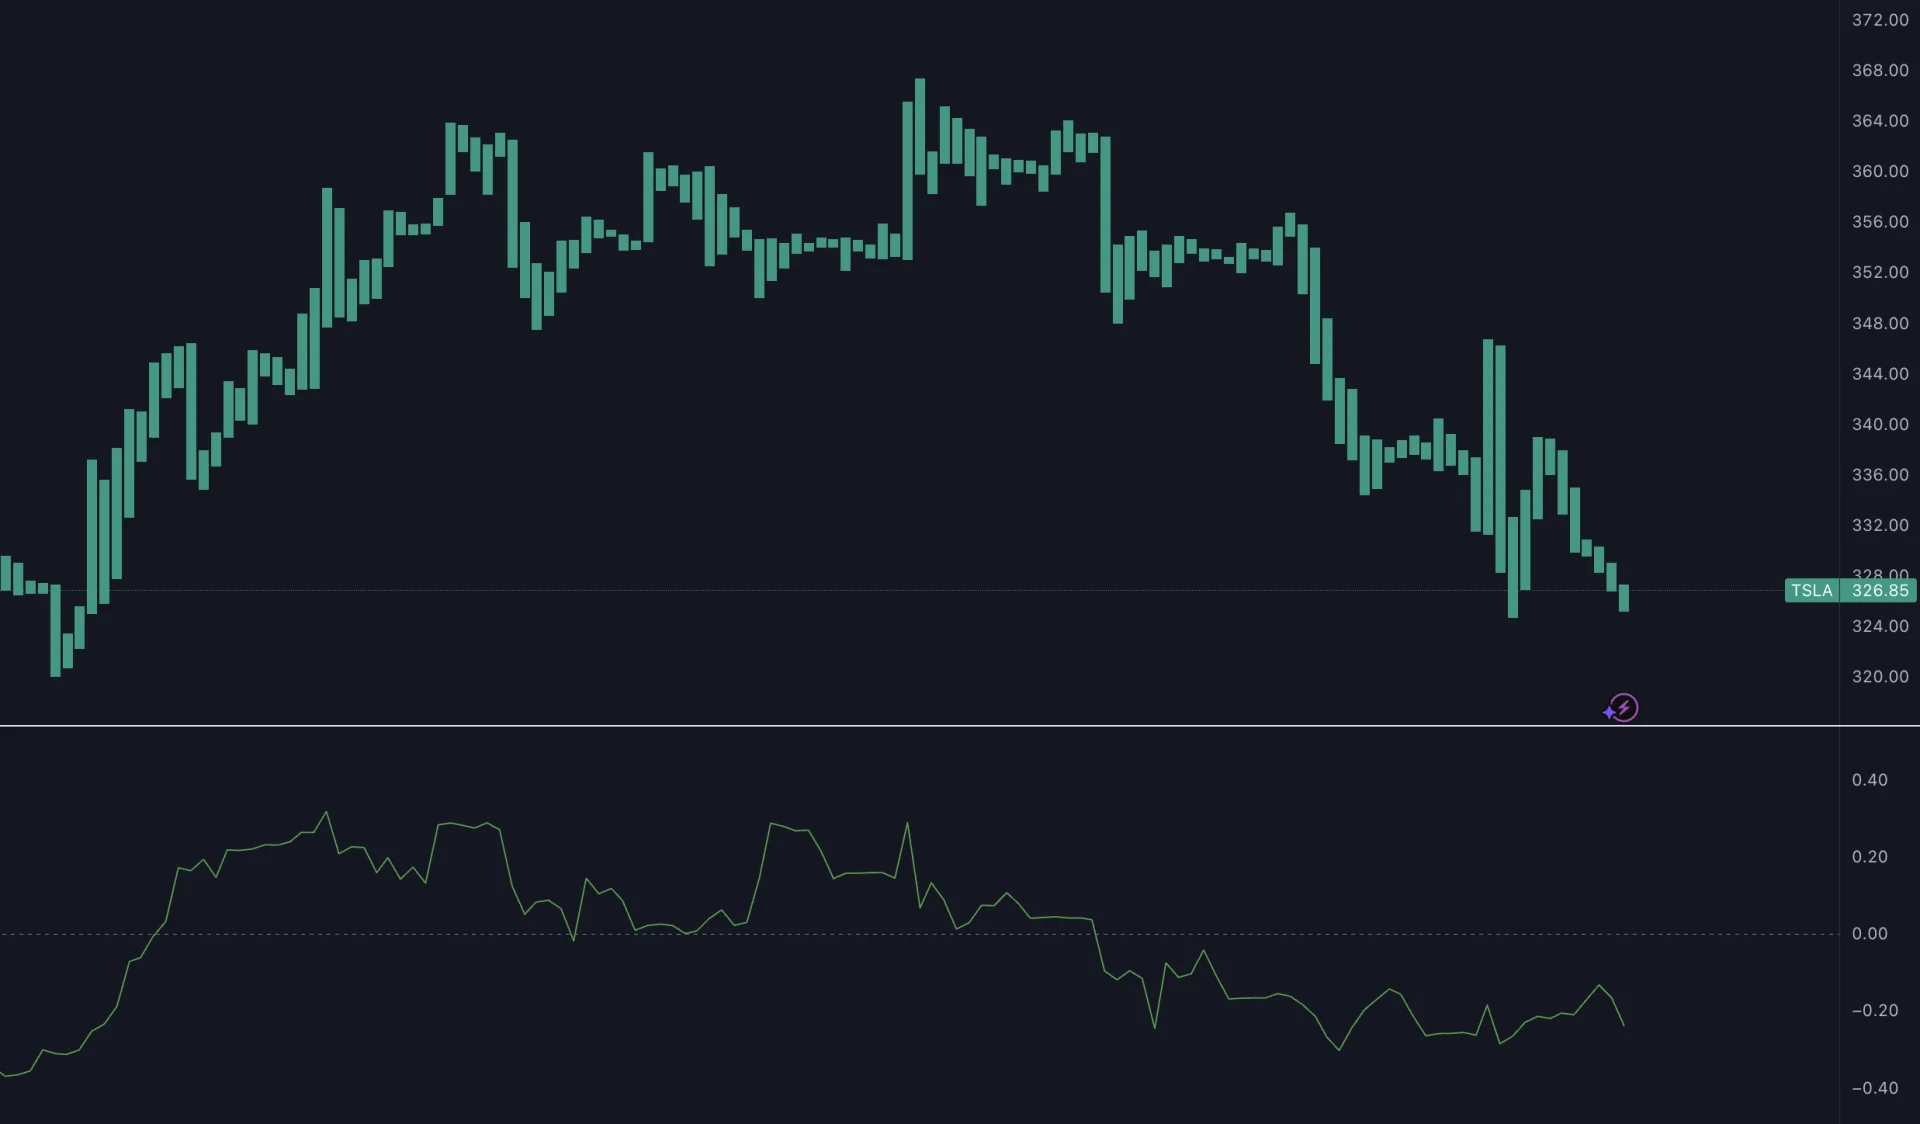
CMF uses the same Money Flow Volume component as ADL, but divides its sum over a lookback window by total volume over that window. Common settings are 20 or 21 bars; the selected chart determines what a bar represents.
If the window’s weighted-volume sum is 250,000 and total volume is 1,000,000, CMF is 0.25. Positive values reflect an aggregate tilt toward upper-range closes; negative values reflect lower-range closes. Near zero can result from offsetting contributions even during very heavy trading.
Consequently, ±0.25 are not universal “strong signal” boundaries, and −0.05 to 0.05 does not establish normal volume. Select and test thresholds for a defined purpose. Like ADL, CMF’s within-bar calculation does not capture the direction of gaps. Values can also change when older observations leave the rolling window.
A falling CMF alongside new price highs can prompt a closer look at weakening alignment. It does not demonstrate that a reversal is imminent, and adding ADL may provide partly redundant evidence because both share a calculation component.
5. Library Money-Flow Tools
Money-flow tools from the Library, such as the Money Flow Index and Money Flow Profile, open on a Quant Chart in one click. They interpret volume against price location; a reading is not direct evidence of resting liquidity, the identity of late participants, or a guaranteed reversal. Use them beside a separately defined unusual-volume filter, not as a scan of every symbol.
Build a Repeatable Screening and Review Workflow
- Choose a universe and feed. Keep comparisons within compatible units, sessions, and data coverage. Separate a market-wide screener’s universe from the symbols you manually follow.
- Apply the activity filter. Define relative volume, minimum absolute activity, and whether the signal waits for bar close. Check spread and execution conditions separately.
- Review price context. Locate support, resistance, and the selected VWAP. Add one useful directional study, such as OBV or CMF, rather than requiring all five to agree.
- Check the event. Earnings, news, session transitions, or bad data can explain a spike. A candidate is a prompt for investigation, not a trade.
- Write the entry and risk rules. Specify invalidation, position size, costs, cancellation, and exit behavior before acting.
In LuxAlgo’s watchlist, open Panels → Watchlist and use Add symbol. Clicking a row loads it on the active chart. The Volume (24h) column can be sorted, but an absolute 24-hour volume ranking is different from a matched-time relative-volume ranking. A saved watchlist also does not establish market-wide automated screening.
For a custom rule, describe the formula and timing to Quant. A simple completed-bar volume ratio might compare the last closed bar with the mean of a defined number of preceding completed bars, excluding the signal bar. Label that correctly: it is not a matched-time intraday model unless you implement the session alignment. Review the code, missing-data behavior, and plotted results.
To test trade outcomes, add explicit entry and exit rules in a Quant strategy. Include commission and slippage, inspect individual trades, and evaluate periods outside the sample used to choose settings. Do not use a completed bar’s final volume to justify an earlier fill within that bar.
Evaluate Results Without Cherry-Picking
A few attractive historical charts cannot establish which indicator performs best. Define the candidate set and rule before measuring results, include failed signals, and compare versions with and without the added indicator. Check signal frequency, net results, drawdown, and sensitivity to costs rather than selecting an indicator because it appears to explain one rally or decline.
For an illustrative trade, an entry at $40, a stop at $39.50, and estimated costs and slippage of $0.10 per share imply $0.60 planned risk per share. A $120 risk budget allows 200 shares before other capital constraints; worse execution can exceed that estimate. A high relative-volume score does not increase the budget automatically.
FAQs
What is the most accurate volume indicator?
There is no universally most accurate volume indicator. Relative volume directly compares activity with a baseline, while OBV, VWAP, ADL, CMF, and Library money-flow tools provide different context. Evaluate a defined rule on the relevant market and timeframe after costs, rather than ranking indicators by reputation.
References
Read next