Bid vs. Ask: How Price Dynamics Impact Your Trading Success
The bid is what buyers are quoting; the ask is what sellers are quoting. The difference—the bid-ask spread—affects the cost of entering and exiting a position. But a displayed quote applies to a particular market, time and available size. It is not a guarantee that your entire order will fill at that price.
Start with the quote source, spread and depth before interpreting an indicator or choosing an order. A tight spread can help reduce execution costs, while thin depth, changing quotes and volatility can make the eventual fill different from the price you saw.
Bid, Ask, Spread and Last Price
Investor.gov defines stock bid and ask prices as the highest price a buyer will pay for a specified quantity and the lowest price a seller will accept. In a normal uncrossed quote, the ask is above the bid. Always identify whether your display represents one venue, a consolidated feed or your broker’s own quotation.
| Term | Meaning | Example |
|---|---|---|
| Best bid | Highest displayed buying quote in the specified market | 50.00 |
| Best ask or offer | Lowest displayed selling quote in the specified market | 50.05 |
| Quoted spread | Ask minus bid | 0.05 per share |
| Midpoint | Average of the bid and ask | 50.025 |
| Last traded price | Price of the most recently reported transaction | May differ from both current quotes |
A marketable buy generally takes available offers, and a marketable sell generally takes available bids. Routing, price improvement, changing quotes and available size can affect the actual execution. The last price on a chart is not necessarily the price at which a new order can trade.
For a percentage spread, state the denominator. Using the midpoint above, 0.05 ÷ 50.025 × 100 is approximately 0.10%. A spread measured in dollars, ticks, pips or basis points needs the corresponding instrument convention; the same absolute difference can have very different significance at different prices.
What the Spread Costs: A Worked Example
Suppose the bid stays at $50.00 and the ask stays at $50.05, with enough available quantity for every fill. Buying 1,000 shares at the ask and immediately selling them at the bid produces a $50 loss before commissions or other fees: 1,000 × $0.05. This is an unchanged-quote round trip, not an extra $50 exchange fee on every individual order.
Measured against the unchanged midpoint, each side of that example gives up half the spread: $25 on the buy and $25 on the sell. Twenty such round trips per month would total $1,000 per month, or $12,000 over twelve months, under the same assumptions. Actual costs differ as quotes, sizes and execution methods change.
Spread cost is only one component. Commissions, venue fees or rebates, financing where applicable, slippage and market impact can also matter. If a backtest already models buys at asks and sells at bids, adding the full spread again may double-count the cost.
A Tight Spread Is Not the Same as Deep Liquidity
The best price may be available for only a small quantity. Imagine an unchanged displayed offer of 100 shares at $50.05 and another 900 at $50.10. If a 1,000-share buy fills exactly against those two levels, its average price is $50.095—above the initial best ask. This illustration assumes those orders remain available and ignores other venues and hidden liquidity.
Spread describes the gap between the best quotes; depth describes available interest at different levels. A narrow spread with little size can still produce a poor fill for a large order. Displayed orders can change or disappear, and not all trading interest is visible in the book.
Volatility, competition among liquidity providers, tick size, time of day and uncertainty can influence spreads. Strong buying demand does not mechanically narrow the spread: it can consume offers or coincide with wider quotes. Inspect the actual market rather than assigning a fixed spread to an entire asset class.
| Market condition | What to inspect | Practical implication |
|---|---|---|
| Active market with narrow quotes | Available size, quote freshness and venue coverage | Potentially lower spread cost, with no guarantee of a complete fill |
| Thin or fragmented market | Depth beyond the best quote and expected order size | A displayed price may be unrepresentative for the whole order |
| News or rapid price movement | Quote changes, spreads and order restrictions | Execution assumptions can deteriorate quickly |
| Extended hours or less-active sessions | Session-specific quotes and available liquidity | Do not assume regular-session execution conditions persist |
Large-cap stocks and actively traded currency pairs can have competitive quotes, but that does not make a universal spread percentage reliable. Small-cap stocks and fixed-income exchange-traded products also vary widely. Compare the actual instrument, trading session, order size and feed rather than relying on an unsupported category average.
DOM, Time and Sales, and Footprints Show Different Data
| Display | What it represents | What it does not establish |
|---|---|---|
| Depth of Market or order book | Displayed resting bids and offers at price levels within its feed coverage | That the displayed orders will remain or that all liquidity is visible |
| Time and sales | Reported executed transactions | The complete history of resting and canceled orders |
| Footprint | Executed volume summarized by price and side under the provider’s classification | A live book of orders waiting to trade |
| Volume profile | Volume distributed across price levels over a defined range | A guarantee that a high-volume level will hold as support or resistance |
A DOM can help you examine available interest, while executed-trade data helps show what actually traded. Both require context. A large displayed order is not proof of durable support, and an absorption hypothesis needs a defined relationship between executions and subsequent price behavior, rather than a single large number.
There is no universal five-column DOM layout, 24-hour history entitlement or fixed number of key levels. Those are product and data-feed choices. Likewise, access through TradingView, NinjaTrader, MetaTrader or thinkorswim depends on the specific platform feature, broker connection and data entitlement; they are not interchangeable integrations of one unnamed tool.
Depth of Market: Video
The retained Critical Trading video, published January 2, 2016, introduces DOM mechanics. Treat its interface and examples as historical education. It explains an order-book concept; it does not demonstrate the data architecture or current features of LuxAlgo’s native charts.
Use LuxAlgo for Executed-Volume and Chart Research
LuxAlgo’s native order-flow tools use pre-aggregated one-minute footprints containing volume at price and per-side trade counts, alongside ordinary candles. They are not a live order book or trade tape. This distinction matters when interpreting “bid” and “ask” inside a footprint: those cells describe executed activity, not current resting quote sizes.
The native Footprint chart and overlays offer bid-by-ask views and ladders, delta views and other display options. Use them to investigate where activity occurred and how the price responded. A footprint imbalance is not a quoted spread or a guaranteed directional forecast.
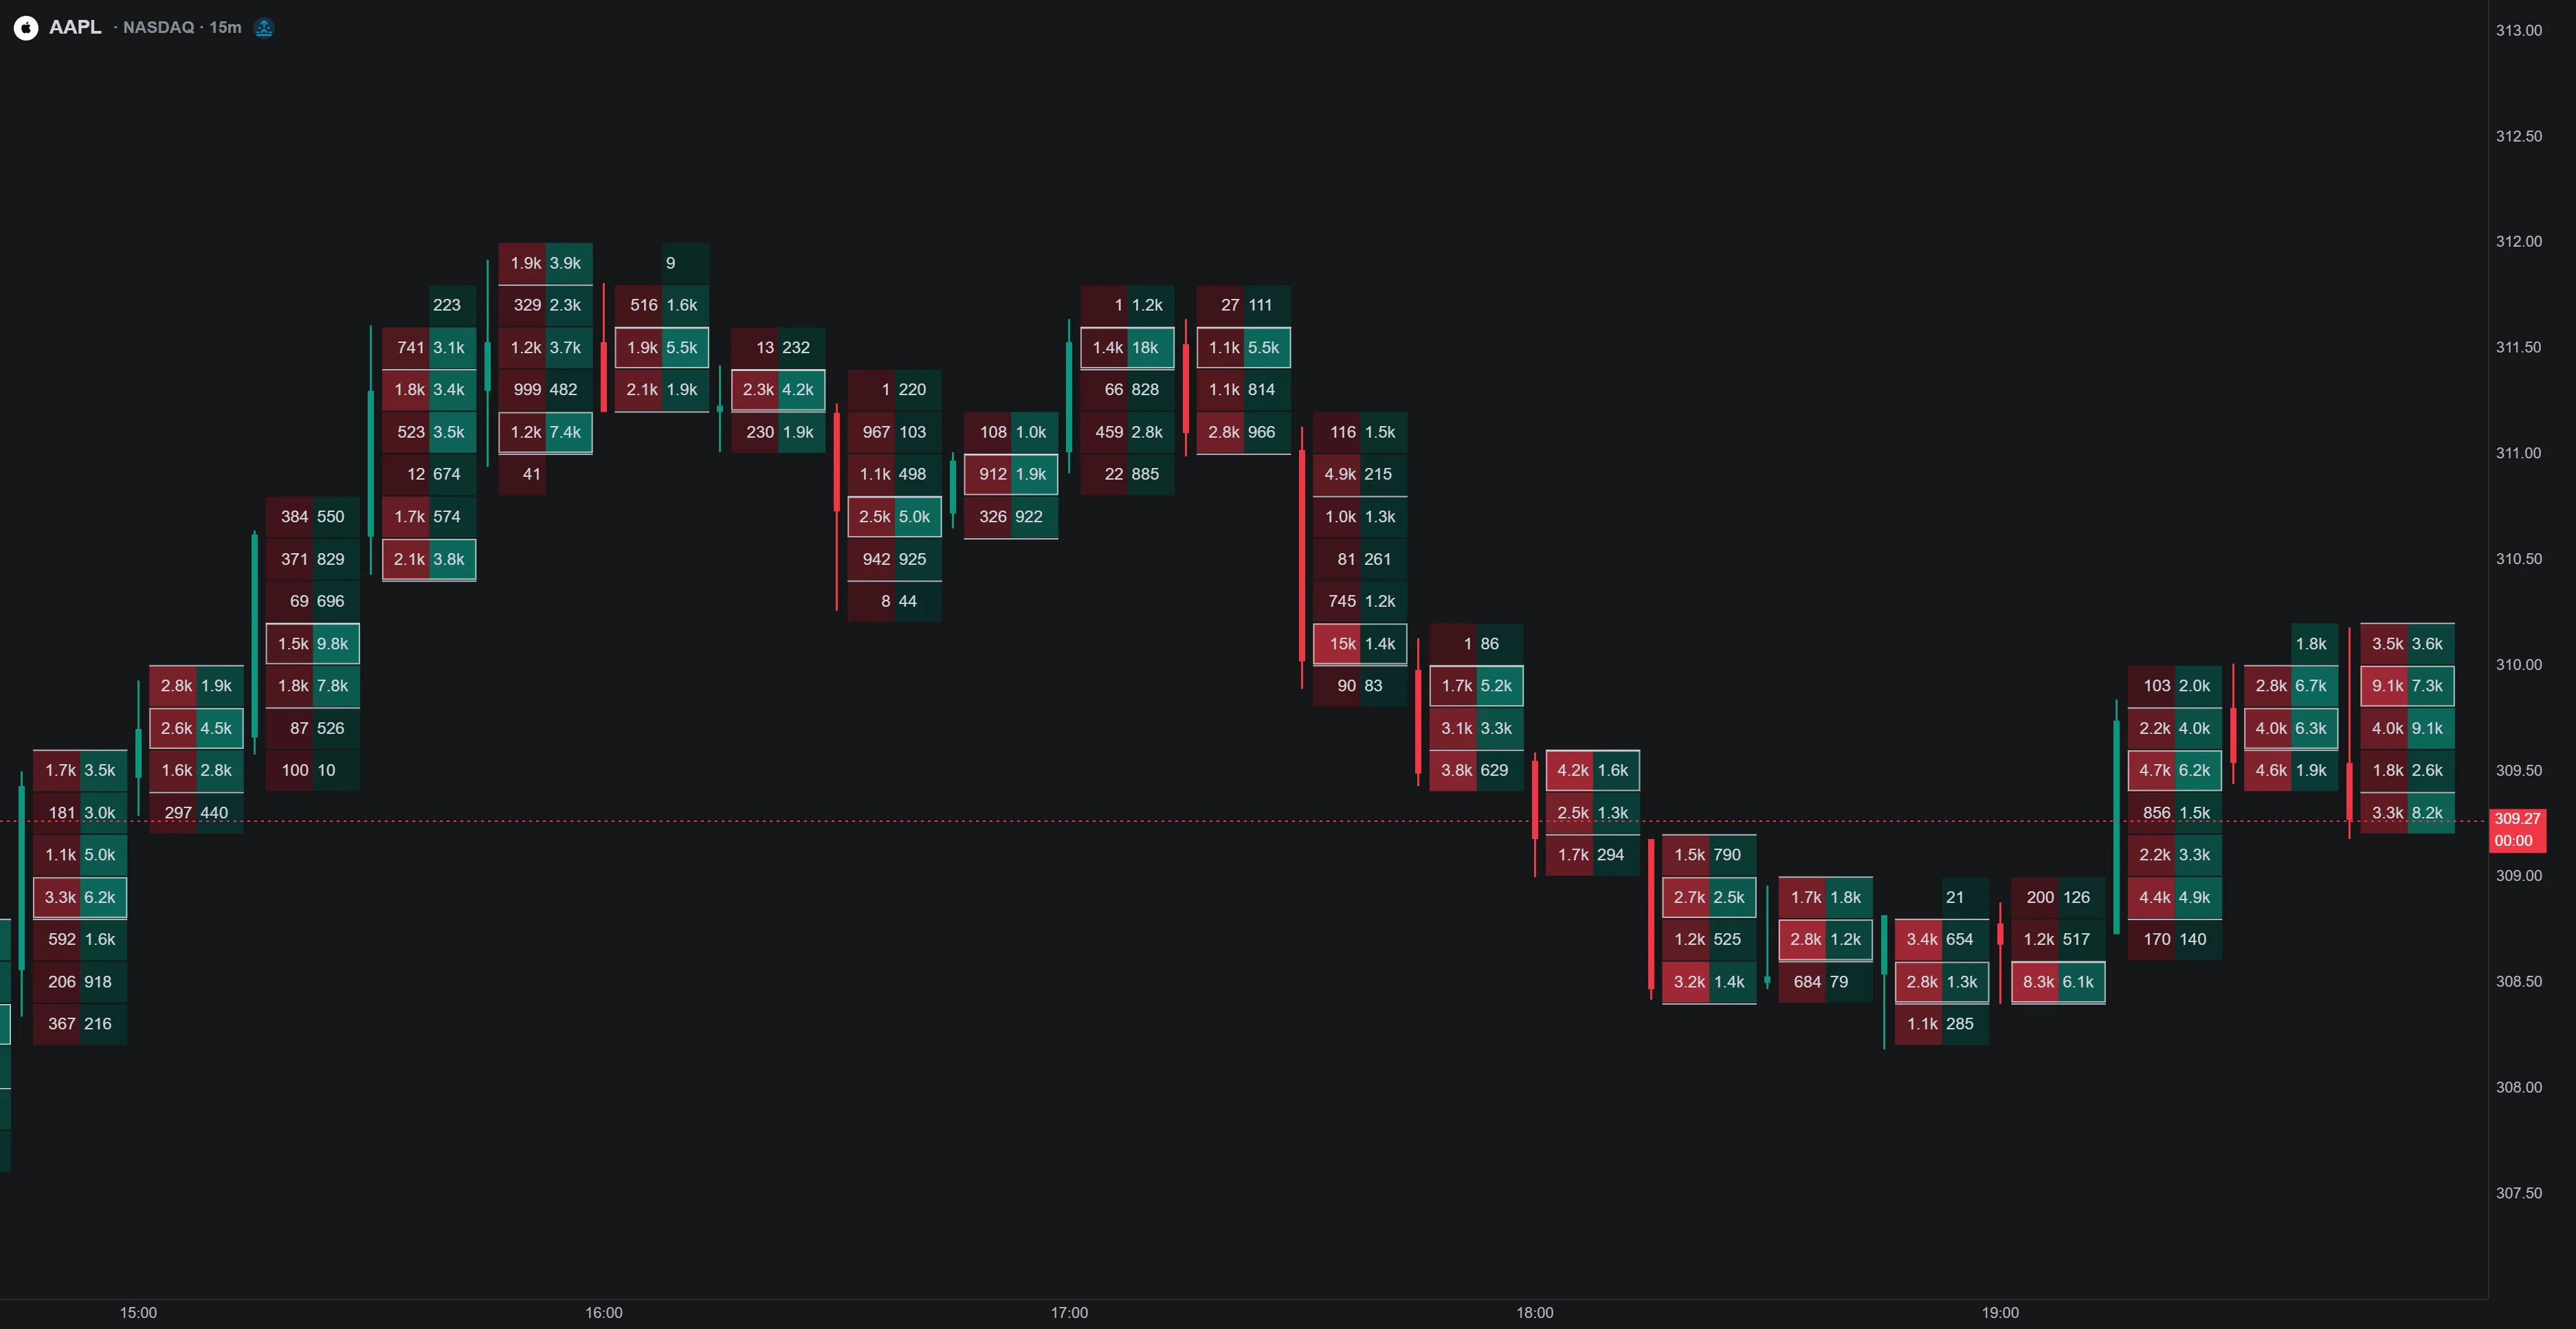
Check LuxAlgo’s market-data coverage before comparing observations. Footprint-dependent tools support crypto and US equities; the documented US-equity source is Cboe EDGX, which should not be treated as a consolidated all-venue book. Forex, commodities and CME futures have candle coverage, while candle-based TPO, VWAP and Visible Range Volume Profile work across supported markets.
For a supported chart-strategy hypothesis, ask Quant, our coding agent to help express the rules. Inspect the generated code and run it manually, then review the strategy settings and individual trades. Ordinary candle history cannot reconstruct the historical quote spread, queue position or depth required for an order-book execution simulation.
Use the workspace demonstration below to organize related chart experiments. Keep the market, data source, session and cost assumptions with each test so the results can be compared meaningfully.
Choose Orders for the Execution Tradeoff
Investor.gov’s stock-order guide explains the central tradeoff: a market order does not guarantee a price, while a limit order controls the acceptable price but might not execute. A buy limit permits execution at the limit or lower; a sell limit permits the limit or higher.
A limit order is not automatically a way to earn the spread. A marketable limit order can take existing liquidity, and a resting order may wait behind others, receive only a partial execution or remain unfilled. After a fill, the price can move against the position. Order type should fit the urgency and acceptable price, not a promise of free execution.
Splitting a large order can reduce the amount submitted at once, but it adds timing and operational choices and does not guarantee lower total cost. Compare the resulting average execution price and fees with a clearly defined benchmark. Do not infer success solely because each smaller order looked manageable.
Automated and Manual Analysis
Automation can calculate spreads, record observations and issue alerts more consistently than repeated manual arithmetic. Manual review helps assess the source, assumptions and unusual conditions. Neither approach is inherently more accurate if the data is delayed, incomplete or incorrectly interpreted.
Choose a tool by the specific data and workflow it supports. Verify the venue, depth levels, timestamps, history, order permissions and total fees. A generic monthly price range or an “algorithm-driven” label does not establish quote quality or execution quality.
A Practical Execution Checklist
- Before entry: identify the instrument, session, quote source and whether the data is live or delayed.
- Calculate the spread in relevant units and compare available size with the planned order.
- Choose the order type and maximum acceptable price according to the trade’s urgency.
- After execution: compare the actual average fill and total fees with the recorded quote or chosen benchmark.
- During strategy review: test cost sensitivity and distinguish simulated assumptions from actual broker fills.
Trading more often makes small costs accumulate, but a low-frequency strategy is not automatically suitable for an illiquid instrument. A position still needs an executable exit. Use the spread and depth as inputs to sizing and execution planning, alongside the strategy’s own evidence and loss limits.
Frequently Asked Questions
What is the difference between bid and ask?
The bid is the buying quote and the ask is the selling quote. The best bid and ask refer to the highest bid and lowest offer within the specified market or feed.
Is the last traded price an executable quote?
Not necessarily. It records a past transaction. Current quotes, available quantity and routing affect a new order’s execution.
Does a narrow spread guarantee a good fill?
No. Depth can be thin, quotes can change and an order can execute at several levels. Consider size and the actual market as well as spread.
Is a LuxAlgo footprint a live DOM?
No. Native footprints summarize executed volume and per-side activity. They do not show a live book of resting bids and offers.
Do limit orders guarantee lower trading costs?
No. They constrain execution price but can remain unfilled or execute only partially. Total cost also depends on timing, fees and subsequent price movement.
Read next