Big Data in Algo Trading: Leveraging Massive Datasets
Algorithmic trading runs on data, and the datasets involved are large in three distinct ways: volume, because every trade and quote across dozens of venues is a record; velocity, because those records arrive in microseconds and decisions are made on them in milliseconds; and variety, because prices are now joined by text, transcripts, filings and other sources that were never designed as market data. Most of the writing about big data in trading lists vendors and quotes unverifiable percentages. This guide does something narrower and more useful: it explains what the data actually is and where it comes from, what the one indisputable use of very large datasets is, which is validating a strategy honestly, what the public record says about how automated systems fail, and how the order-flow, backtesting and journaling tools in Quant Charts put institutional-grade data in front of an individual trader.
What the Data Is
Market data comes in layers of increasing size and decreasing availability.
- Candles summarise a bar as open, high, low, close and volume. Every market has them, and most indicators are built on them.
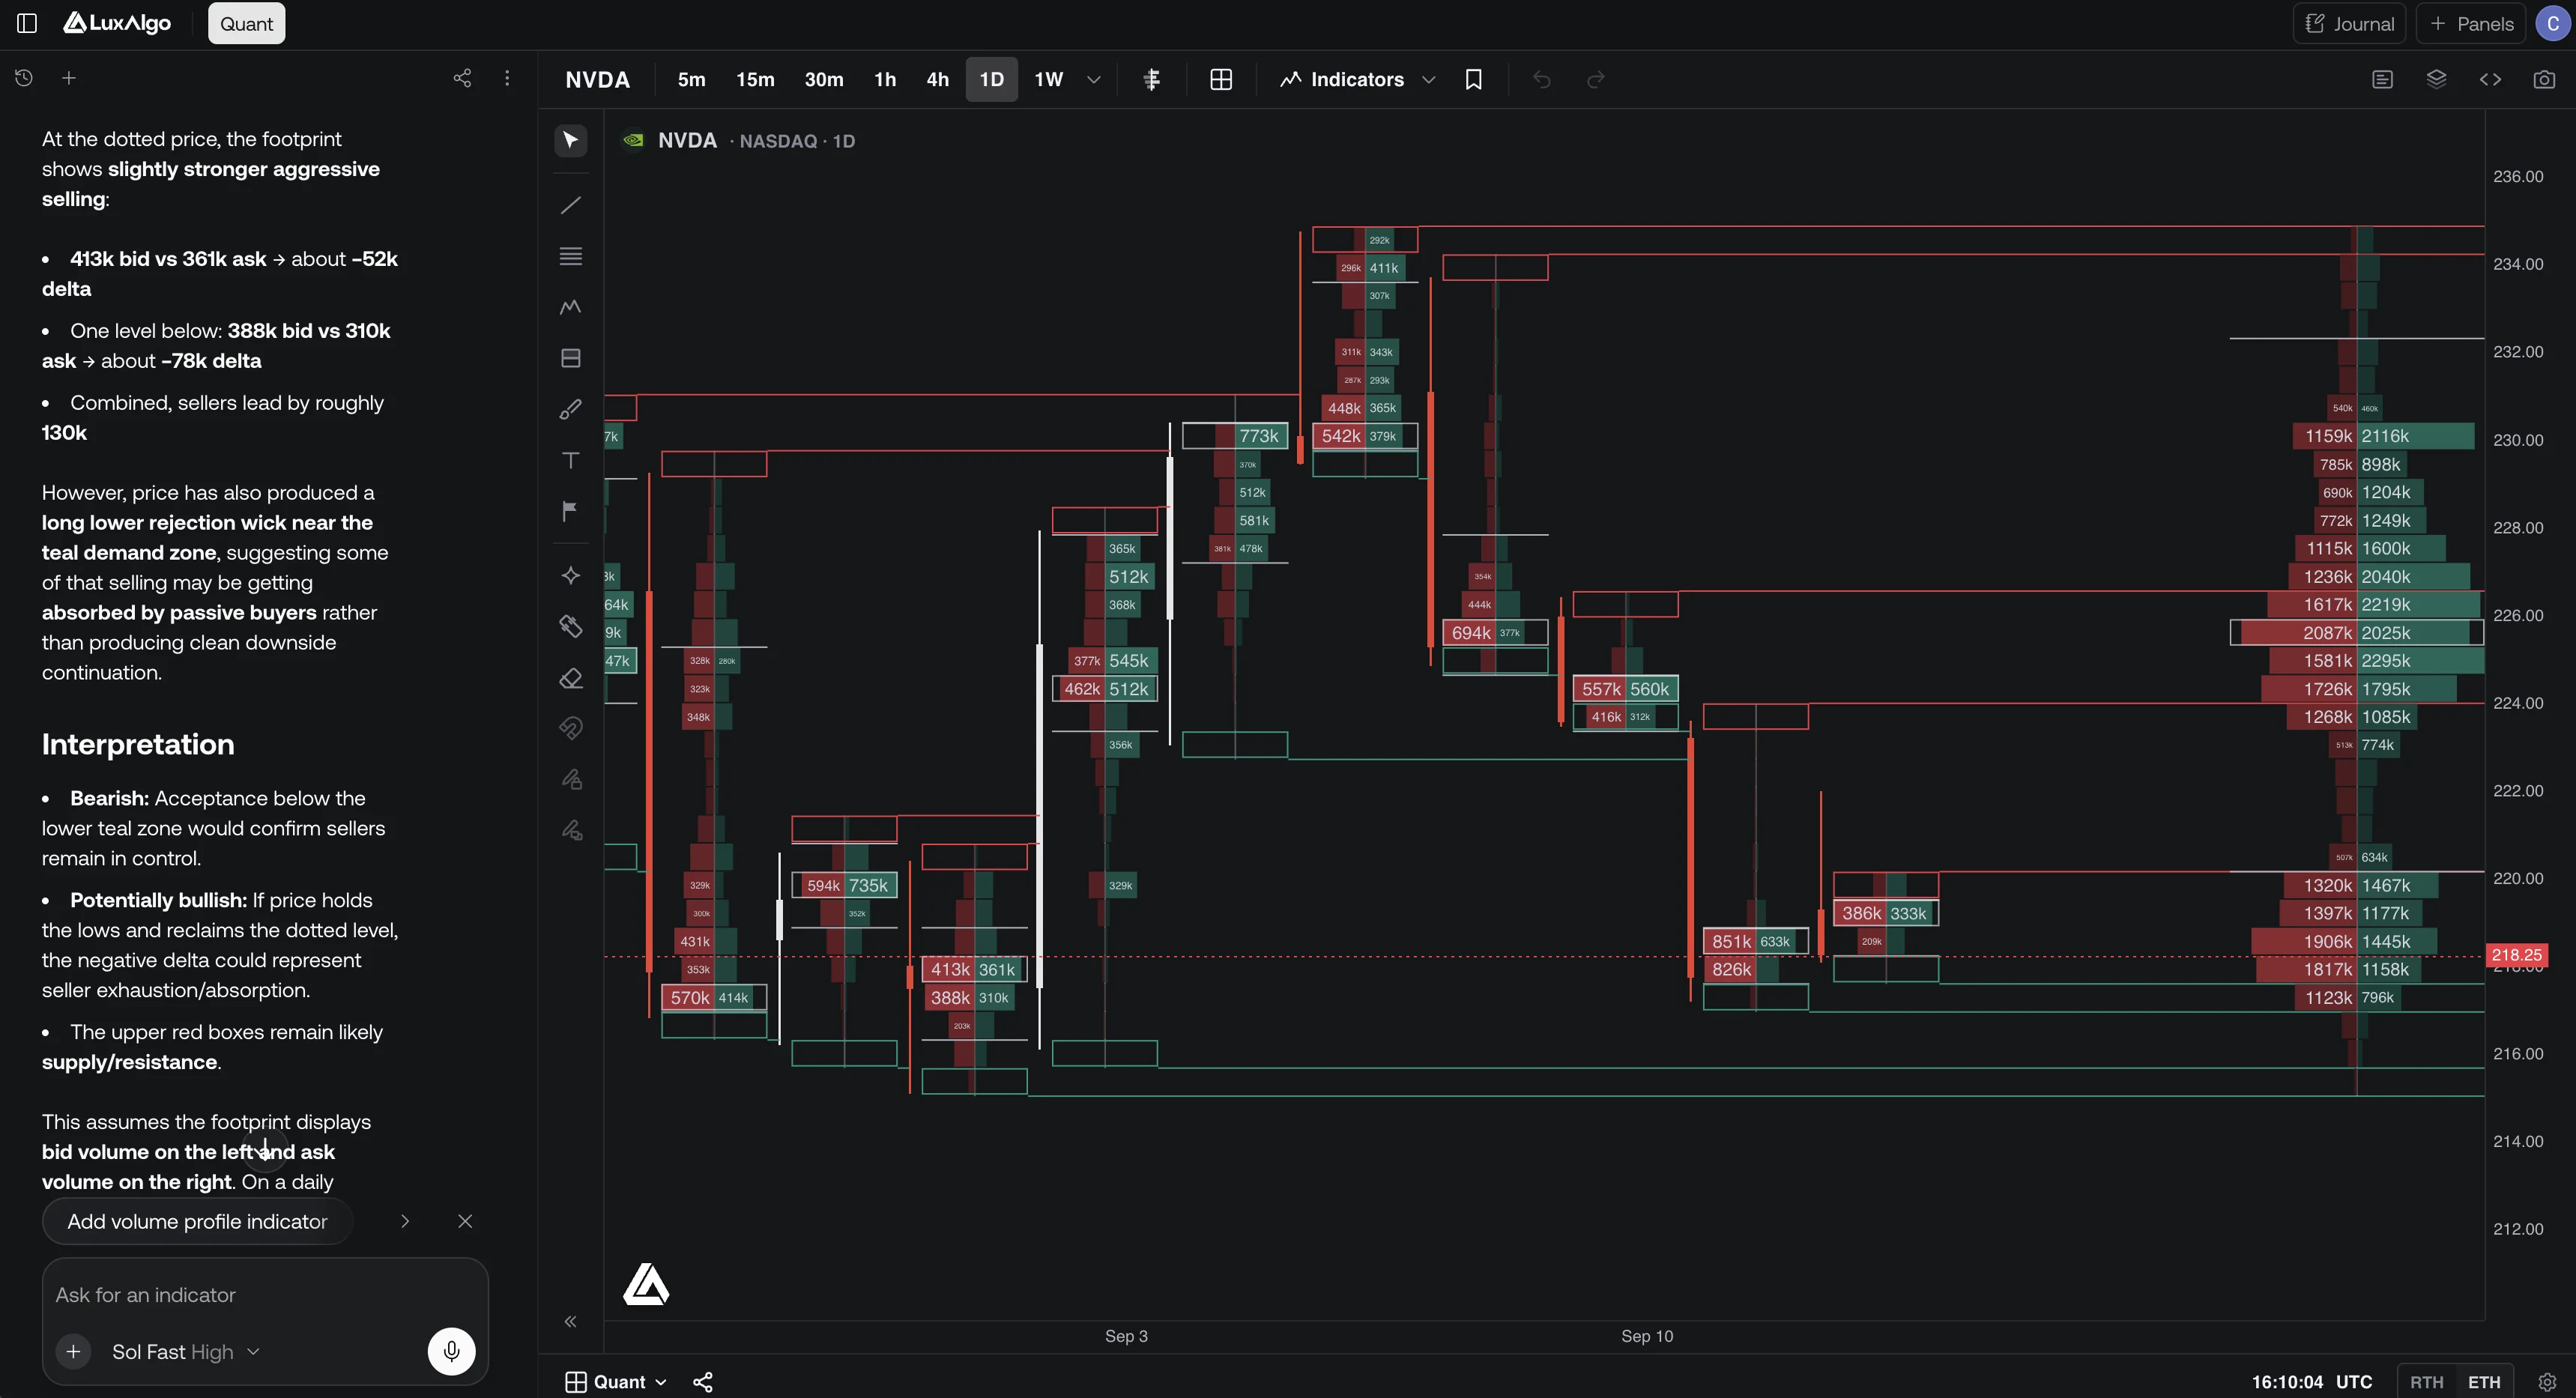
- Volume at price and trade counts record how much traded at each price inside a bar and how many prints hit each side. Quant Charts calls one-minute slices of this a footprint, and the docs are careful to say what it is not: a footprint is a pre-aggregated summary of executed volume at each price, not a trade tape or an order book.
- Tick and order-book data record every individual trade and every change to resting bids and offers. This is the raw material of high-frequency trading, and it is expensive, venue-specific and enormous.
- Alternative data covers anything that is not a price: news and filings, transcripts, web traffic, satellite images, card transactions, app usage. It is where the variety comes from and where the validation problems are worst.
Where the price data originates matters as much as its resolution. Investor.gov's description of market participants sets out the plumbing: broker-dealers handle trades for customers or from their own inventory, clearing agencies such as the National Securities Clearing Corporation compare and settle trades while the Depository Trust Company holds the securities, and alternative trading systems match orders under Regulation ATS without registering as exchanges. Trading in a US stock is spread across all of these, so a feed from a single exchange shows that venue's trading, not the consolidated market. Quant Charts states this plainly for its own data: US equities come from Cboe EDGX, and that data reflects trading on that exchange only and does not represent consolidated US market volume.
Alternative Data and Its Validation Problem
Alternative datasets promise information that price has not yet absorbed, and some of them deliver it. But each new source multiplies the ways a backtest can lie. Publication timestamps are often later than the moment the information was knowable, which creates look-ahead bias when a dataset is aligned to bars. Vendors restate history, remove sources and change methodology, so the series available today is not the series that existed at the time. Coverage is uneven across companies and periods, which biases any signal toward the names that were well covered. And the more sources a researcher can try, the more likely the best one looks good by chance. None of this makes alternative data worthless; it makes the testing discipline described next mandatory rather than optional.
The Real Use of Big Data Is Validation
The deepest benefit of a long, granular history is not finding patterns; it is finding out which patterns are real. The LuxAlgo Library documents the methods.
- In-sample and out-of-sample split. Parameters tuned on one stretch of data will always look good on that stretch, because an optimiser fits noise as readily as signal. The split holds back a later block, untouched until the design is frozen, and the drop from in-sample to out-of-sample performance is a rough gauge of how much of the backtest was overfitting. In trading the split is chronological, not random, because shuffled time series leak information across bars.
- Walk-forward analysis. The split repeated: optimise on one window, apply the parameters unchanged to the next unseen window, step forward, repeat, and stitch the out-of-sample segments into a single equity curve built entirely from trades taken with parameters chosen before the data existed. Walk-forward efficiency compares out-of-sample to in-sample performance, and watching the chosen parameters wander from window to window is a diagnostic no single split provides.
- Parameter stability. If a moving-average length of 20 tests well, lengths 17 through 24 should test comparably. A single value that shines while its neighbours fail is almost certainly noise the optimiser found; a plateau is evidence the edge comes from the idea.
- Probability of backtest overfitting. Introduced by Bailey, Borwein, Lopez de Prado and Zhu, it evaluates the research process rather than one strategy: given every configuration tried, how often does the in-sample winner fall into the bottom half out-of-sample? A high value says the selection procedure is unreliable, however good the winning equity curve looks.
Every one of these methods consumes data. Walk-forward needs enough history for many windows; parameter stability needs enough trades in each cell of the grid to mean anything; the probability of backtest overfitting needs the full trial-by-trial record. A large dataset is what makes honest validation possible, and a trader who has one and skips the validation has thrown away its main value.
What the Public Record Says About Failure
The clearest documented example of an automated trading failure is the Knight Capital incident, as described in the SEC's October 2013 press release announcing the first enforcement action under the market access rule, Rule 15c3-5. On August 1, 2012, a defective function in an automated equity router, left in the code since 2005, was triggered by a faulty code deployment. In the first 45 minutes after the open the router sent more than 4 million orders while attempting to fill 212 customer orders, the firm traded more than 397 million shares, acquired several billion dollars of unwanted positions and lost more than 460 million dollars. Before the open, an internal system had generated 97 automated emails identifying an error, which nobody acted on. The SEC's findings read as a checklist for anyone running code against a market: no control comparing orders leaving the router with those entered, capital-threshold controls incapable of stopping the orders, inadequate procedures for code deployment and testing, no written guidance for responding to a technology incident, and a review of controls that inventoried what existed instead of asking what would happen if a component malfunctioned.
FINRA's guidance on algorithmic trading generalises the lesson. Member firms running algorithmic strategies are subject to SEC and FINRA rules including the supervision rule, and the practices FINRA describes as effective are a holistic risk assessment, disciplined software development and implementation, testing and system validation before production, review of trading activity after a strategy is deployed or changed, and communication between compliance and the people building the strategies. Individual traders are not FINRA members, but the failure modes are identical at any scale: untested code, unchecked outputs and ignored warnings.
| Data problem | How it shows up | Control |
|---|---|---|
| Missing bars or gaps | Indicators computed over holes; false signals at gap edges | Detect and flag gaps rather than filling them silently |
| Duplicate or out-of-order records | Volume double-counted; cumulative series drift | Deduplicate on timestamp and sequence; sort before aggregation |
| Time zone and session mismatch | Sessions, daily resets and news aligned to the wrong candles | Store everything in one zone; convert at display time |
| Single-venue volume | Volume-based signals scaled to one exchange's share of trading | Compare against the same venue's own history; do not mix with consolidated figures |
| Restated or survivorship-biased history | Backtests on a cleaner past than existed | Keep point-in-time snapshots; record vendor changes |
| Untested deployment | Live behaviour differs from the backtest | Paper-trade the exact code; compare live fills with expected ones |
Where Quant Charts Fits
Order flow on every plan. Quant Charts builds its order-flow tools from pre-aggregated footprints, one-minute slices of volume at price and per-side trade counts re-bucketed to any timeframe. The full suite is on every plan and works on crypto and US equities, the footprint-capable markets; footprint history depends on the plan, with one day on Free, 90 days on Premium, a year on Ultimate and full history on Ultra. Switch the chart style to Footprint to make the profile the chart, or add Footprint, Volume Delta, Volume Profiles, Trade Count and other tools from Indicators under Orderflow. Tools that need trade counts leave honest gaps on bars without them rather than plotting zeros, and where a tool cannot run on the current market it warns instead of drawing a blank series.
Read aggression, not just volume. Volume Delta plots buy volume minus sell volume per bar, in Total mode for who traded more or Average mode for who traded larger, and Cumulative Volume Delta runs the sum with a chosen anchor. The Library's Cumulative Volume Delta entry explains what it adds: it separates aggression from result, so price making new highs while the delta makes lower highs is read as absorption. Relative volume, current volume as a multiple of the symbol's normal level at that time of day, is the simplest big-data screen there is, and a volume profile reorganises the same volume by price instead of time.
The video below shows how an indicator is added to a chart in Quant Charts.
Validate with Quant. Describe a rule to Quant, our coding agent, in plain language, including the data it should key on, such as relative volume above a threshold or a delta divergence. Quant writes the Pine Script; open Code to inspect it, then click Run. The Backtest Summary reports net profit, trade count, win rate, max drawdown and profit factor, with commission and slippage set in the strategy's Properties, and the docs note that leaving those at zero flatters every strategy. The maximised viewer adds Performance, Trades Analysis and Trades Log tabs, including a long-versus-short split and a trade-duration distribution, and you can change the symbol and timeframe inside the viewer to re-run the same strategy on different data, which the docs describe as the quickest check of whether an edge survives outside the market it was built on. Sweep an input and watch the summary strip react to check parameter stability; hold back a period you never look at during design to keep an out-of-sample test honest.
Journal the live result. Every plan includes the Journal, which turns broker fills or imported trades into round trips and reports win rate, profit factor and drawdown with a breakdown by hold time, day, time of day, symbol and side. The live record is the final validation step: if fills, slippage and timing differ from the backtest's assumptions, the Journal is where the difference shows.
What the platform does not do. The LuxAlgo platform does not place orders for you or run a strategy against a broker, so the market-access failures in the SEC's account cannot originate here. Quant Charts does not provide a trade tape, an order book or alternative datasets; it provides candles, footprints and the tools to test rules on them.
FAQs
What does big data mean in algorithmic trading?
Datasets that are large in volume, velocity and variety: every trade and quote across venues, arriving in microseconds, alongside text, filings and other non-price sources. The layers run from candles through volume at price and trade counts to full tick and order-book data and alternative data.
What is a footprint and how is it different from an order book?
In Quant Charts a footprint is a one-minute slice of volume at price and per-side trade counts, re-bucketed to any timeframe. It is a pre-aggregated summary of executed volume, not a trade tape or an order book, which record individual trades and resting orders.
Why is validation the main use of large datasets?
Because an optimiser fits noise as readily as signal, the only way to know whether a pattern is real is to test it on data it was not selected on. In-sample and out-of-sample splits, walk-forward analysis, parameter stability and the probability of backtest overfitting all require long, granular history to work.
What happened at Knight Capital?
According to the SEC's 2013 press release, a faulty code deployment on August 1, 2012 triggered a defective router function that sent more than 4 million orders while trying to fill 212 customer orders, producing a loss of more than 460 million dollars. The SEC cited inadequate pre-submission controls, capital-threshold controls, code deployment and testing procedures and incident procedures.
Why does it matter that volume comes from one exchange?
US stock trading is spread across exchanges, alternative trading systems and broker-dealers, so one venue's volume is a share of the total, not the consolidated figure. Quant Charts states that its Cboe EDGX data reflects trading on that exchange only. Compare volume against the same venue's own history rather than mixing sources.
Does Quant Charts provide big data tools?
It provides candles and pre-aggregated footprints with order-flow tools on every plan, footprint history that grows with the plan, Quant to write and backtest rules with a full viewer, and a Journal for live results. It does not place orders or provide a tape, an order book or alternative datasets.
References
LuxAlgo Resources
- In-sample / Out-of-sample Split, Walk-forward Analysis, Parameter Stability and Probability of Backtest Overfitting concepts (LuxAlgo Library)
- Relative Volume, Cumulative Volume Delta and Volume Profile concepts (LuxAlgo Library)
- Data, Order Flow, Footprint, Volume Delta, Strategies and the Backtest viewer and Making strategies with Quant (LuxAlgo Docs)
External Resources
- SEC Charges Knight Capital With Violations of Market Access Rule, press release 2013-222, October 16, 2013 (U.S. Securities and Exchange Commission)
- Algorithmic Trading, key topic overview (FINRA)
- Market Participants (Investor.gov)
This article is educational and is not trading advice. Backtested and simulated results do not represent actual trading, and validation methods reduce but do not remove the risk that a strategy fails in live markets.
Read next