Biotech Stocks: Invest in Healthcare Innovation

Biotechnology stocks are unlike most equities because their value hinges on a small number of regulatory decisions rather than on quarterly sales. A company can spend a decade and most of its capital on a single drug candidate, and the stock reprices in one session when a trial reads out or the FDA acts. That structure is what makes the sector attractive to investors who want exposure to medical innovation, and what makes it dangerous to anyone who treats a biotech like an ordinary growth stock. This guide describes the drug development pathway in the FDA's own terms, shows what public filings reveal about a biotech's odds and its cash, explains how the stocks behave around binary events, sets out sizing rules for outcomes that gap, and describes how to run the routine in Quant Charts. It names no companies and quotes no market-size forecasts.
What Makes Biotech Different
Three features separate a development-stage biotechnology company from other public companies. First, it usually has no product revenue: the value of the business is the probability-weighted value of a pipeline of drug candidates, so news about those candidates is the only news that matters. Second, it consumes cash it did not earn, raising money from investors in successive rounds, so the balance sheet sets a clock. Third, the decisive events are discrete and scheduled: a trial completion, an FDA filing, a review decision. Between events the stock drifts with the sector; at events it gaps.
Investor.gov's guide to stocks places most development-stage biotechs in the growth and small-cap categories, and many are microcaps, which Investor.gov defines as companies with market capitalizations of roughly $250 million to $300 million or less, with the smallest, under $50 million, sometimes called nanocaps. Its stocks overview warns that the lowest-priced shares of companies with little or no earnings are highly speculative. That description fits a large part of the sector.
The FDA Pathway, Stage by Stage
The FDA describes drug development as five steps: discovery and development, preclinical research, clinical research, FDA review and post-market safety monitoring. Before testing in people, the sponsor files an Investigational New Drug application containing animal and toxicity data, manufacturing information, clinical protocols, any prior human data and information about the investigators. The clinical phases then run in sequence, and the FDA's own summary gives their typical size, length and pass-through rates.
| Phase | Participants | Length | Purpose | Share advancing (FDA) |
|---|---|---|---|---|
| Phase 1 | 20 to 100 healthy volunteers or patients | Several months | Safety and dosage | About 70 percent |
| Phase 2 | Up to several hundred patients | Several months to 2 years | Efficacy and side effects | About 33 percent |
| Phase 3 | 300 to 3,000 patients | 1 to 4 years | Efficacy and monitoring of adverse reactions | About 25 to 30 percent |
| FDA review | New Drug Application or Biologics License Application | 6 to 10 months after filing is accepted | Approve or not approve; labeling | Decision, sometimes with an advisory committee |
| Phase 4 | Several thousand patients | Ongoing | Post-market safety and efficacy | Not applicable |
Two details in the FDA's description matter for an investor. The agency notes that Phase 2 studies are not large enough to show whether a drug will be beneficial; they refine the questions Phase 3 must answer, which is why a positive Phase 2 headline is weaker evidence than it sounds. And once a New Drug Application is filed, the review team first decides whether it is complete and can refuse to file it; if accepted, the team has 6 to 10 months to decide, may convene an advisory committee for independent expert advice, and may approve, request more data or require further studies. Each of those is a date on which the stock can gap.
The FDA also runs four expedited programs for serious conditions: Fast Track, Breakthrough Therapy, Accelerated Approval, which permits approval on a surrogate endpoint, and Priority Review, under which the FDA's goal is to act within six months. A designation shortens timelines and is often treated by the market as a signal, but it is not an approval and does not change the evidence the drug must eventually produce.
What the Filings Tell You
Investor.gov defines a public company as one with public reporting obligations, and its guide to researching investments explains how to read the documents those obligations produce. For a biotech, three are decisive.
- The 10-K risk factors and liquidity discussion. The annual report states how much cash the company holds and how long management expects it to last. Dividing cash by the quarterly operating loss gives a rough runway. A runway shorter than the time to the next trial readout means a financing, usually a dilutive share offering, is coming before the catalyst.
- The 8-K. Material events, including trial results, FDA correspondence, financings and partnership agreements, are disclosed here within days. The 8-K, not the press release, is the version to read.
- Forms 3, 4 and 5. Insider transactions. Whether executives are buying ahead of a readout is public information.
Investor.gov also flags two structures common in small biotechs. A private company can become public by merging with a public shell, a reverse merger, and Investor.gov advises caution with such companies. And some securities trade on smaller markets without regular public reporting; Investor.gov calls investing in them riskier because there is little information on which to base a decision. Trial registrations, including design, endpoints and expected completion dates, are public on ClinicalTrials.gov, which lets an investor check a company's timeline against its own registration.
Patents and Exclusivity
A drug that reaches the market is protected by patents and by regulatory exclusivity, and both expire. The USPTO's patent essentials page states that a utility patent term is 20 years from the filing date of the first non-provisional application, that maintenance fees are required to keep it in force, and that terms may be extended or adjusted in certain conditions. Because much of that term is consumed by development, the years of protected sales left at approval are the figure that matters, and the 10-K lists the expiry dates. A company whose lead product loses exclusivity within a few years faces generic or biosimilar competition and a revenue cliff.
How the Stocks Behave Around Events
Biotech price action is dominated by gaps. A trial result or an FDA decision is usually released outside market hours, so the first trade of the next session can be far from the prior close in either direction, and no order placed inside the gap fills. The Library's gap fill entry describes what happens next: some gaps are traded back through to the pre-gap reference, while gaps that stay open as price runs are the signature of breakaway moves, and whether a given gap fills is not knowable in advance. For a binary event the direction of the gap is decided by the data, not by the chart.
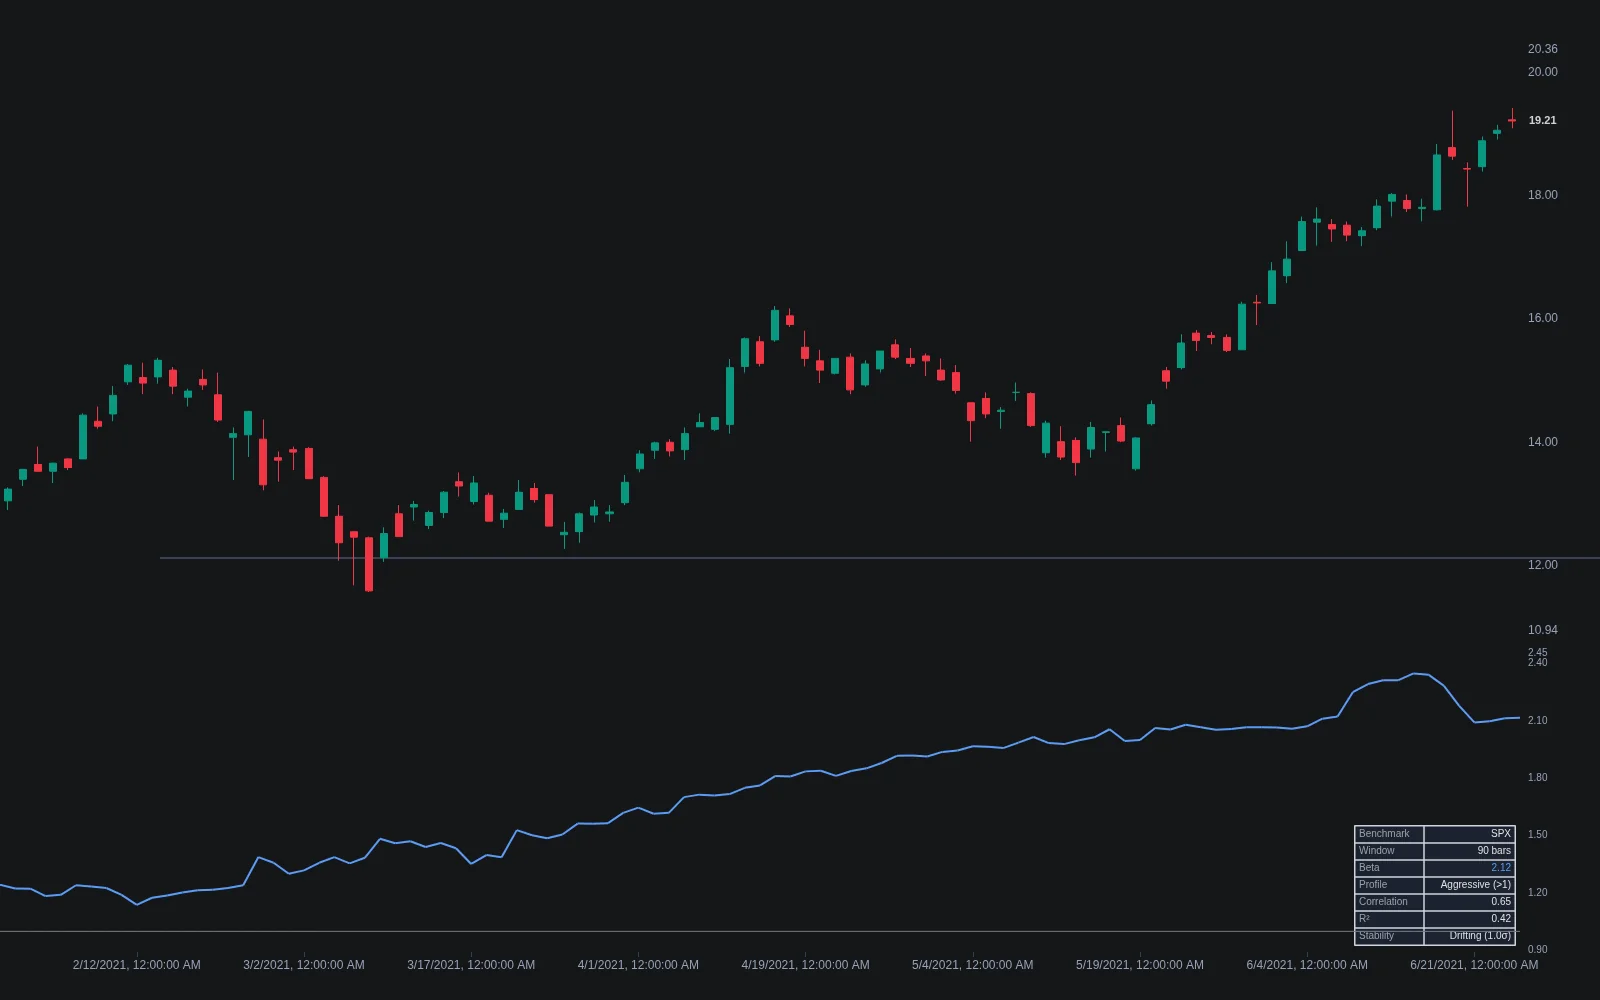
Between events, the sector moves together. The Library's beta entry defines beta as how strongly an asset's returns move with a benchmark's, and notes that a volatile, loosely correlated asset can print a large beta. Small biotechs typically show high beta to a biotech index and unstable beta to the broad market, which means a position's day-to-day risk is set by the sector even when the company has no news. The Beta indicator plots the rolling estimate with a stability read that flags when the number has drifted.
Sizing for Binary Outcomes
A stop-loss order protects against a decline the market trades through. It does not protect against a gap, because the stop becomes a market order only once the stock trades at the stop price, and the first trade after an overnight decision may be far below it. Sizing therefore has to assume the position can lose a large fraction of its value at once.
- Fixed fractional sizing risks the same fraction of equity on each trade, back-solving share count from the stop distance. The Library's fixed fractional entry is explicit that gaps and slippage can take more than the budgeted fraction. For a position held through a readout, the honest stop distance is the full expected gap, not a technical level.
- The Kelly criterion gives the fraction that maximizes long-run growth for a bet with known odds, and the Library's entry describes it as a hard ceiling: sizing above it raises volatility and lowers growth at the same time. Since trial odds are estimates, fractional Kelly is the practical reading.
- Risk of ruin is the probability that an account falls to a level from which it cannot continue. The Library's entry stresses how nonlinear it is in risk per trade, which is why a portfolio of several small binary positions survives outcomes that one large position would not.
Diversification within the sector does the rest. Holding candidates across different stages and different therapeutic areas means that no single readout decides the year, and a position that has already been financed through its next catalyst is a different risk from one that has not.
| Question before a position | Where the answer is |
|---|---|
| What stage is the lead candidate, and what does the FDA say that stage proves? | ClinicalTrials.gov registration; FDA clinical research step |
| When is the next readout or FDA decision? | Company 8-K and 10-K; trial registration |
| Does cash last past that date? | 10-K and 10-Q balance sheet and liquidity discussion |
| How many years of exclusivity remain after approval? | 10-K intellectual property section; USPTO term rules |
| How does the stock move with the sector between events? | Beta against a biotech benchmark |
| What is the loss if the event gaps against me? | Position size times the full gap, not the stop distance |
Where Quant Charts Fits
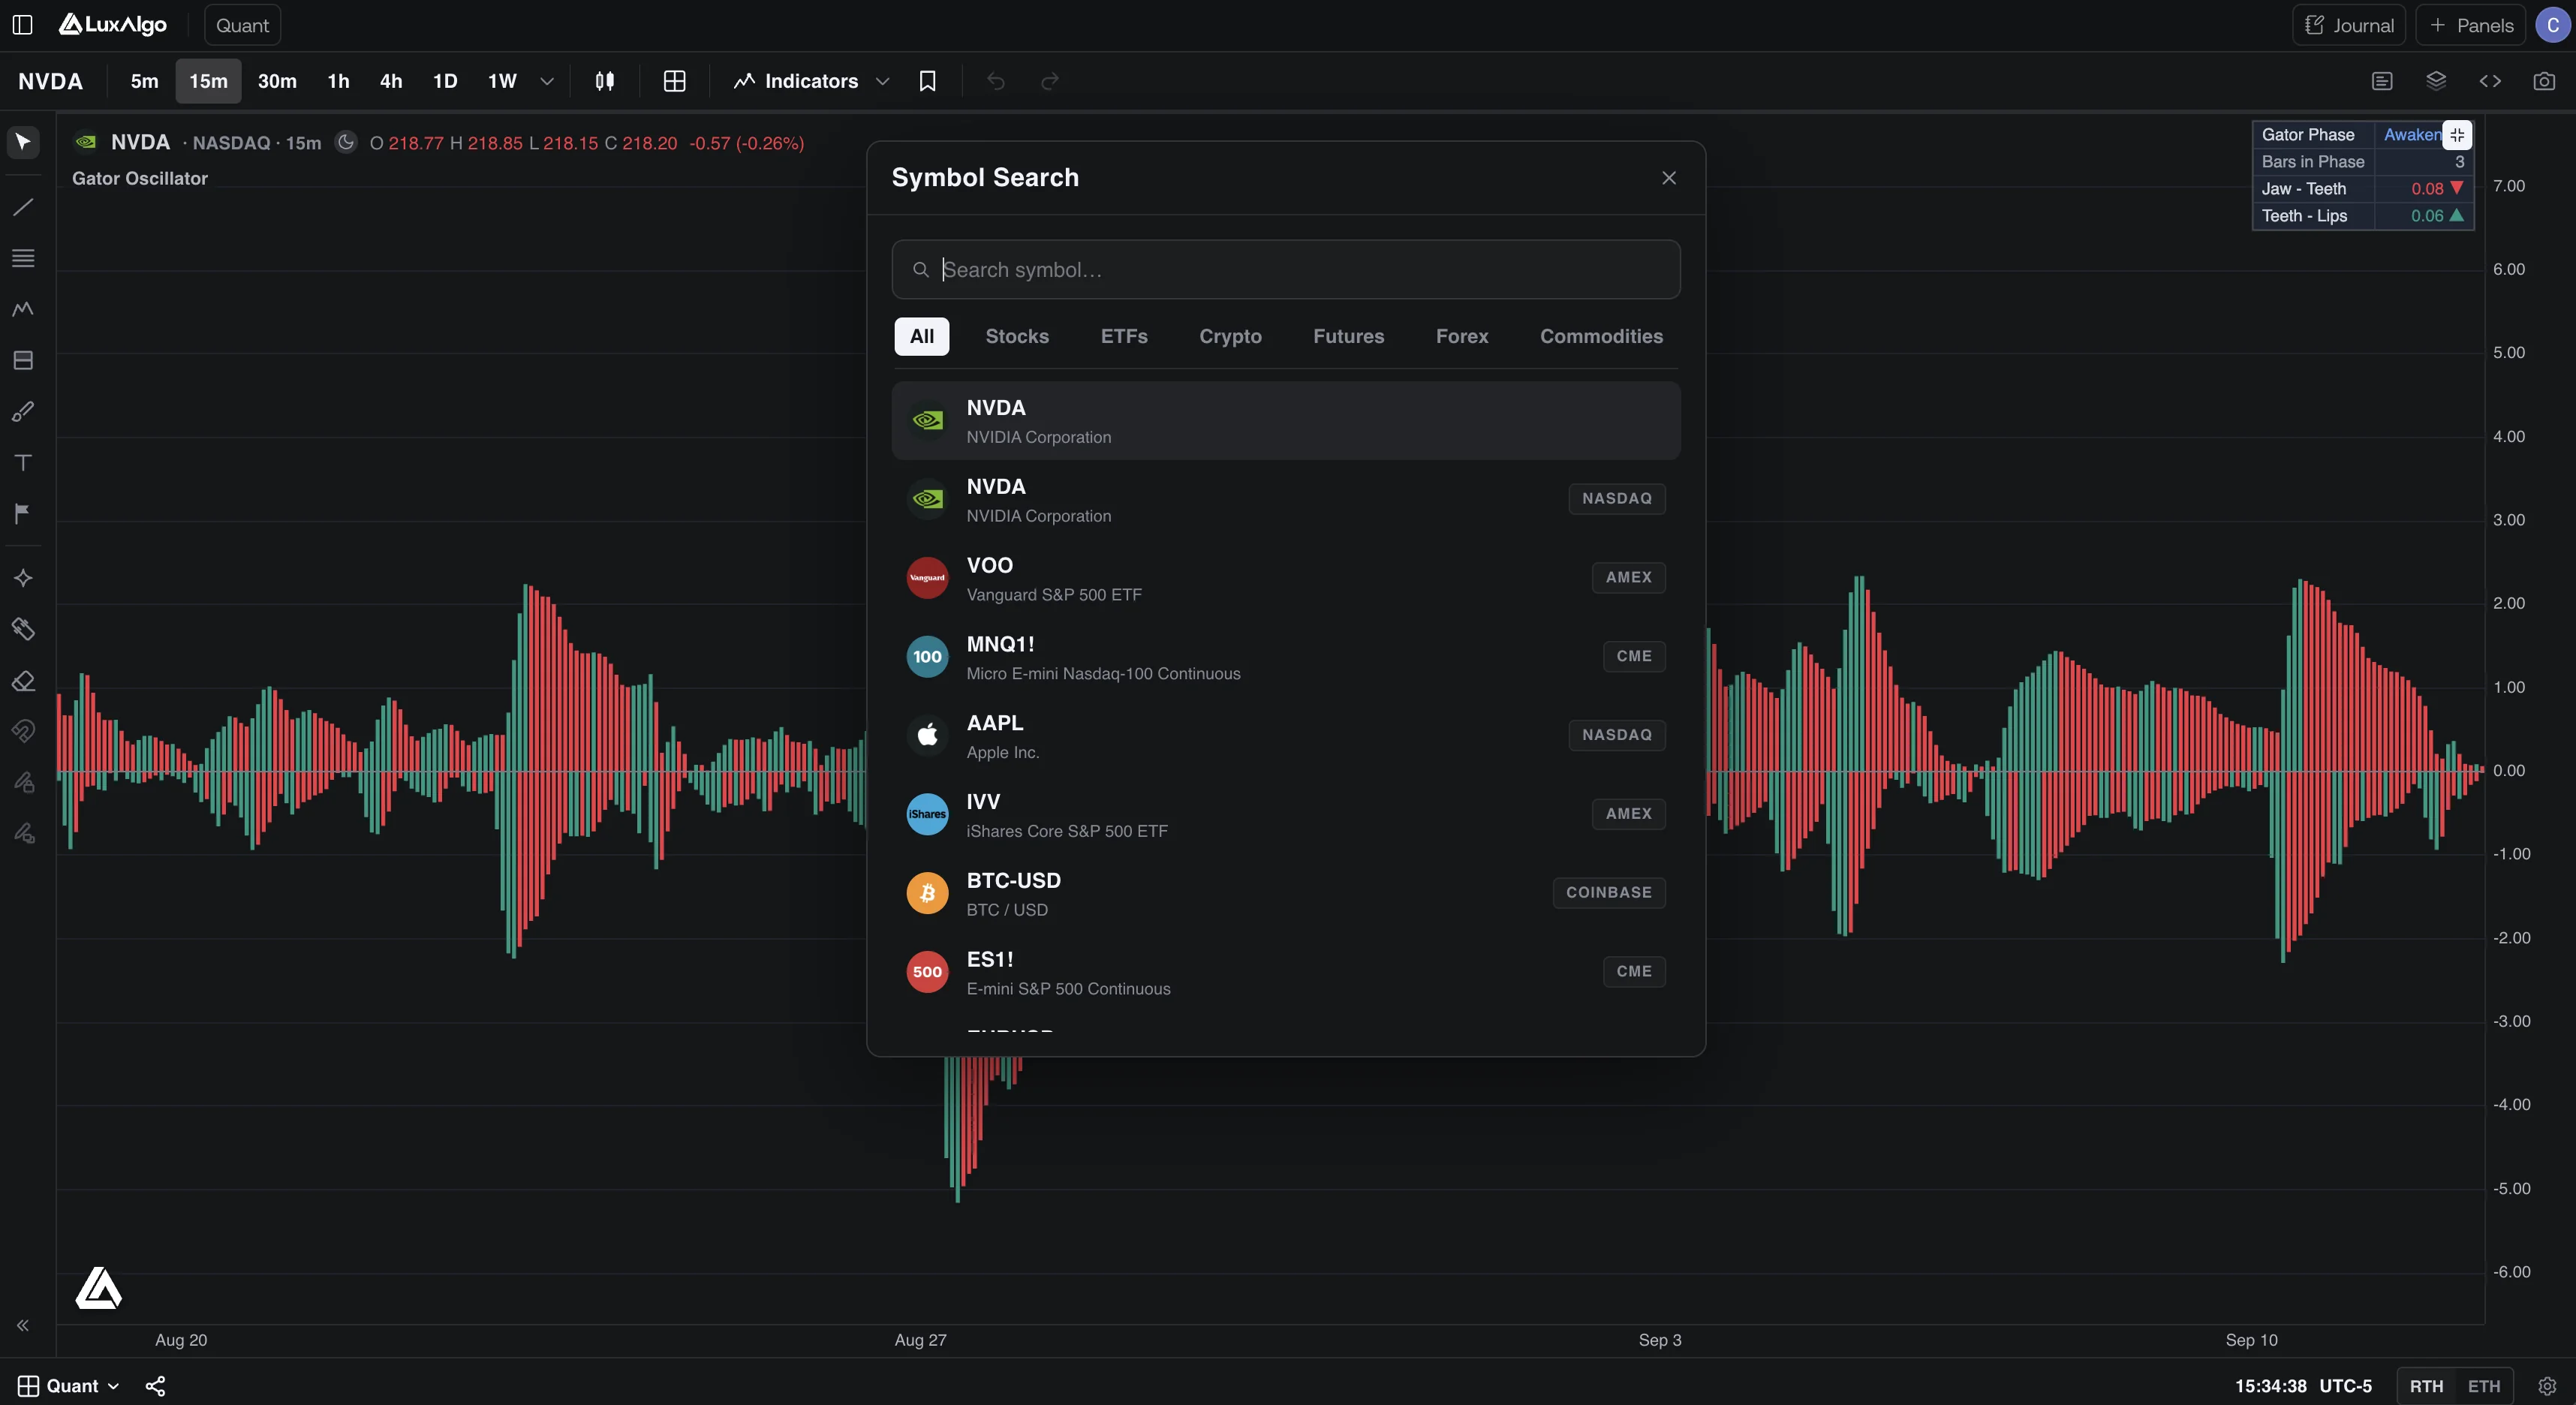
A watchlist organized by stage. Quant Charts includes US equities and ETFs from Cboe EDGX on every plan, so listed biotechnology companies and sector ETFs load through Symbol Search. Keep a dedicated watchlist and use Sections in the Advanced view to group names by stage, for example Phase 2, Phase 3 and under review, or by the month of the next expected event. The News tab shows a headline feed for the list, filterable by symbol, and the Financials tab shows revenue, net income and EPS where they exist, which for a development-stage company is mostly the size of the loss.
Indicators for the between-event drift. Add the Beta indicator with a biotech ETF as the benchmark to see how much of a position's movement is sector rather than company. The Library's gap implementations mark gaps on the chart and track whether they have filled, which is the right frame for the morning after a readout.
The video below shows how a watchlist is created in Quant Charts.
Quant tests the post-event rule. The tradable question in biotech is often not the event itself but what happens after it: does a stock that gaps up on approval continue, or does the gap fill? Describe a rule to Quant, our coding agent, in plain language, for example buying the close of a session that opens more than 20 percent above the prior close with relative volume above three and exiting after ten sessions or at a stop two ATRs below the entry. Quant writes the Pine Script; open Code to inspect it, then click Run. The Backtest Summary reports net profit, trade count, win rate, max drawdown and profit factor, with commission and slippage set in the strategy's Properties. Run it across a list of names and the trade count will be small, which is itself the finding: biotech event trades are rare, and a rule tested on a handful of them is not yet a rule.
The Journal records what the gaps did. Every plan includes the Journal, which turns broker fills or imported trades into round trips and breaks down results by symbol, side and hold time. A Journal tag for event trades, kept separate from sector swing trades, shows over time whether holding through readouts has paid for its risk. No LuxAlgo tool places orders; the Journal records trades made elsewhere.
FAQs
What are the phases of a clinical trial?
The FDA describes Phase 1 as 20 to 100 volunteers over several months for safety and dosage, Phase 2 as up to several hundred patients over months to two years for efficacy and side effects, and Phase 3 as 300 to 3,000 patients over one to four years to demonstrate treatment benefit. Phase 4 follows approval.
How many drugs advance from one phase to the next?
The FDA's clinical research page states that approximately 70 percent of drugs move from Phase 1 to Phase 2, about 33 percent from Phase 2 to Phase 3, and about 25 to 30 percent from Phase 3 to the next stage. Multiplying those rates shows why most candidates entering Phase 1 never reach the market.
How long does FDA review take?
Once a New Drug Application is accepted for filing, the FDA says the review team has 6 to 10 months to decide. Under Priority Review the agency's goal is six months. The team may also refuse to file an incomplete application or convene an advisory committee.
Does a Fast Track or Breakthrough designation mean a drug will be approved?
No. The FDA's expedited programs speed development and review for serious conditions, and Accelerated Approval allows approval on a surrogate endpoint, but each drug must still meet the evidence standard. A designation changes the timeline, not the outcome.
Why don't stop-loss orders protect a biotech position through a readout?
Results are usually released outside market hours, and the next session opens at a new price. A stop becomes a market order only when the stock trades at the stop price, so it fills at the post-gap price, which can be far lower. Size the position for the full gap instead.
How can Quant Charts help with biotech stocks?
Listed biotechs and sector ETFs are available on every plan. Organize a watchlist by trial stage with Sections, follow headlines in the News tab, plot Beta against a sector ETF, backtest a post-event rule with Quant and read win rate, max drawdown and profit factor, and tag event trades in the Journal.
References
LuxAlgo Resources
- Beta, Gap Fill, Fixed Fractional, Kelly Criterion and Risk of Ruin concepts (LuxAlgo Library)
- Beta indicator (LuxAlgo Library)
- Watchlist Advanced view and Data (LuxAlgo Docs)
- Making strategies with Quant and Journal (LuxAlgo Docs)
External Resources
- The Drug Development Process, Step 3: Clinical Research and Step 4: FDA Drug Review (FDA)
- Fast Track, Breakthrough Therapy, Accelerated Approval, Priority Review and Advisory Committees (FDA)
- ClinicalTrials.gov (National Library of Medicine)
- Public Companies, Researching Investments and Microcap Stock (Investor.gov)
- Patent Essentials (USPTO)
This article is educational and is not a recommendation to buy or sell any security. Development-stage biotechnology stocks can lose most of their value on a single announcement.
Read next