Bollinger Bands Strategy: Squeeze then Surge
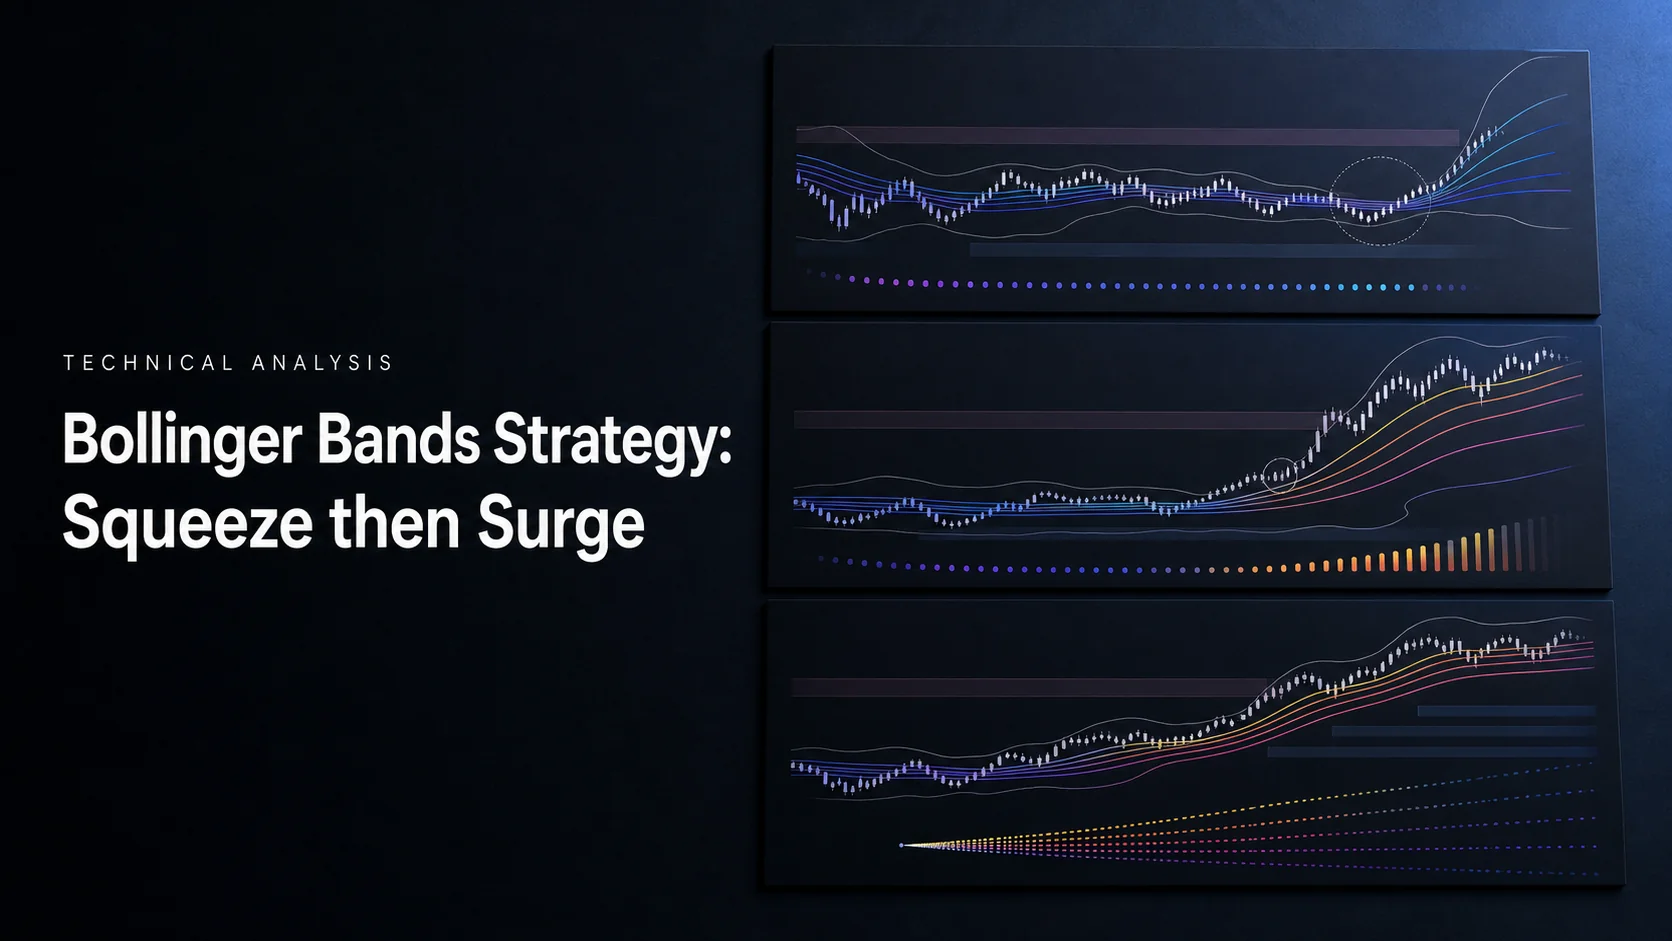
The Bollinger Bands Squeeze–Surge strategy looks for unusually quiet price action followed by an expansion in volatility. Narrow bands identify the setup; a defined breakout rule supplies the possible entry. The squeeze alone does not predict direction, how soon a move will begin or whether it will develop into a sustained trend.
Use LuxAlgo’s charting and AI platform to review the bands on Quant Charts and turn your entry, exit and risk rules into a test with Quant, our coding agent. This guide covers BandWidth, breakout confirmation, ATR-based stops and the checks needed to keep a promising historical chart from becoming an unrealistic strategy.
How to Spot a Squeeze Pattern
Recognizing Band Patterns
The standard construction uses a 20-period simple moving average of closes as the middle band. The upper and lower bands sit two standard deviations above and below that average, calculated from the same 20-bar window. These are defaults, not settings proven best for every instrument.
In symbols, middle = SMA(close, 20), upper = middle + 2 × standard deviation, and lower = middle − 2 × standard deviation. Moving above the middle average is different from closing above the upper band. Specify which event your strategy requires.
A squeeze appears as the envelope narrows over several bars. Judge that width against the instrument’s own recent history. A visually tight section does not necessarily represent an extreme reading, and a squeeze does not require every candle to remain entirely inside the bands.
The LuxAlgo Bollinger Bands guide explains the underlying construction. Confirm the source series, lookback, standard-deviation convention and multiplier when comparing implementations; small differences can change which bar crosses a band.
Calculating Band Compression
Bollinger BandWidth normalizes the gap between the outer bands by the middle band. In percentage form:
BBW = ((upper − lower) / middle) × 100
With upper $102, lower $98 and middle $100, BBW is 4%. If the same middle value has bands at $108 and $92, BBW is 16%. A platform plotting the unscaled ratio displays 0.04 and 0.16 instead. Check the units before entering thresholds; 4 and 0.04 are not interchangeable inputs.
The Bollinger Squeeze concept guide describes the classic relative-low test: BandWidth at its lowest level over a lookback such as roughly six months of daily bars. A longer eight-to-twelve-month review provides context, but it is not the same detection rule. State the window in bars and timeframe rather than carrying a daily-bar setting unchanged into intraday analysis.
A low percentile over a fixed window is another possible definition. A rule using Bollinger Bands entirely inside Keltner Channels is a different squeeze test, commonly associated with TTM Squeeze. Do not combine those definitions under one label and assume they identify identical events.
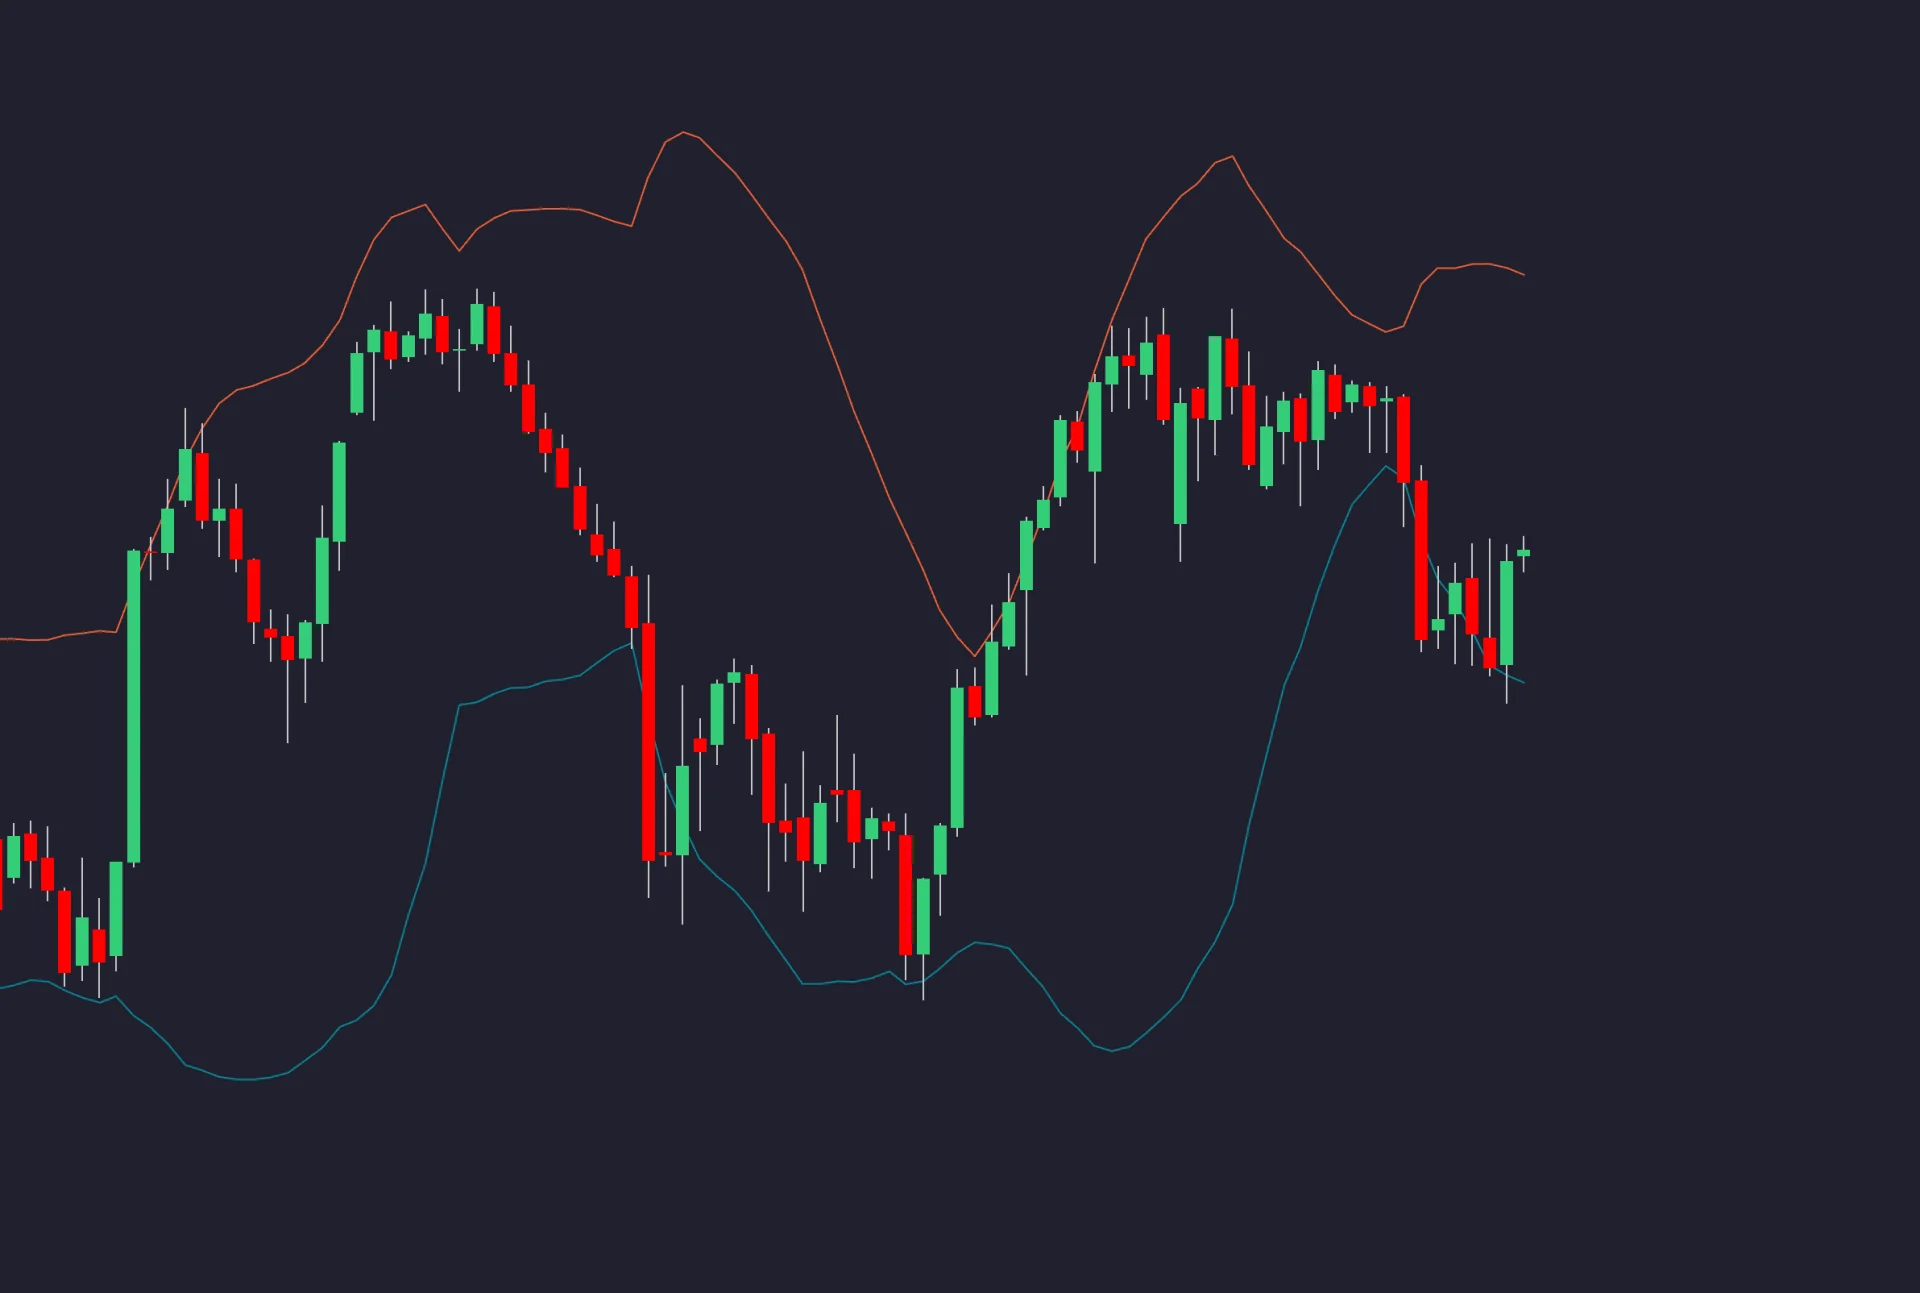
Reviewing the Setup in LuxAlgo
The current Bollinger Bands Library study offers Bands, %B and Bandwidth display modes. %B locates the source within the envelope; Bandwidth measures its relative separation. For a squeeze review, keep the price structure and the relevant width measurement available together.
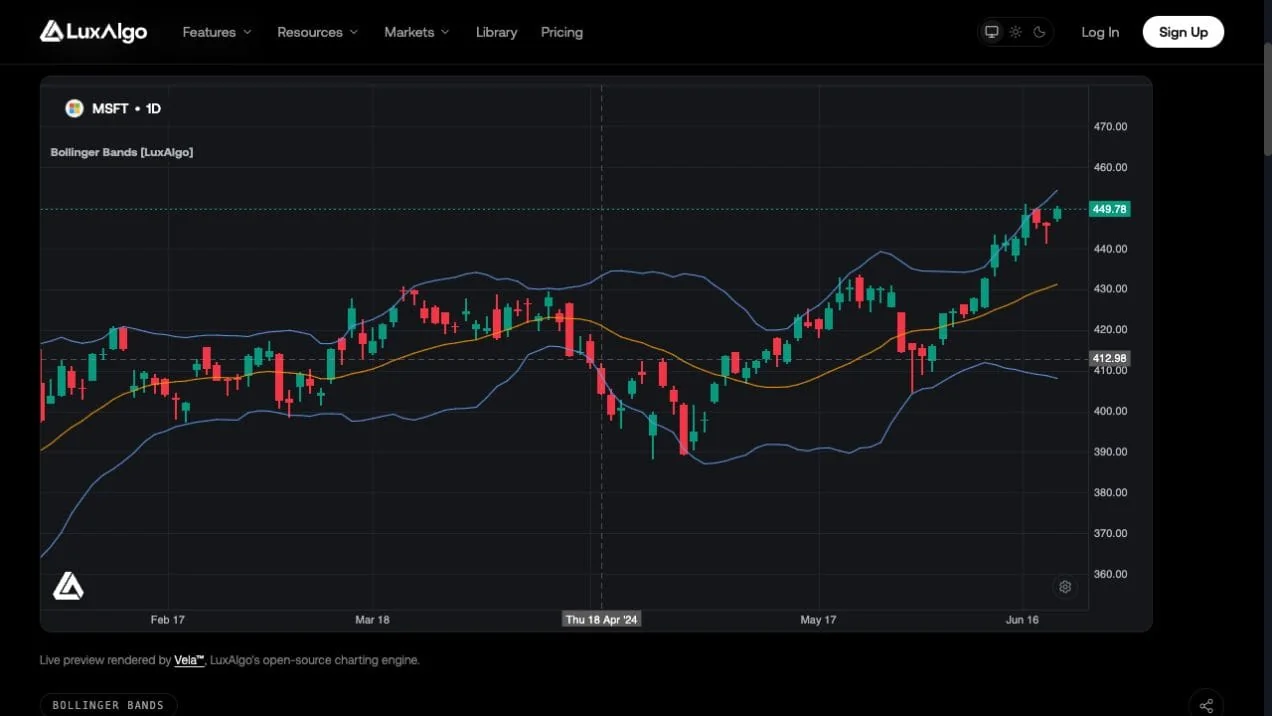
On Quant Charts, record the symbol, timeframe, session and indicator inputs before comparing candidates. Mark the range formed during compression. That range is a price-structure reference and need not coincide exactly with the moving bands.
Library trend, structure and momentum tools can add context on a Quant Chart, but their signals are not interchangeable with the standard Bollinger BandWidth test.
Trading the Surge Breakout
Breakout Direction Signals
Define the release before reviewing outcomes. One research variant requires a completed close above the upper band and above the squeeze-range high for a long candidate, or below the lower band and range low for a short candidate. Requiring BandWidth to expand can be an additional condition, but it must be specified rather than inferred after a successful move.
A strong candle, increased volume and a break through a meaningful level can support the reading. None establishes that a breakout is “genuine” with certainty at the time of entry. Price can return to the range or break in the opposite direction.
John Bollinger’s rules distinguish band touches from trading signals and describe closes outside the envelope as initially suggesting continuation rather than an automatic reversal. They also caution against normal-distribution assumptions: using two standard deviations does not establish a guaranteed 95% containment probability.
Spotting False Breakouts
A head fake is an initial release that fails and reverses. Specify a failure condition such as a close back inside the squeeze range, rather than labeling losing trades “false” only after seeing a later trend. Waiting for a second close or a successful retest changes entry timing and may miss trades; evaluate that tradeoff.
Volume can help judge participation, provided comparisons use the same feed and session. Volume Profile measures activity by price; decreasing volume bars during compression measure activity by time. They are related context, not the same confirmation signal.
RSI or MACD can supply momentum context. Both depend on price, so adding both does not create two independent confirmations. Compare the unfiltered strategy with each proposed filter and retain the simpler version unless the added condition has a defensible benefit on unseen data.
Trade Protection Methods
Choose an invalidation level and estimate per-unit risk before sizing the trade. A structural stop beyond the squeeze range and an ATR-based stop are different approaches. Neither should be selected solely because it permits a larger position.
For an entry-based ATR stop, a long uses entry − k × ATR and a short uses entry + k × ATR. Multipliers of 2, 2.5 or 3 are possible test inputs, not universal settings for “normal” versus “high” volatility. The following example assumes ATR is $2 and a $100 planned risk budget:
| Multiplier | Stop distance | Whole-share quantity before costs |
|---|---|---|
| 2 × ATR | $4.00. | 25 shares; $100 planned price risk. |
| 2.5 × ATR | $5.00. | 20 shares; $100 planned price risk. |
| 3 × ATR | $6.00. | 16 shares; $96 planned price risk. |
The same $4 stop with a hypothetical long entry at $104 and target at $112 offers $8 potential reward per share, or 2R before costs. If the stop at $100 fills at $98 after a gap, 25 shares lose $150 before costs. The stop level does not guarantee the fill or maximum realized loss.
An opposite-band stop is another possible rule, but bands move. For a long, the lower band may be the reference; for a short, the upper band. Record whether the initial value is frozen or updated, and recompute quantity from the actual distance. BandWidth alone is not a position-sizing formula.
Chandelier and Other Trailing Stops
A Chandelier-style exit subtracts an ATR multiple from a chosen high reference for a long, or adds it to a low reference for a short. Specify whether that reference is a rolling-window extreme or the extreme since entry; these implementations can produce different stops.
For a long with a high reference of $110, ATR of $2 and multiplier 3, the candidate level is $104. If ATR rises to $3 with the same high, the raw candidate drops to $101. A rule designed to tighten only would retain the existing $104 stop rather than widen it. Implement that behavior explicitly.
Moving a stop after a favorable two-ATR move is an optional management rule to test, not a guarantee of locked-in profit. Before major announcements, reassess exposure, spreads and gap risk. Widening an existing stop without reducing exposure increases planned risk and should not be presented as routine protection.
Step-by-Step Trading Guide
1. Find the Squeeze
Choose the market and timeframe, then fix the band inputs and a measurable squeeze definition. For example, a daily research test might use the classic 20/2 bands and a 125-bar BandWidth-low condition. A 125-bar window is only an approximation to six months of trading days and has a completely different duration on one-hour bars.
Decide how many compressed bars qualify, how to measure the squeeze range and when an unused setup expires. Preserve candidates that never release; reviewing only examples followed by large moves introduces selection bias.
2. Check the Setup’s Context
| Factor | Useful review | Avoid assuming |
|---|---|---|
| Volume | Compare compression and release activity on a consistent basis. | Every quiet period is accumulation or every volume spike confirms a trend. |
| Price location | Map range extremes and nearby support or resistance. | A nearby level automatically increases the chance of a profitable break. |
| Higher timeframe | Record whether the larger structure agrees or conflicts. | Agreement eliminates false signals. |
| Execution | Check spreads, liquidity, session and event exposure. | The backtest closing price will always be available live. |
3. Define the Entry and Manage Total Risk
Wait for the conditions your test actually requires. A close above the middle 20-period SMA is not a close beyond its upper two-standard-deviation band. For a close-based rule, model an entry only after the signal is known, using an appropriate subsequent execution assumption.
Divide the risk budget by entry-to-stop risk per unit and allow for costs. For contracts, include point value and minimum size. If scaling into a position, calculate total risk across all entries; a later confirmation does not justify unlimited additions.
Multi-timeframe review is useful when each chart has a defined role, such as daily context and one-hour entries. If the strategy consumes a higher-timeframe indicator, prevent it from using that bar’s final value before the higher-timeframe bar has closed.
4. Test the Rules with Quant
Ask Quant, our coding agent, to build a concrete experiment:
Create a Bollinger Squeeze strategy with configurable band length, standard-deviation multiplier and BandWidth lookback. Flag compression using only completed bars. Freeze the squeeze-range boundaries before evaluating a release, require an outer-band and range breakout, and expire unused candidates. Add configurable structural or ATR stops, risk-based sizing, commission, slippage and one-position limits. Log failures and compare optional volume or momentum filters with the baseline.
Inspect the generated code and run it manually using Making Strategies with Quant. Verify the window, percentage units, range boundaries and signal timestamps on several charts. The native strategy viewer helps inspect trades, win rate, profit factor and drawdown; a successful run does not prove the rules are profitable or correctly implement your intended setup.
Use an unseen period with settings fixed beforehand and report trade count, expectancy after costs and drawdown. Test both directions separately where applicable. Statements that a strategy “performs best” in a regime need a defined dataset and comparison, not just a few selected examples.
5. Configure the Specific Alert Event
The Bollinger Bands Library description lists outer-band crossing conditions. Those events do not automatically include your prior squeeze window, range break, volume filter or stop logic. Check which conditions the chosen edition exposes and verify the resulting notification against the chart.
Use a notification as a prompt to review the complete setup when it represents only one condition; analysis and alerts do not themselves execute orders.
Strategy Strengths and Weaknesses
| Potential strength | Practical limitation |
|---|---|
| Compression is measurable. | Low width does not predict the release’s direction or date. |
| Bands adapt as dispersion changes. | A move may already be extended when confirmation arrives. |
| Rules can be coded and compared. | Flexible definitions and repeated parameter tuning can overfit history. |
| The framework applies to multiple markets. | Results depend on the feed, liquidity, session, timeframe and costs. |
| Breakouts offer a clear hypothesis to invalidate. | Head fakes, gaps and whipsaws can produce repeated losses. |
Prepare for volatility expansion without assuming it will be profitable. Quiet markets can stay quiet; expansion can occur in both directions without developing into a trend. Reduce exposure when the calculated risk exceeds the chosen budget, and consider combined exposure across correlated positions rather than treating different tickers as independent diversification.
John Bollinger: Squeeze and Bulge
This interview provides additional background from the indicator’s creator. Use it alongside the written rules and the specific implementation you are testing.
Getting Started
Define the compression measurement, mark the range, choose a release rule and calculate risk before entry. Review the sequence on Quant Charts, test it with Quant and keep a record of failures as well as successes. Add filters only when they answer a specific question and improve the evidence behind the strategy.
FAQs
How can I tell if a Bollinger breakout is genuine or false?
You cannot know with certainty at the signal bar. Define a completed-bar breakout, then monitor a predeclared failure condition such as a close back inside the squeeze range. Volume, structure or a retest may support the setup, but can also delay entry and do not guarantee follow-through.
How does Bollinger BandWidth identify a squeeze?
BandWidth divides the distance between the upper and lower bands by the middle band. Multiply by 100 for percentage units. Compare that value with a defined historical window or percentile; an unusually low reading identifies compression rather than breakout direction.
Is crossing the 20-period SMA a Bollinger Band breakout?
No. The SMA is the middle band. With the standard construction, the outer bands are two standard deviations above and below it. A strategy requiring an outer-band close must test that outer level, not merely a moving-average crossover.
How is the classic squeeze different from TTM Squeeze?
The classic BandWidth approach looks for unusually low relative band width over a chosen history. The common TTM condition checks whether Bollinger Bands lie inside Keltner Channels. The definitions and parameters differ, so they need not flag the same bars.
How should I manage risk during a volatile breakout?
Choose an invalidation level, estimate entry-to-stop risk and size from a defined budget with costs included. ATR multipliers are test inputs, not guaranteed protection. Wider stops require less size to preserve planned risk, and gaps can produce losses beyond the budget.
How can I test the strategy using LuxAlgo?
Review bands and price structure on Quant Charts, then ask Quant to code explicit squeeze, release, expiry and exit rules. Inspect the code and run it manually. Verify signal timing and fills, include costs and failed candidates, and evaluate fixed settings on unseen data.
References
LuxAlgo Resources
- Bollinger Bands Concept and Formula
- Bollinger Squeeze Definitions
- Bollinger Bands Library Study
- Quant Charts
- Quant
- Making Strategies with Quant
- Native Strategy Viewer and Backtests
External Resources
Read next