Bollinger Bars Indicator: Visualizing Volatility in Price Bars
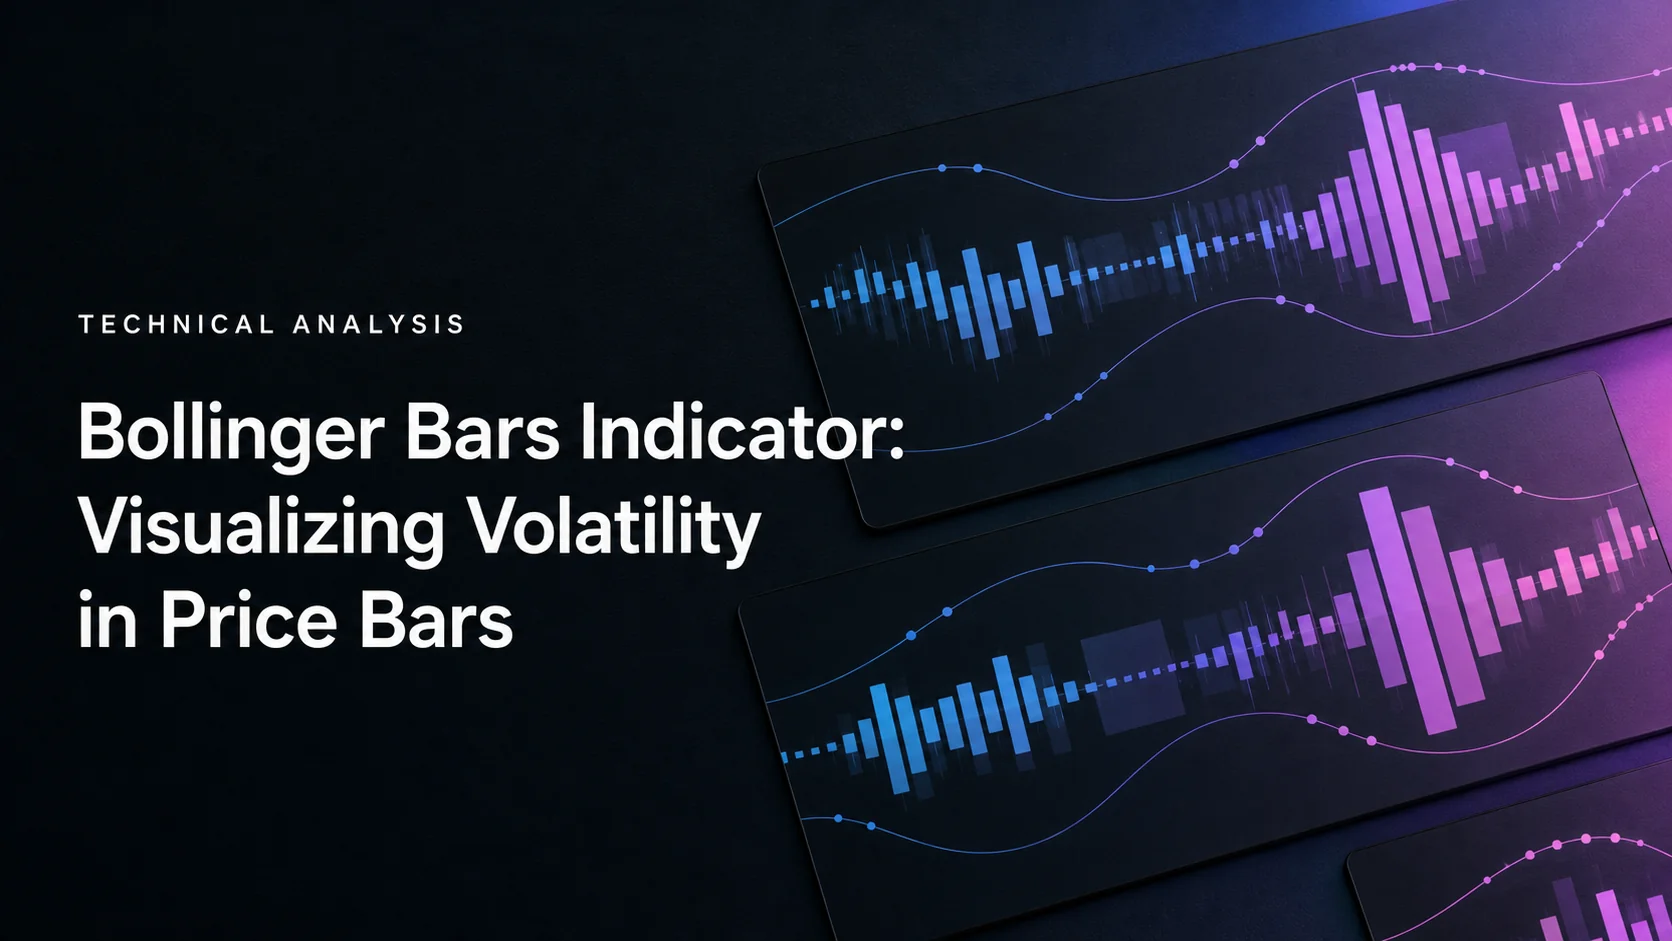
Bollinger Bars, developed by John Bollinger, redraw the open, high, low and close so the body and wicks have the same width. Green and red bodies show the relationship between close and open, while blue blocks emphasize the portions of the range above and below the body. This makes the full bar easier to see without adding new price information.
Bollinger Bars are different from Bollinger Bands and LuxAlgo’s Bollinger Bands Breakout Oscillator. Bars change the display of individual candles; Bands calculate an envelope from multiple prices; the oscillator summarizes a separate breakout calculation. Similar names do not make them interchangeable.
For a broader volatility workflow, use Quant Charts to inspect native Bollinger Bands and price data, and Quant, our coding agent, to help turn explicit range and band rules into a testable strategy.
How Bollinger Bars Work
TradingView’s official Bollinger Bars documentation describes an alternative candlestick display. It uses the same width for every component of a candle. Width does not expand or contract as a volatility calculation.
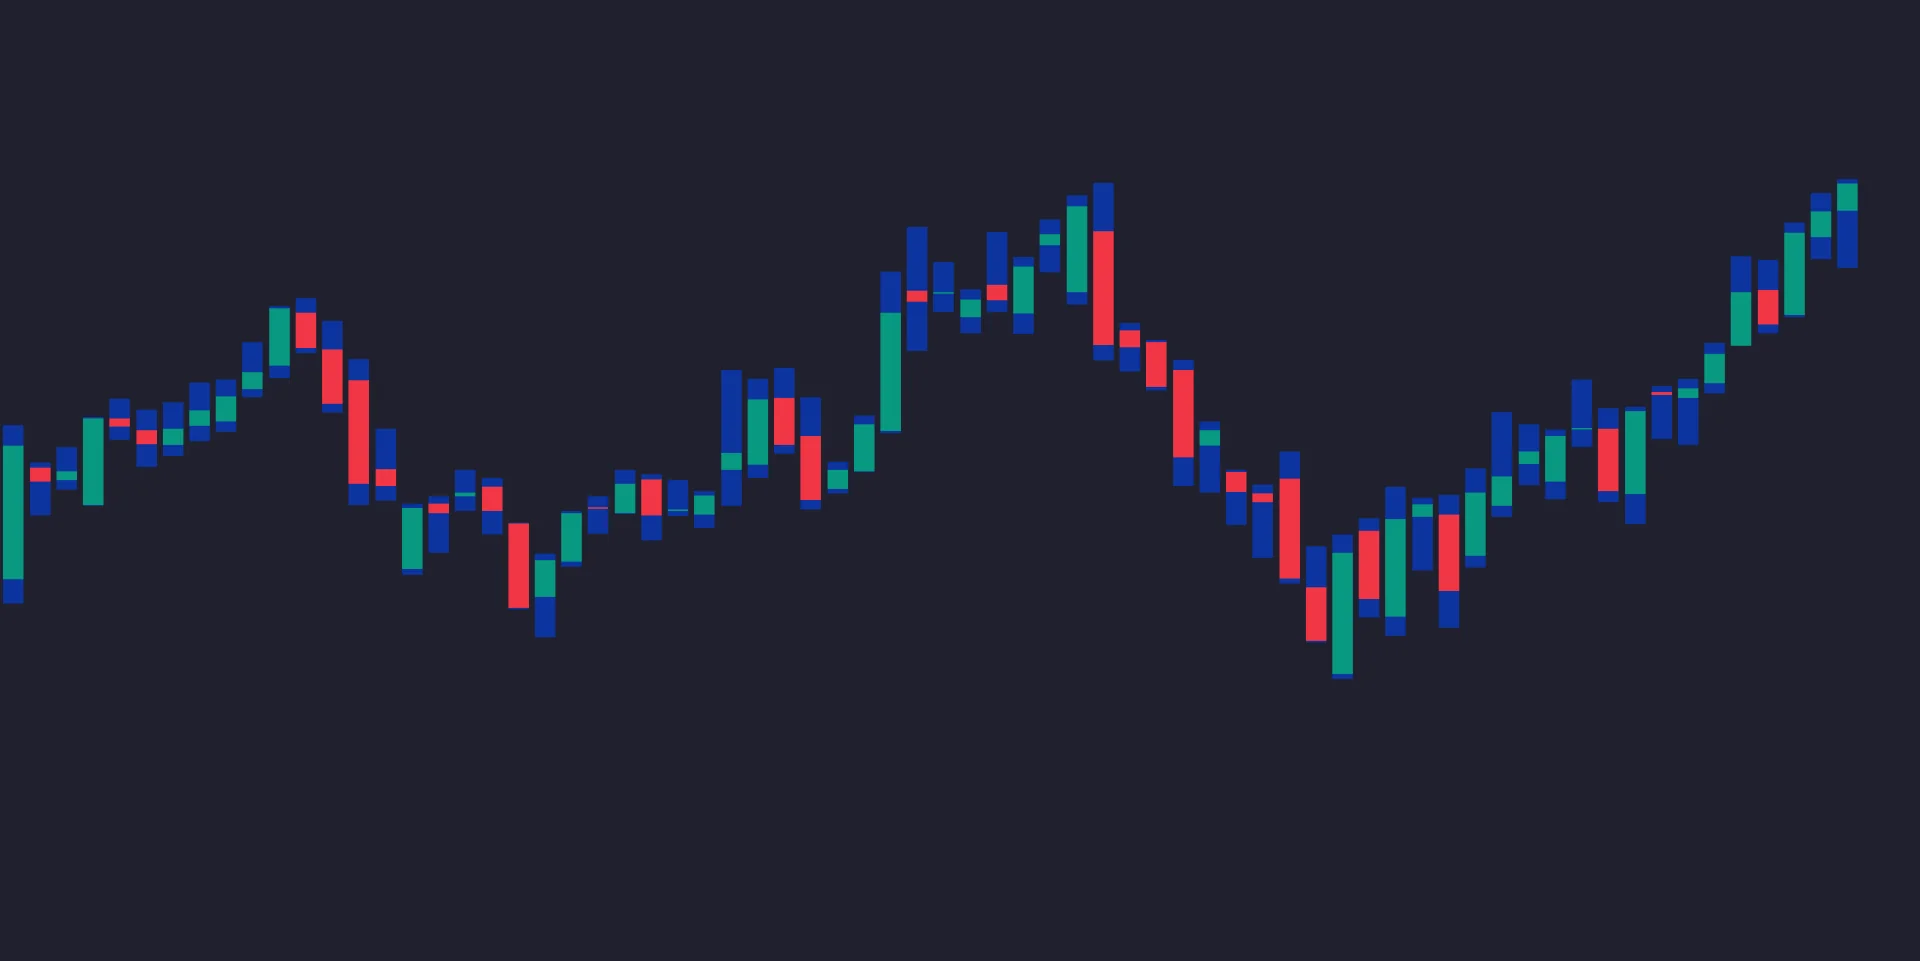
Main Parts of Bollinger Bars
- Body: the interval between open and close. A close above the open is green; a close below it is red under the documented coloring.
- Upper blue block: the interval from the higher of open or close to the high.
- Lower blue block: the interval from the low to the lower of open or close.
The overall height represents high minus low. A larger body can occupy most of that height, leaving little blue area. Conversely, a small body with long blue blocks describes substantial movement away from the open and close. Both the body and wicks matter.
Color compares the current close with the current open. A green body does not necessarily mean the price is above the previous close: the instrument could gap down and recover only part of the gap. The colors do not identify buyers, sellers or institutional sentiment.
How Bar Design Shows Range
Sequences of short or tall bars can help a trader notice compression and expansion. However, the blue blocks alone are not a complete volatility measure. A bar opening at $180, reaching $188 and closing at $188 with a low of $180 has an $8 body and an $8 range, despite having no upper or lower wick.
Compare like-for-like periods and a consistent price scale. A daily bar usually spans more activity than a five-minute bar, and zooming changes the apparent size of every bar. Relative range, a rolling range average or a percentage calculation can make a visual observation more explicit.
Large-range bars can cluster, but a cluster does not establish that a reversal is approaching. Trends can continue through elevated volatility. Narrow bars can persist, and compression alone supplies neither breakout direction nor a deadline for expansion.
Worked AAPL Example: Body, Wicks and Range
Consider a hypothetical AAPL bar with an open of $180.00, high of $185.50, low of $177.25 and close of $183.75. These figures illustrate the display; they are not a verified earnings-session record.
| Component | Calculation | Result |
|---|---|---|
| Green body | $183.75 − $180.00 | $3.75 |
| Upper blue block | $185.50 − $183.75 | $1.75 |
| Lower blue block | $180.00 − $177.25 | $2.75 |
| Full high–low range | $185.50 − $177.25 | $8.25 |
| Range relative to open | $8.25 ÷ $180.00 | About 4.58% |
The two blue blocks total $4.50, not $8.25. Adding the $3.75 body gives the full range. If subsequent bars have smaller ranges, that records less intrabar movement; it does not guarantee that uncertainty has ended or that the next earnings-related move will be small.
A gap adds another distinction. If the previous close were $170, this bar’s true range would be $15.50, the maximum of high minus low, absolute high minus previous close and absolute low minus previous close. Its displayed high–low range remains $8.25. An ATR calculation incorporates true range across bars; Bollinger Bars do not replace it.
Bollinger Bars vs. Bollinger Bands
Main Differences
| Feature | Bollinger Bars | Bollinger Bands |
|---|---|---|
| Input | One bar’s open, high, low and close | A rolling source series, average and standard deviation |
| Display | Equal-width body and wick components | Upper and lower bands around a basis |
| What changes | Component heights as OHLC develops | Basis and band separation as the sample changes |
| Typical question | How much of this bar’s range is body or wick? | Where is price relative to its recent mean and dispersion? |
| What it does not establish | Overbought/oversold status, participant intent or future direction | A guaranteed reversal, breakout success or fixed probability envelope |
With the classic 20-period, two-standard-deviation construction, the basis is a simple moving average and the bands are basis plus or minus twice the standard deviation of the selected source. Other implementations can expose different settings, so record the actual inputs.
For example, a basis of $180 and standard deviation of $2 give an upper band of $184 and lower band of $176. A $183.75 close has %B = ($183.75 − $176) ÷ ($184 − $176) = 0.96875. Bandwidth relative to the basis is $8 ÷ $180, or approximately 4.44%. %B describes price position; Bandwidth describes separation. Neither is the width of a Bollinger Bar.
John Bollinger’s guidance treats band tags as observations rather than standalone buy or sell signals. Price can travel along a band during a trend. The usual 20/2 settings do not guarantee that 95% of future prices will stay inside the envelope.
Using Both Tools Without Double-Counting Evidence
Bands can provide a rolling volatility context while Bars emphasize each candle’s body and wick structure. A narrow band envelope followed by a larger completed bar may be a useful event to investigate, but both observations come from price. Their agreement does not independently prove that the breakout will persist.
For a breakout study, define the squeeze threshold, reference range, required close and entry timing. For a reversion study, define the stretch, return inside the band, target and failure condition separately. Shrinking blue blocks alone cannot confirm exhaustion: a strong directional body can have very small wicks.
These displays concern realized price behavior. An options position also depends on implied volatility, time decay, strike, expiry and other factors. A visually quiet stock chart is not by itself evidence that an option is cheap.
Market Scenarios: Equities, Forex, Crypto and Futures
For an equity such as TSLA, a period near a lower band can motivate a reversion hypothesis, while a later large body can describe expansion. This is a hypothetical sequence. Test both continuing declines and rebounds with the same entry rules; a lower-band observation alone cannot choose between them.
For EUR/USD, a hypothetical move from 1.0500 to 1.0650 is 150 pips under the usual 0.0001 pip convention. A policy announcement can be part of the event context, but those numbers should not be attributed to a specific FOMC decision without verified market data. Spreads and execution conditions can also change around announcements.
For BTC, a hypothetical consolidation around $29,000 can illustrate range measurement. It does not establish the direction of the eventual breakout. Record the exchange, timeframe and UTC or local session convention; a 24/7 market does not have the same opening structure as a listed equity.
For ES futures, distinguish the 9:30 a.m. Eastern regular U.S. equity open from the futures trading session. The equity open can be an event filter within an already trading futures market. Compare comparable intervals rather than assuming an overnight squeeze must resolve at that time.
Trading Strategies with Bollinger Bars
Accumulation and Distribution: Context, Not Proof
Small ranges, repeated boundary tests and a subsequent expansion can help organize a price-action hypothesis. They do not establish who accumulated a position or whether a sell-off is imminent. Fixed-width bars cannot narrow to reveal buying or widen to reveal selling.
If using a range-based model, write the range duration, maximum height, boundary-breach rule and confirmation requirement. Include ranges that persist and breakouts that fail. Restricting analysis to completed textbook sequences creates hindsight bias.
Trend Reversals and Volatility Surges
A larger range shows that more movement occurred within the bar. Direction comes from the specified price condition, such as a close beyond a previous high, not from blue-block expansion alone. A long upper wick can coexist with a bearish close; a small wick can accompany a strong bullish body.
Require completed data when the strategy is defined on closes. A bar’s high, low and body can change before it closes. A higher-timeframe filter must likewise use the information available at the decision time, not the eventual finished candle.
Combining Bollinger Bars with LuxAlgo Tools
On a Quant Chart, the Library’s market-structure tools add structure and zone context, trend tools supply their own calculations, and momentum and money-flow tools cover divergence. Bollinger Bars themselves are a TradingView display; on LuxAlgo, pair those tools with the native Bollinger Bands study instead.
A contraction near a structure zone is a condition to evaluate, not a certified high-probability setup. Nor does placing two indicators on the chart automatically make one read the other’s values. Check the inputs available to the specific alert, screener or backtester before claiming it can scan a custom Bollinger Bars pattern.
Using the LuxAlgo Platform for Volatility Research
Choose the Correct Library Tool
The native Bollinger Bands implementation on Quant Charts supplies Bands, %B and Bandwidth display modes, with Length, Source and Multiplier controls. Its documented defaults are 20, close and 2.0. This is the statistical envelope, not the equal-width Bollinger Bars display.
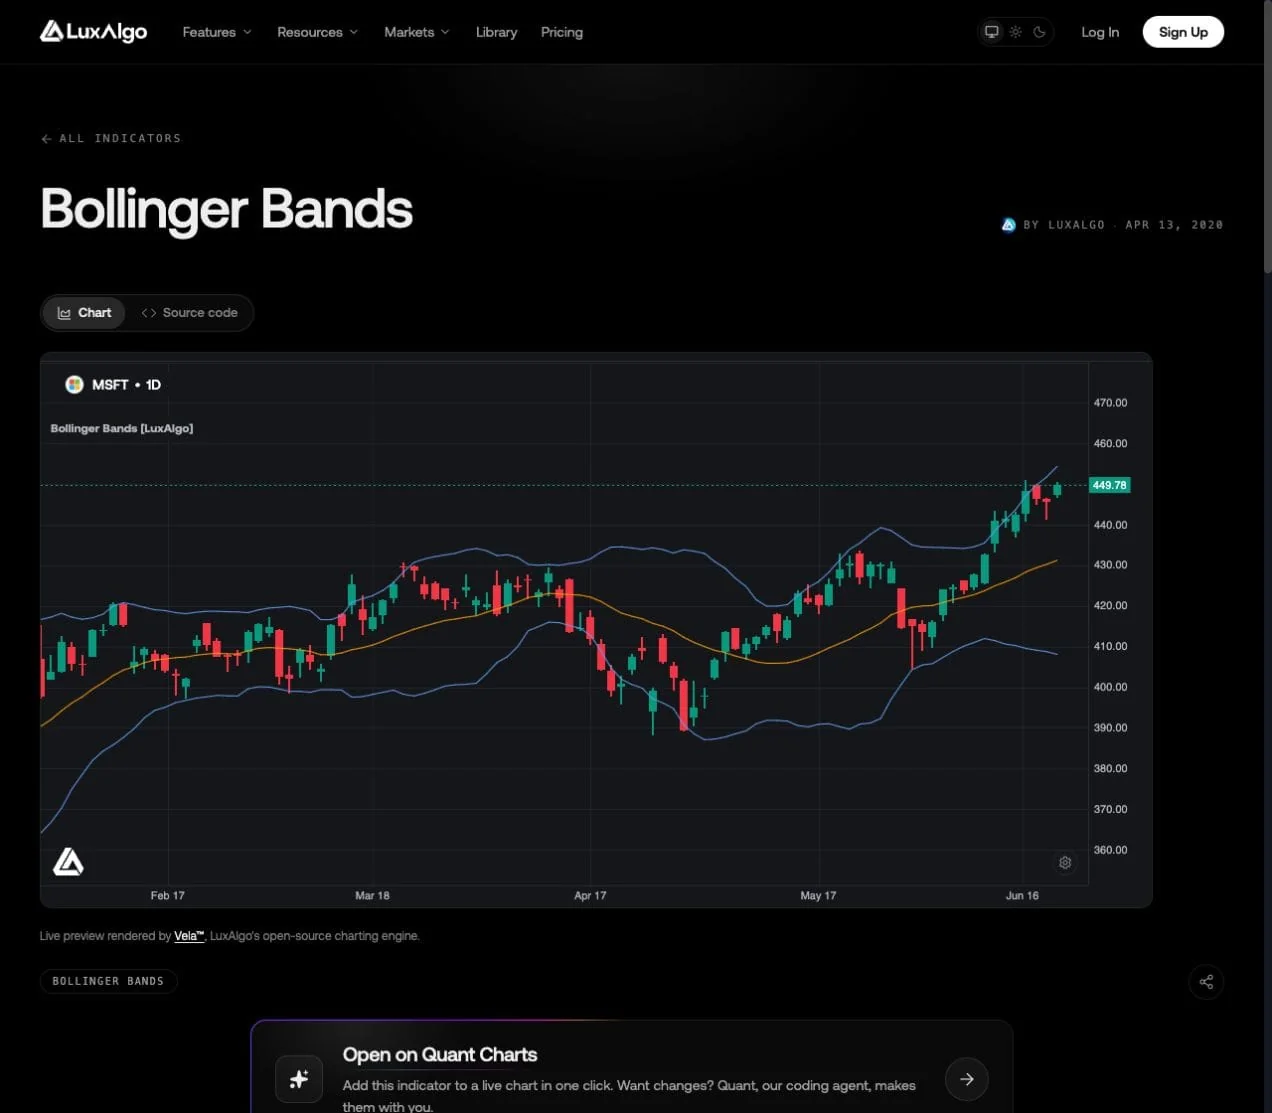
The Bollinger Bands Breakout Oscillator is another separate LuxAlgo indicator. It evaluates breakout behavior rather than changing the body and wick display. Native Library availability also does not imply that every tool has matching NinjaTrader, MetaTrader or thinkorswim versions.
Keep Chart Workflows Explicit
Start with one instrument and timeframe. Record the session, feed, price adjustment and band settings. Then add only the context required by the hypothesis. More panels do not necessarily provide more independent information.
The Quant Charts demonstration below shows adding indicators to a chart. Use it for the native workflow; it is not a demonstration of installing TradingView’s Bollinger Bars.
Build and Test Explicit Rules with Quant
Ask Quant to help implement measurable OHLC conditions, such as range relative to the open, body-to-range ratio and a close beyond a band. Inspect Code, then click Run. Follow Making Strategies with Quant and the native backtest guide. Verify runtime support rather than assuming a visual chart style is available as a strategy input.
Strategy alerts fire on an explicit condition; an alert is a notification, not an execution or a fill.
Define signal time, entry order, stop, target, expiry and position sizing before testing. Use chronological development and untouched evaluation periods, allow for costs, and compare nearby settings. Record failed breakouts as well as successful ones. Community examples can suggest hypotheses, but their screenshots are not your verified performance record.
Worked Risk Example: The Fill Changes the Trade
Suppose a completed volatility condition permits a hypothetical long entry at $184, with a stop at $179 and target at $194. For a $20,000 account using an illustrative 0.5% planned price-risk budget, the budget is $100.
| Item | Calculation | Result |
|---|---|---|
| Planned size | $100 ÷ ($184 − $179) | 20 shares before cost allowance |
| Notional exposure | 20 × $184 | $3,680 |
| Target reward | 20 × ($194 − $184) | $200, or 2R gross |
| Stop fills at $178 | 20 × ($184 − $178) | $120 loss, or 1.2R |
| Entry instead fills at $186 | $100 ÷ $7, rounded down | 14 shares; $98 planned risk |
| Later entry reward | 14 × ($194 − $186) | $112, or about 1.14R |
A larger bar can move the entry far enough to change both quantity and reward-to-risk. Recalculate from the actual permitted fill rather than retaining an attractive ratio from an earlier chart price. Keep room for transaction costs within the chosen budget.
As Investor.gov explains for order types, a stop price is not a guaranteed execution price. Gaps, liquidity and order mechanics matter. The display itself cannot limit a loss.
At a 40% win rate with average winners of 2R and average losers of 1R, gross expectancy is 0.40 × 2R − 0.60 × 1R = +0.20R. Average costs of 0.10R reduce it to +0.10R. Use realized outcomes, not only the nominal target, and inspect drawdowns and sample size.
TradingView Tips: Setting Up Bollinger Bars
TradingView documents Bollinger Bars under Built-in Indicators. Search for the exact name in the indicator selector and distinguish the built-in tool from similarly named community scripts. Inspect its appearance and the underlying OHLC values before combining it with other indicators.
The setup video concerns TradingView’s Bollinger Bars. Product labels and menus can change; the official help page is the reference for the bar construction.
Conclusion: Make the Visual Observation Measurable
Bollinger Bars emphasize the components of each price bar. They can make wicks easier to see, but they do not add information, identify overbought conditions on their own or guarantee better timing.
Begin with one or two instruments, compare Bars with the original OHLC values and define the observations you intend to trade. Use native Bands and Quant on LuxAlgo for a documented research workflow, while keeping external chart displays distinct. Paper trading can help check the process before risking capital, although simulated fills may differ from live execution.
FAQs
Do Bollinger Bars change width when volatility rises?
No. The documented display uses the same width for the candle body and wicks. Their heights follow the open, high, low and close; overall height shows the bar range.
Do the blue blocks show the entire high–low range?
Not by themselves. They show the portions above and below the body. Add the body height to both wick heights to obtain the full range.
Are Bollinger Bars the same as Bollinger Bands?
No. Bars change how individual OHLC candles are drawn. Bands calculate an envelope around a rolling average using standard deviation. The Bollinger Bands Breakout Oscillator is a third, separate tool.
Can Bollinger Bars identify overbought or oversold markets?
The display has no standalone statistical overbought or oversold threshold. Define a separate indicator or price rule, and do not treat an extreme reading as a guaranteed reversal.
How can LuxAlgo support a Bollinger Bars research workflow?
Use native Bollinger Bands and price data on Quant Charts, then ask Quant to help implement explicit OHLC and band conditions. Inspect Code and click Run. TradingView’s Bollinger Bars remain a separate display.
Does combining Bars and Bands guarantee better trades?
No. Both use price data, and agreement can be redundant. Evaluate explicit rules after costs, include failed signals and test on data not used to choose the settings.
References
LuxAlgo Resources
- Quant Charts
- LuxAlgo Quant
- Native Bollinger Bands
- Bollinger Bands Breakout Oscillator
- Making Strategies with Quant
- Native Backtest Guide
External Resources
Read next