Candle Formations Every Scalper Should Know
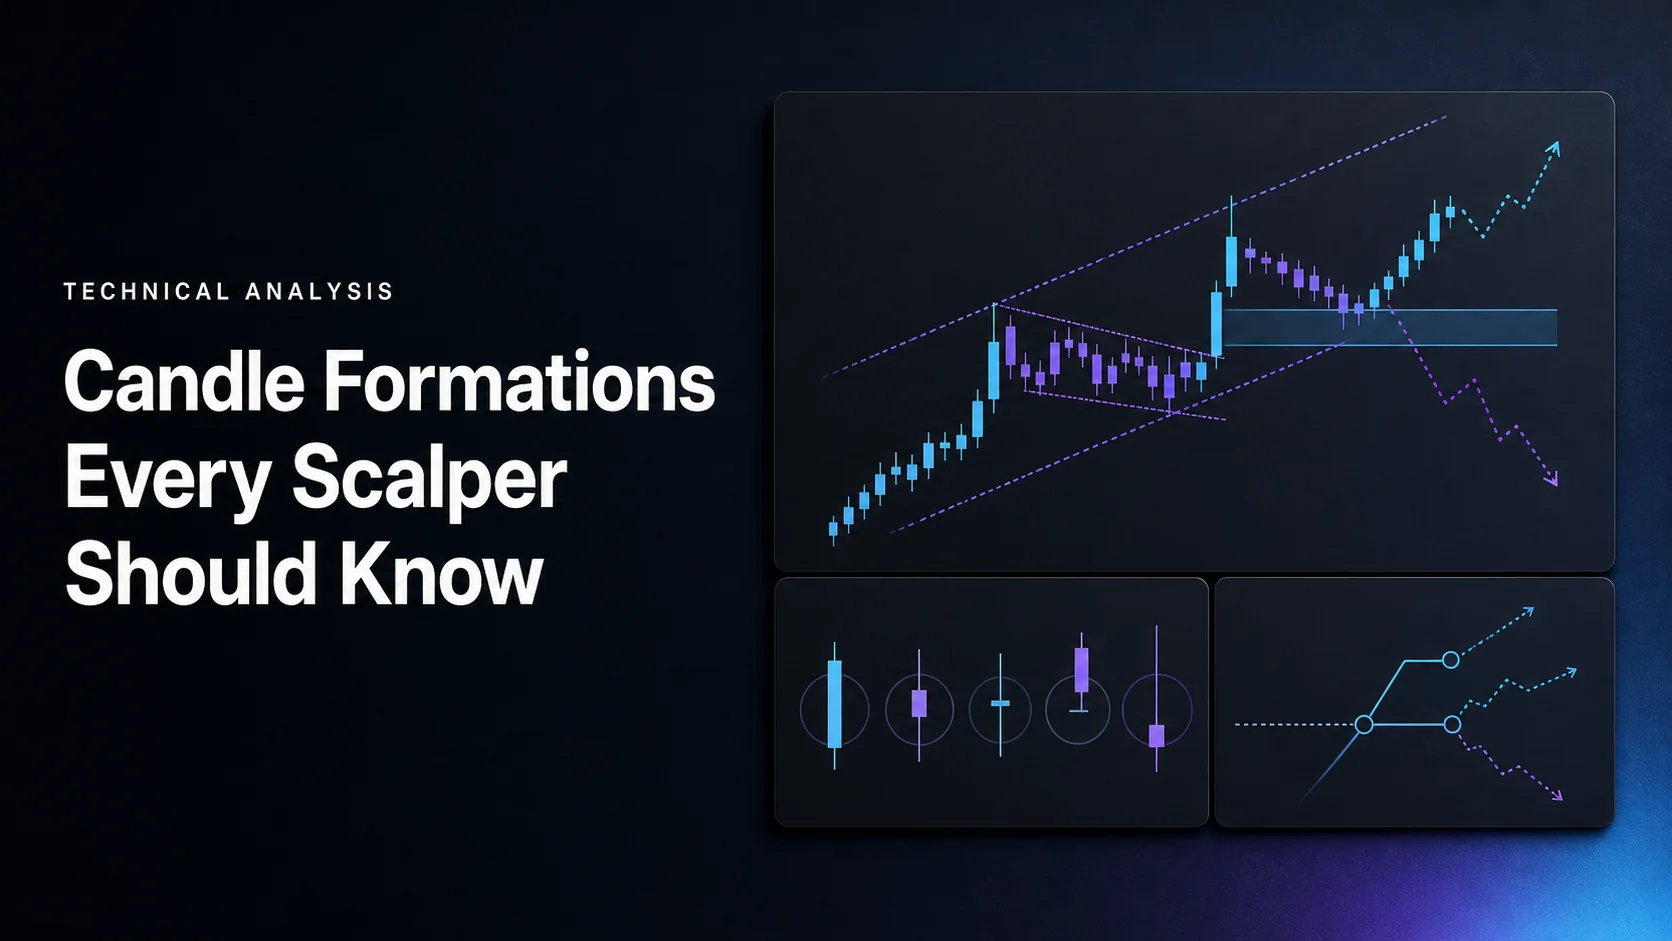
Candlestick formations give scalpers a compact way to describe recent price behavior. A doji, engulfing candle or hammer can become part of a trading rule, but the shape alone does not establish a profitable entry. The market context, execution costs, exit and position size still matter.
Use LuxAlgo’s native charts and Quant, our coding agent, to make a pattern rule precise and test it. Start with a formation you can define consistently rather than treating every visually similar candle as the same setup.
Read the Candle Before Naming the Pattern
A standard candlestick summarizes the open, high, low and close for its interval. The body spans the open and close, while the wicks show price extremes outside that body. Colors are configurable; check which color represents a close above or below the open.
A long upper wick shows that price traded above the body and did not close at that high. It does not prove that profit-taking caused the move. Likewise, a lower wick does not reveal the identity or intentions of the traders involved. Candles summarize prices, not every order or participant’s motivation.
Use standard price candles when evaluating execution prices. Synthetic chart types can display prices that would not have been available for an actual fill.
Five Pattern Groups to Recognize
| Formation | Visual definition | Context to evaluate |
|---|---|---|
| Doji | Open and close are equal or very close relative to a defined tolerance | Prior movement, range and what happens after the candle completes |
| Engulfing | A second, opposite-direction body contains the preceding body | Prior trend and the exact body-boundary rules used |
| Hammer family | Small body near one end of the range with a prominent opposite wick | Whether the formation follows a rise or decline |
| Morning or evening star | Three candles: strong directional body, small middle body, then an opposite body returning into the first | Gap requirements, penetration threshold and prior trend |
| Three black crows | Three substantial bearish bodies closing progressively lower and near their lows | Prior rise, opening positions and whether the move is already extended |
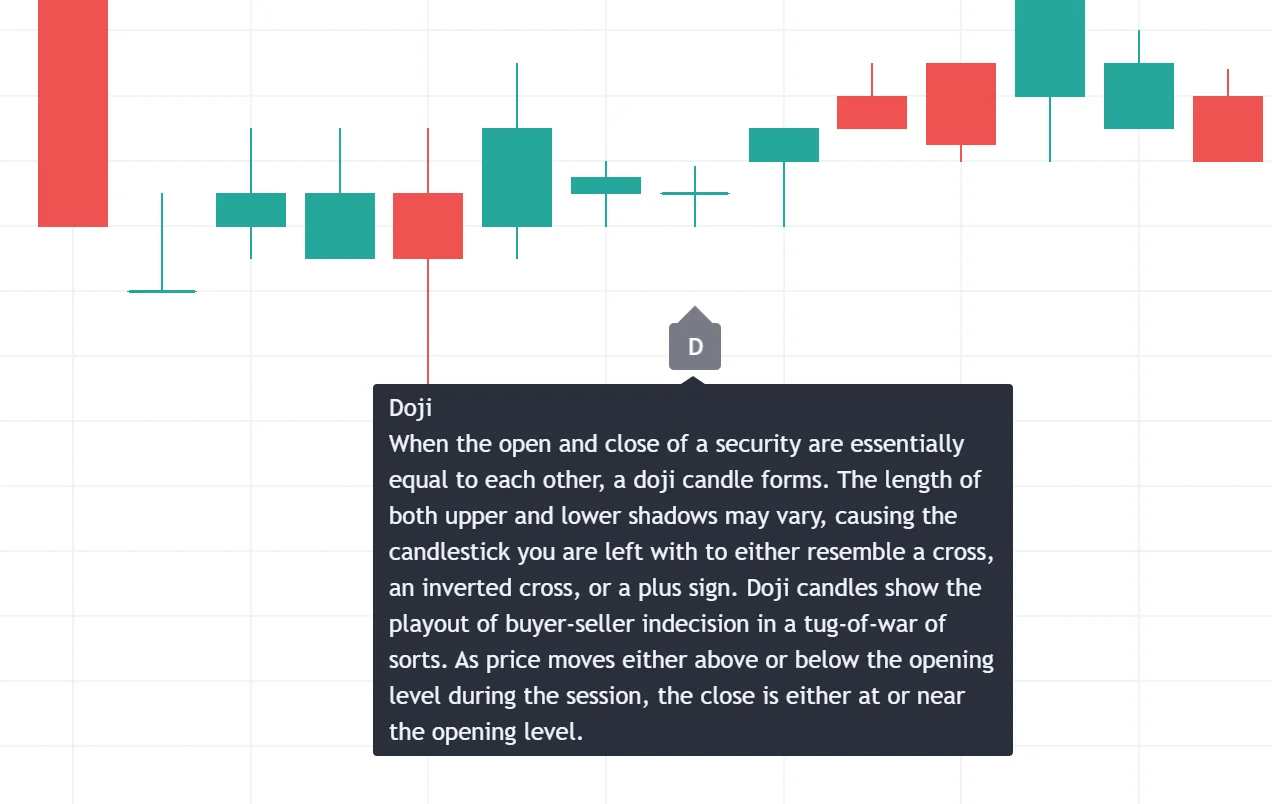
Doji: small net change does not mean no movement
A doji can have a small or nearly absent body despite a substantial high–low range. A dragonfly form has a prominent lower wick; a gravestone has a prominent upper wick; a long-legged doji has substantial wicks on both sides. These describe shape, not guaranteed bullish or bearish outcomes.
For testing, define “near the open” numerically. You might compare absolute body size with the candle’s range, while specifying a minimum range and handling zero-range candles. Those choices affect how many patterns are detected.
Engulfing: compare bodies, not necessarily the full ranges
A bullish engulfing formation has a bullish second body covering the preceding bearish body. A bearish engulfing formation reverses those directions. The second candle does not need to contain every wick of the first unless your chosen definition explicitly requires an outside bar.
Specify whether equality at a body boundary counts. Also define the prior trend and wait for the second candle to finish if the rule uses completed candles. A forming body can shrink or change direction before the close.
Hammer and related shapes: location changes the interpretation
A hammer typically has a small body near the top of the range, little upper wick and a long lower wick after a decline. A lower wick around twice the body is a common descriptive guideline, not a law that guarantees reversal. A similar shape after an advance is usually called a hanging man.
An inverted hammer after a decline and a shooting star after an advance have prominent upper wicks. Keep the shape and preceding context separate in the detection rule. Do not assign direction solely from the candle’s color.
Morning and evening stars: define all three candles
A morning star follows a decline: a substantial bearish candle, a small middle body and a bullish third candle closing back into the first body. An evening star is the bearish counterpart after an advance. State how far the third close must penetrate the first body.
Traditional definitions include gaps around the middle candle. Continuously traded markets may rarely produce those gaps, so any relaxed version should be labeled and tested as a modified definition rather than silently treated as identical.
Three black crows: more than three red candles
The formation commonly follows an advance, with three bearish candles that close progressively lower and near their lows. The second and third candles open within the preceding bodies. Three small red candles scattered through sideways trading do not automatically meet that description.
Historical pattern classifications are not scalping win rates. A study counting reversals or breakouts may use a different timeframe, sample and outcome definition from your proposed entry and exit. Test the actual trading rule after costs instead of importing a headline “success rate.”
Select a Timeframe You Can Test and Follow
One-minute, five-minute and fifteen-minute charts aggregate different amounts of price activity. None is universally best. A shorter interval may create more observations and execution demands, while a longer interval changes the formation and its risk distance.
If a higher-timeframe trend filter is part of the rule, specify whether that bar must be complete. Using the eventual close of an unfinished higher-timeframe candle would introduce information that was not available at the entry time. Retail scalping on a short chart is also different from institutional high-frequency trading infrastructure.
Turn the Formation into an Entry and Exit Rule
A pattern label is only one component of a strategy. Define the prior trend or location, the completed formation, entry timing, invalidation, exit and maximum position risk.
Illustrative research specification: detect a bullish engulfing body after a defined decline, evaluate it only once the second bar has closed, and simulate an entry at the next bar’s open. Place the planned invalidation below the two-bar low using a specified buffer, and define a target or time exit before running the test. Resolve position sizing and costs before treating the specification as complete.
The stop distance determines part of the position-sizing calculation. A wider pattern usually requires a smaller position to keep the same planned monetary risk. Stops can fill worse than expected, especially during gaps or thin liquidity, so the estimate is not a guaranteed loss cap.
Use Volume as a Testable Condition
Volume can describe participation, but high volume does not guarantee continuation or reversal. It may accompany either an expanding move or exhaustion. There is no universal rule that an engulfing pattern becomes highly reliable at two or three times average volume.
If you test relative volume, define the comparison: for example, completed-bar volume divided by the average of a specified number of preceding bars. Consider whether intraday seasonality calls for a same-time-of-day comparison. Confirm whether your feed reports exchange volume, tick activity or another proxy.
Compare the pattern strategy with and without the filter. Record the effect on trade count, average trade after costs and drawdown. A filter that removes losing trades in one period may also remove useful opportunities elsewhere.
Identify Patterns with the Right LuxAlgo Tool
The Candlestick Structure indicator is a separate Library tool that detects sixteen named formations and filters them using a selected major-trend method. Its methods include Supertrend, EMAs, ChoCh and Donchian Channel. Its alignment dashboard measures agreement with the trend, not a probability of a winning trade.
The documented list includes formations such as engulfing candles, hammers, stars and three black crows. It does not list doji among the sixteen patterns. For a doji rule, ask Quant to implement your explicit body tolerance and context requirements rather than assuming every pattern detector covers it.
Test the Whole Strategy with Quant
- Write a precise definition. Include body and wick measurements, trend conditions and completed-bar timing.
- Review the generated code. Ask Quant to identify ambiguous assumptions and inspect plotted detections against the chart. Check that no future information is used.
- Set execution and risk assumptions. Define entry timing, size, stops, exits, commission and slippage. Chart detection is not broker execution.
- Inspect the results. Review individual trades, net profit, drawdown, average trade and trade count, not just how often the pattern appears.
- Evaluate another period. Keep track of parameter trials and test the selected rule on data that was not used to choose it.
Paper trading can help evaluate the operating workflow, but simulated fills do not reproduce every live execution condition. Use the LuxAlgo Journal for recorded trades and notes, with a separate log for qualifying patterns that never became trades.
Choose a small set of definitions you understand, test them with realistic costs, and review whether you followed the rules. The value of candlestick analysis is a clear description that can be evaluated—not a shortcut around risk management.
FAQs
How can I use doji and engulfing patterns in scalping?
Define the pattern precisely, evaluate it after the required candles complete, and combine it with explicit entry, exit and risk rules. A doji describes a small difference between open and close; an engulfing pattern compares consecutive bodies. Neither guarantees a reversal or a profitable trade.
Does higher volume confirm a candlestick pattern?
Higher volume adds information about activity, but it does not guarantee the pattern’s direction or profitability. Define the volume source and comparison period, then test whether the filter improves the complete strategy after costs. Avoid treating a fixed volume multiple as universally reliable.
How can LuxAlgo help test candlestick strategies?
Use native charts to inspect formations, the Candlestick Structure Library indicator for its supported patterns, and Quant to implement a clearly defined strategy. Review the code, timing, costs and individual trades before evaluating another period. Pattern detection and trend alignment are not trade-success probabilities.
Read next