Chart Pattern Primer - From Triangles to Pennants

Triangles and pennants organize a narrowing price range into levels you can monitor. A triangle is defined mainly by its converging boundaries. A pennant adds a specific context: a sharp directional move, or flagpole, followed by a relatively compact coil. Neither shape guarantees the next move.
This primer covers ascending, descending and symmetrical triangles, bullish and bearish pennants, measured targets, entry choices and failure rules. Use LuxAlgo’s charting and AI platform to inspect the structure on Quant Charts and work with Quant, our coding agent, to turn the observations into testable conditions.
Triangles and Pennants at a Glance
| Aspect | Triangles | Pennants |
|---|---|---|
| Structure | Two converging boundaries; one can be approximately horizontal | A compact converging coil following a sharp flagpole |
| Context | May continue a trend or develop into a reversal | Traditionally a continuation setup, but it can fail |
| Duration | Often weeks to months on daily charts | Often one to four weeks in traditional daily-chart descriptions |
| Volume | Contraction during formation and expansion on the break are common guidelines | Activity often expands on the pole, contracts in the coil and expands on the break |
| Basic measured objective | Project the triangle’s widest height from the break | Project the flagpole height from a stated breakout reference |
Duration is a classification convention, not a clock that forces a breakout. On intraday charts, describe the structure in bars as well as elapsed time. A 15-bar coil on a five-minute chart and a 15-bar coil on a daily chart are different market situations.
Triangle Patterns
Ascending Triangle Analysis
An ascending triangle has repeated highs near a horizontal resistance zone and successively higher reaction lows. The rising lower boundary narrows the available range. The highs need not match to the cent, but use a consistent tolerance rather than redrawing the level around inconvenient candles.
Traditional analysis assigns the shape a bullish bias. It often appears as an uptrend continuation, although it can also develop near the end of a decline. That bias is a hypothesis: the overhead level still has to break, and the rising support can fail first.
Look for at least two separated reaction highs near resistance and two higher reaction lows, then inspect the intervening price action. The StockCharts ascending-triangle guide explains the structure, breakout and height-based projection. Volume expansion can add context, but it is not a guarantee that the break will hold.
Descending Triangle Analysis
A descending triangle has repeated lows near horizontal support and successively lower reaction highs. Its upper boundary slopes downward toward support. The traditional bearish bias reflects weaker rebounds; it does not establish that support must break.
For a bearish continuation model, require the chosen close or price filter below support. A move above the descending boundary may invalidate that model instead. The StockCharts descending-triangle guide describes the corresponding support break and downside height projection.
A retest of broken support as resistance can offer another entry model, but it may never occur or may reclaim the level. Record the retest window and failure rule before evaluating outcomes.
Symmetrical Triangle Analysis
A symmetrical triangle combines lower highs with higher lows. The lines converge, but they do not need exactly equal slopes or a perfectly balanced appearance. At least two highs and two lows are needed to draw the boundaries; more distinct touches can make the chosen structure easier to assess.
The direction remains unresolved until the defined break occurs. A preceding trend supplies context, but triangles can resolve against it. Do not enter solely because the outline resembles a historical winner.
The StockCharts symmetrical-triangle discussion attributes an approximate 75% continuation observation to Edwards and Magee. That historical statement is not a current win rate, a target-hit probability or evidence that an arbitrary triangle strategy wins three trades out of four.
| Triangle type | Boundary geometry | Condition to distinguish |
|---|---|---|
| Ascending | Approximately flat highs and rising lows | Bullish bias versus an actual resistance break |
| Descending | Approximately flat lows and falling highs | Bearish bias versus an actual support break |
| Symmetrical | Falling highs and rising lows | Prior trend versus the direction of the eventual break |
Interpret the Apex and Breakout Timing
The apex is the projected intersection of the boundaries. Traditional symmetrical-triangle guidance often favors a break about halfway to three-quarters through the base-to-apex span. Treat that as a filter to define and test, not a rule that every valid pattern obeys.
As the boundaries converge, a tiny move can cross one simply because the range has become narrow. A late crossing near the apex is not automatically a powerful breakout. Nor is “near the apex” a universal requirement for a pennant.
State whether the trigger is an intrabar breach, a completed close, a percentage buffer or a sustained break. Each changes entry timing and the number of false starts. Use the boundary value at the trigger bar rather than assuming a sloped trendline is a fixed price.
Pennant Patterns
Trading Bullish Pennants
A bullish pennant begins with a sharp advance, followed by a smaller converging consolidation. A continuation model looks for a qualifying break through the upper boundary in the pole’s direction. The pole is essential: a small triangle without that preceding impulse is not automatically a pennant.
Possible entry models include the breakout close, the next bar’s open after a qualifying close, or a subsequent retest. Choose one and measure risk from the actual fill. A stop below the coil or a retest low tests different invalidation conditions; neither placement makes losses impossible.
A common objective adds the pole’s height to the selected breakout reference. The result is a planning level rather than an expected return. Nearby resistance, a late entry or a wide stop can make the available reward less attractive than the pattern drawing suggests.
Trading Bearish Pennants
A bearish pennant follows a sharp decline and a compact coil. Its continuation trigger is a qualifying close below the lower boundary. A stop above the coil or retest high may fit the hypothesis, while the basic downside objective subtracts the pole’s height from the chosen breakout reference.
Do not call a stop placed arbitrarily near the apex “aggressive” and assume that means efficient risk. A stop inside ordinary price fluctuation can increase stop-outs. Select an invalidation rule first, then adjust size to the resulting distance.
For equity shorts, also account for borrow availability, borrow costs and margin. For futures or derivatives, convert price distance using the contract specification. An indicator target is not a broker order.
Key Differences Between Pennants and Flags
Pennants narrow between converging boundaries. Flags consolidate between approximately parallel boundaries, often sloping against the pole. Both require the prior impulse in the classical continuation interpretation; a compact rectangle without that context should not be labeled a flag merely because two lines fit.
The StockCharts flag-and-pennant guide discusses one-to-four-week formations as an ideal daily-chart convention while acknowledging longer and disputed cases. A pennant lasting more than roughly 12 weeks is commonly reclassified as a symmetrical triangle. Those labels do not supply a mechanical reliability cutoff for every market or timeframe.
Triangles vs. Pennants: A Recognition Process
- Identify the prior move. Was there a distinct directional impulse, or only an ordinary range?
- Check the boundaries. Are they converging, parallel or too irregular to classify consistently?
- Measure scale. Record the coil’s bars, height and retracement relative to the preceding move.
- Separate a forming outline from a completed break. Keep rejected and failed patterns in the review.
- Define volume evidence. Identify the feed, session and comparison window rather than relying on the appearance of a single bar.
Volume over time and volume profile answer different questions. Candle volume compares activity from bar to bar; volume profile groups activity by price. A large profile node does not establish that breakout volume expanded relative to the preceding coil.
For example, volume equal to 150% of a prior average is 1.5 times that average, or 50% above it. “150% above average” means 2.5 times the average. Write the intended multiplier explicitly in a strategy rule.
Trading Methods and Worked Examples
Coordinate Timeframes Without Hindsight
Use the primary chart to define the pattern and a higher timeframe to assess broader trend and nearby levels. A lower timeframe can support a different entry model after the primary signal, but it should not rewrite the original confirmation rule.
Require completed higher-timeframe candles if the strategy depends on their closing values. Record timezone, sessions, data adjustments and signal time. Information that appears later must not be treated as available at an earlier turning point.
Hypothetical S&P 500-Style Triangle
Consider an index-shaped example with resistance at 4,850 and a widest triangle base low of 4,710. The 140-point height projects 4,990 from a break at 4,850. These are illustrative levels, not a claim that the S&P 500 formed this setup in March 2025 or that a LuxAlgo tool confirmed it.
If an entry fills at 4,850 and the chosen invalidation stop is 4,780, planned risk is 70 points and potential reward is 140 points, or 2R before costs. An actual fill at 4,870 changes those distances to 90 and 120 points, about 1.33R.
The cash index itself is not a share you can buy. An ETF, future or other instrument requires its own prices, point value and execution assumptions. If a hypothetical contract paid $5 per point, a 70-point stop would represent $350 per contract before costs. A $100 risk budget would not accommodate one such contract.
Hypothetical Bitcoin Bullish Pennant
Suppose a Bitcoin-shaped advance runs from $52,000 to $58,000, creating a $6,000 pole. A 38.2% downward retracement from the high is $58,000 − ($6,000 × 0.382) = $55,708. That is a separate reference; it does not prove a pennant has formed.
With a breakout reference at $57,500, adding the $6,000 pole gives a $63,500 objective, not $64,000. The latter would require a different $58,000 projection anchor. State the convention rather than mixing the pole high with the breakout price.
If a long fills at $57,500 with a $56,800 stop, planned risk is $700 per BTC and potential reward to $63,500 is $6,000, approximately 8.57R before costs. However, a $56,800 stop is above the example’s $55,708 retracement low. It would need a later, narrower structure to justify it; it cannot be described as automatically below the entire pennant.
Using an independently justified stop at $55,500 instead makes risk $2,000 per BTC and the target 3R away. An illustrative $100 cash-risk budget would allow 0.05 BTC, or $2,875 of notional exposure. A $55,500 exit loses $100 before costs; a worse exit at $55,000 loses $125. This is a hypothetical spot-price calculation, not a verified April 2025 trade.
Review Pattern Setups with LuxAlgo
Use the Current Pennant Implementation
The LuxAlgo Pennant Library indicator implements a specific sequence: a qualifying pole, a compact converging coil and a breakout close in the pole’s direction. Its current page includes an Open on Quant Charts action.
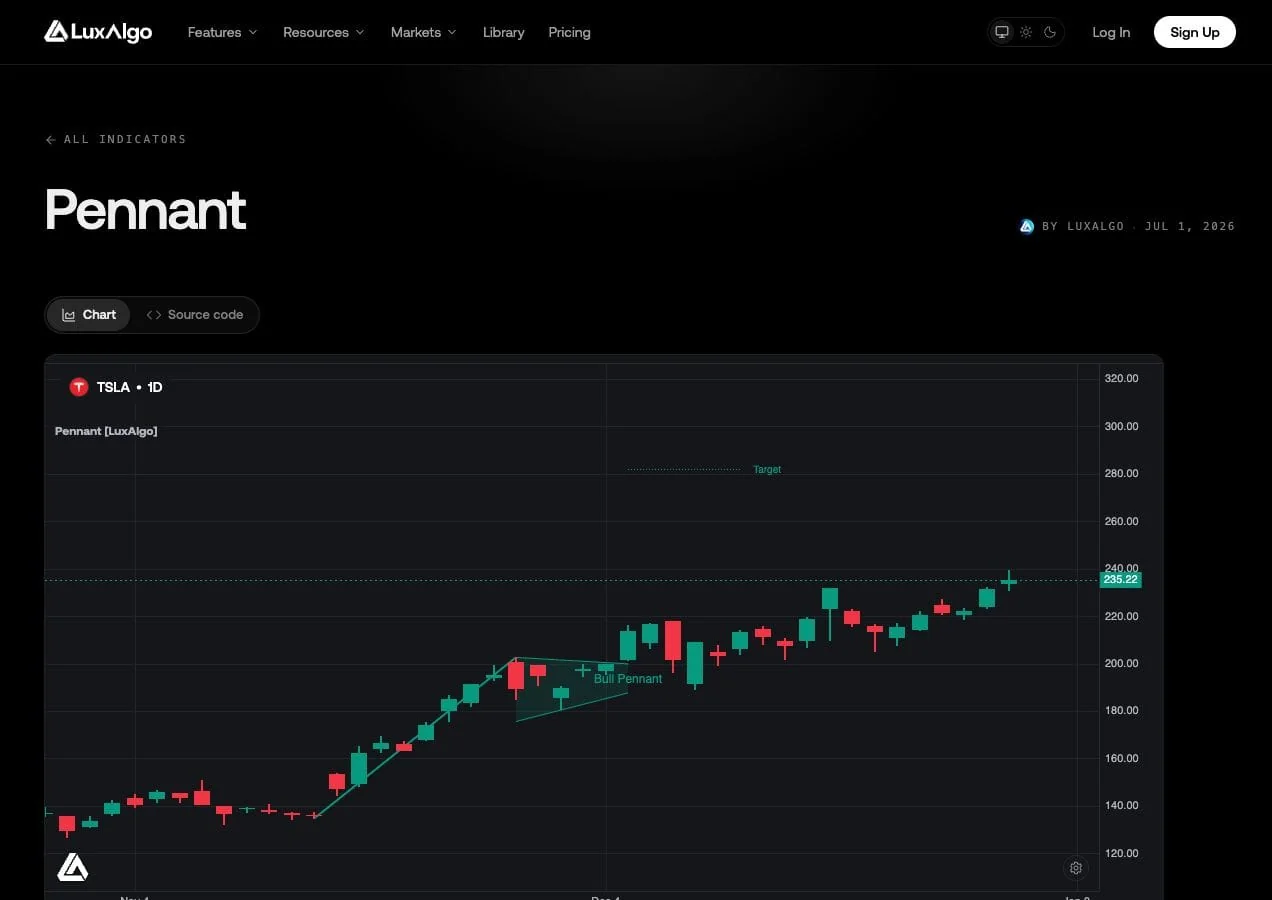
Documented defaults require a pole at least four ATRs tall, a coil lasting 4–15 bars, at least 25% convergence and no more than 50% pole retracement. The default volume filter looks for breakout volume at 1.25 times the coil average. These are this implementation’s settings, not universal definitions or proof of a profitable edge.
Forming boundaries are refitted as new bars arrive. Completed patterns are drawn from the confirmed breakout close. A wrong-way boundary close, an overlong coil or excessive retracement can invalidate the setup. When a symbol provides no volume, the indicator skips its volume conditions; such a signal must not be called volume-confirmed.
Inspect the Geometry on Quant Charts
On Quant Charts, inspect the pole anchors, coil boundaries and breakout candle together. Use chart drawings to compare your manual definition with the indicator’s fitted boundaries. Keep the symbol, timeframe and settings consistent when comparing examples.
Test a Defined Pattern with Quant
Ask Quant, our coding agent, to help implement the pattern definition, completed-close trigger, entry timing, retest window, stop, target and failure conditions. Include how confirmed pivots become available and whether forming boundaries may change.
Follow Making Strategies with Quant: inspect the generated Code and click Run yourself. Use the native backtest guide to review costs, fills, trade count, drawdown and average outcomes. Compare breakout and retest entries on the same data and reserve an untouched evaluation period.
The Library’s pattern and market-structure tools on a Quant Chart use their own detection rules. Do not assume they detect every triangle or reproduce the native Pennant implementation. Check their documented conditions before using an alert as part of a strategy.
A strategy result from another rule set does not validate a custom pennant or triangle model.
Pattern Failures and Risk Management
| Observation | Why it matters | Decision to define in advance |
|---|---|---|
| Price returns inside the pattern | The break may have failed | Close-back-inside rule, retest tolerance or structural stop |
| Low breakout volume | A chosen volume filter may be unmet | Skip, delay or classify separately; do not invent missing data |
| Little follow-through | The move may stall without reaching the target | Time stop or management rule tested with the base model |
| Coil expands or lasts too long | The original pattern definition may no longer apply | Invalidation or reclassification rule |
A high-volume break can still fail. Low volume does not guarantee failure either. Predefine how each observation affects the model, then retain losing and invalidated setups in the dataset rather than moving the boundaries afterward.
Choose a stop that tests the actual trade hypothesis. An opposite-boundary stop and a retest stop are different models. A fixed 1–2% account-risk rule is not suitable for every trader or instrument; choose a cash-risk budget compatible with the strategy, liquidity and account constraints, then calculate size from stop distance and point value.
For a simple spot or share position, planned size equals cash-risk budget divided by entry-to-stop distance, rounded down to the permitted increment. Fees, spread and gaps can increase realized losses. A drawn stop line, an indicator alert and an accepted broker order are separate things.
Chart Pattern Video Course
Build a Repeatable Pattern Review
Start with the boundaries and prior move, distinguish a forming shape from a completed trigger, and calculate reward from the actual entry. Quant Charts helps you inspect the structure; Quant helps implement explicit tests. The useful result is a repeatable process that includes failures, realistic costs and clearly stated assumptions.
FAQs
What is the difference between a triangle and a pennant?
Both can have converging boundaries, but a pennant requires a sharp preceding flagpole and a relatively compact coil. Triangles are a broader consolidation structure and can precede continuation or reversal.
Are ascending triangles always bullish and descending triangles always bearish?
Those are their traditional directional biases, not guaranteed outcomes. Wait for the defined break and retain an invalidation rule if price moves through the opposite boundary.
Does volume confirm that a breakout will succeed?
No. Volume can support a specified filter, but even a high-volume break can fail. State the feed and comparison window, and do not treat missing volume as confirmation.
How are triangle and pennant targets calculated?
A basic triangle objective projects its widest height from the break. A pennant objective projects the flagpole height from a stated breakout reference. Both are planning levels, not guaranteed destinations.
Must a pennant break near the apex?
No universal apex rule applies. A late crossing may reflect narrowing boundaries rather than meaningful expansion. Define the allowed duration and breakout condition for the model you intend to test.
How can LuxAlgo help compare pattern strategies?
Inspect the native Pennant indicator and manual boundaries on Quant Charts. Use Quant to help implement explicit entry, exit and failure rules, review the generated code and run the backtest yourself with realistic costs.
References
LuxAlgo Resources
External Resources
Read next