From Chart to Code: Turning Analysis Into Strategies

A chart observation becomes testable when you define the signal, when its information becomes available, and how a trade enters and exits. LuxAlgo’s native charts and Quant connect that specification with Pine Script® development and a backtest on the same chart. Here is a reproducible workflow:
- Identify Patterns: Inspect price, drawings, and indicators on your LuxAlgo chart. Record the specific conditions you intend to test.
- Generate Code: Convert your trading ideas into Pine Script® code using LuxAlgo Quant. You can describe strategies in plain English, refine logic iteratively, or upload chart screenshots to speed up indicator and strategy development. Review and run the result on your LuxAlgo chart; retest compatible code if you copy it to TradingView.
- Backtest Strategies: Use the native strategy viewer for custom code. Align assumptions before comparing results.
- Monitor and Validate: Save the tested configuration, inspect new signals, and confirm the supported alert or execution connection before automating orders. Include stress testing and operational checks before live use.
Quant reduces coding work, but you still need to check the rules, costs, fill timing, and validation data. A reproducible experiment is more useful than a script that merely compiles.
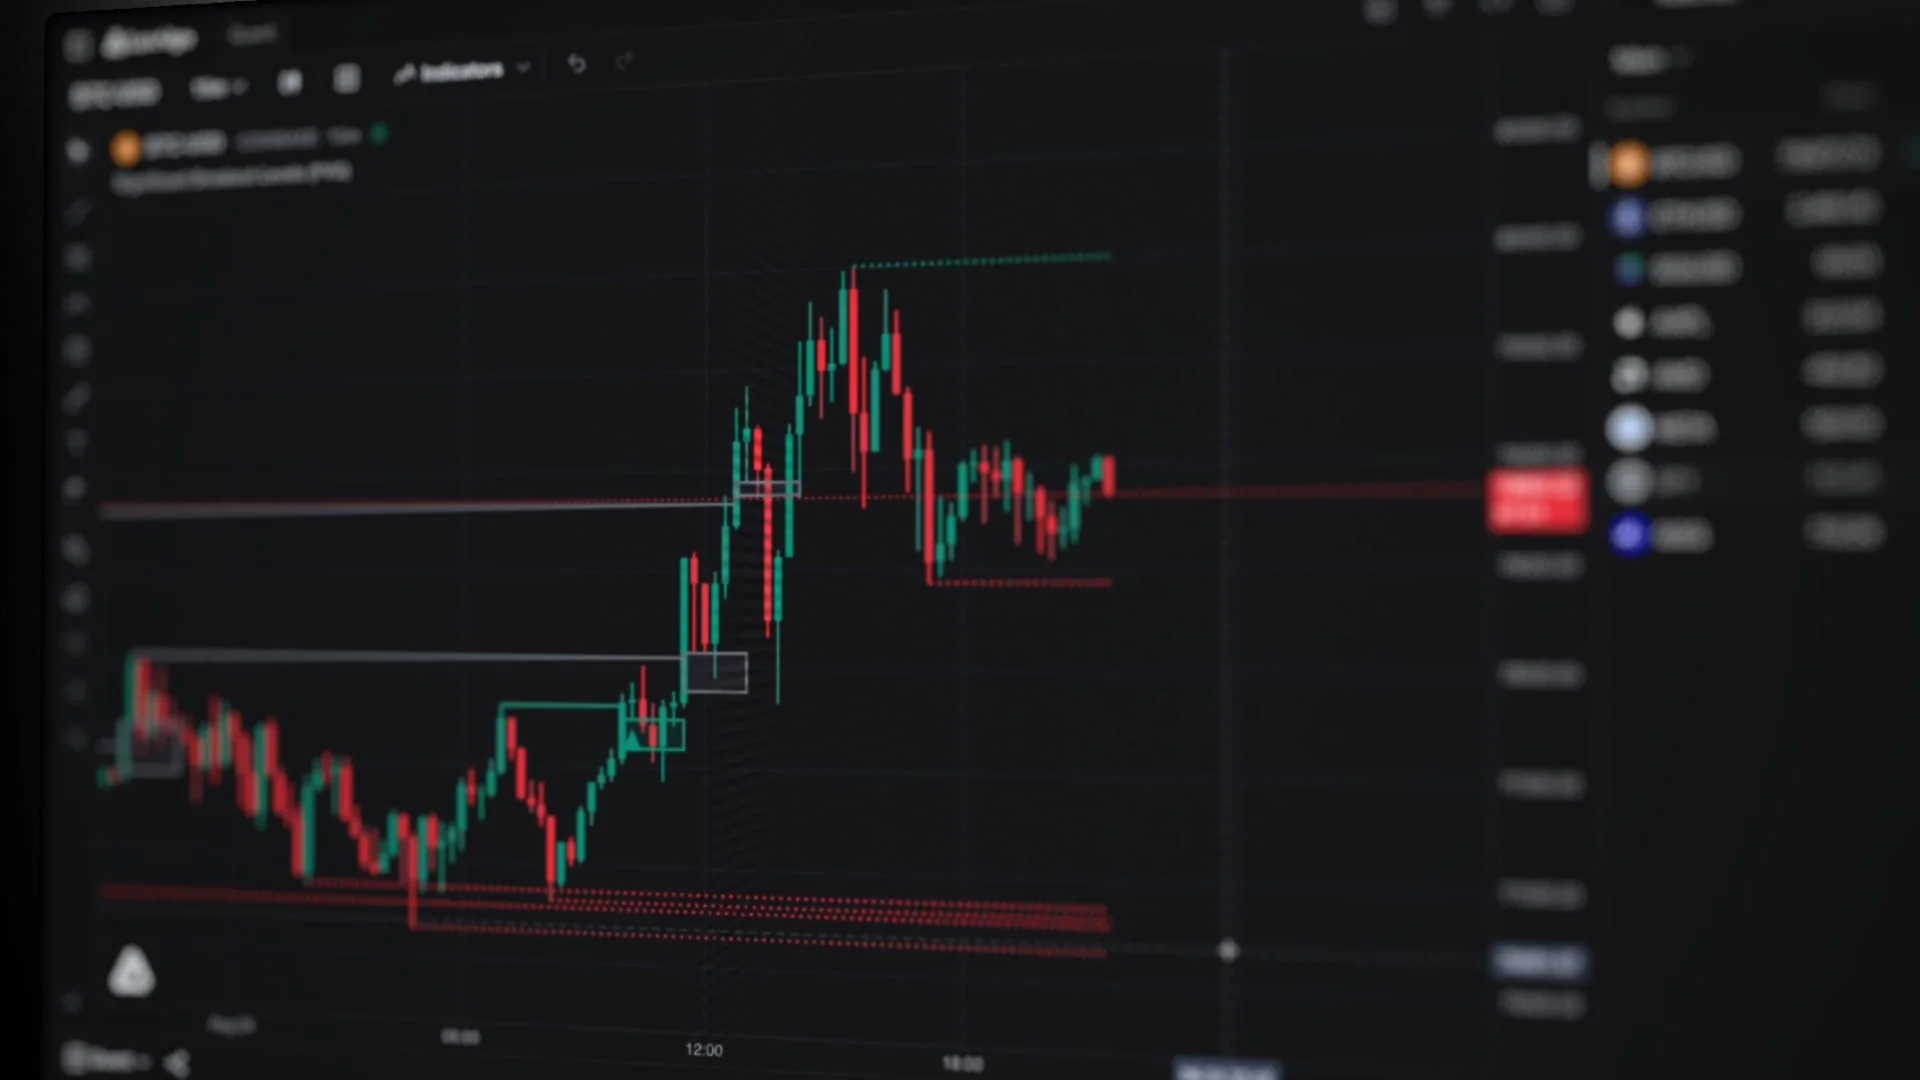
Step 1: Identify Patterns and Signals Using LuxAlgo
Mark examples and counterexamples of your idea, then define the rule that distinguishes them. Native LuxAlgo drawings and indicators help inspect the idea before Quant codes it.
The Library’s market-structure, trend and momentum tools on a Quant Chart supply the labels most ideas start from: a break of structure or change of character, a trend-tool flip, a divergence. Treat each label as a feature to investigate rather than a guarantee of the next move, and specify swing confirmation and signal timing before testing. Pivot-based labels can need later bars to confirm, and a backtest must wait for that information. Quant can implement the explicit rule, but a generated approximation is not identical to the tool that inspired it.
Step 2: Convert Chart Analysis into Code with LuxAlgo Quant
Ask Quant to build an indicator or strategy on the active LuxAlgo chart, then review its assumptions and Pine Script®. The chart lets you inspect signals and simulated trades. A historical result measures behavior under that simulation; it does not prove live performance.
Using Natural Language Prompts to Generate Pine Script® Code
You can describe a trading concept in plain language and let Quant generate the corresponding Pine Script® code. For example, typing "RSI oscillator with signals when RSI crosses above 30 or below 70" can quickly produce a functional starting point for an indicator.
The best workflow is to start simple and build iteratively. You might begin with a basic request such as "Add a moving average overlay," then refine it with "Add an alert when price crosses the moving average," and later add filters, exits, or plotting rules. This step-by-step method makes logic easier to test and reduces the chance of introducing avoidable bugs.
For more advanced strategies, break the project into smaller components and validate each one as you go. Be specific about plot styles, colors, line widths, input controls, and whether the script should render on the main chart or in a separate pane. The clearer the prompt, the closer the output will match your intended workflow.
Converting Chart Screenshots into Strategy Code
Quant also supports visual workflows through its Vision-to-Code capabilities. You can upload chart screenshots and ask it to translate the visual logic into Pine Script®. That is useful when you have manually marked trendlines, highlighted support and resistance zones, or outlined pattern conditions and want to automate them.
Use clear images and annotations, then ask Quant to separate observations from inferred rules. Screenshots cannot reveal every formula, hidden setting, or order rule. Compare generated output with your examples and counterexamples. Use Fix with Quant for syntax or runtime errors, and verify the behavior after each repair.
Setting Up Entry Rules, Exit Rules, and Risk Parameters
Specify the native strategy in plain language. For example: “On daily bars, enter long on the next bar after the close crosses above the highest high of the previous 20 completed bars. Allow one position; exit after a close below the lowest low of the previous 10 completed bars. Exclude the current bar from both lookbacks. Expose the lengths as inputs and plot the levels.” This is an illustrative baseline. Review the Pine Script® and configure sizing, commission, and slippage before interpreting results.
Step 3: Debug and Optimize Your Strategy Code
Once your strategy code is generated, the next step is refining it. While Quant includes tools to detect and highlight issues, you still need to make sure the script matches your trading logic and behaves consistently across different environments. Debugging and optimization are not just about fixing code. They are about improving robustness, reducing false assumptions, and building a strategy that can hold up under changing market conditions.
Finding and Fixing Errors in Generated Code
Check compilation messages and plotted behavior after each change. Runtime errors may appear only on particular bars or inputs. Inspect representative signals and entries against your specification; successful compilation does not establish correct trading logic.
Use Fix with Quant for reported syntax or runtime issues, then inspect the repair and rerun your examples. Retain the prior version so unintended behavior changes are easy to identify.
Adjusting Parameters for Better Performance
Optimizing a strategy usually comes down to adjusting a small set of meaningful parameters. Variables such as stop-loss distances, take-profit logic, and signal thresholds can materially change performance. To better adapt to volatility, many traders prefer ATR-based stop systems rather than fixed-distance stops, since they scale more naturally with market conditions.
Test nearby parameter values and record their results. A spreadsheet or separate analysis tool can visualize the experiment as a heatmap; this does not imply native Quant parameter heatmaps. If only one narrow setting works, investigate sensitivity and overfitting before expanding the search.
Adapting Strategies to Different Markets and Assets
Strategies are rarely universal. A setup that performs well on a 1-hour Bitcoin chart may behave very differently on a daily equity chart. To make a strategy more adaptable, test it across multiple asset classes and timeframes, then compare how the logic responds to shifts in volatility, session structure, and trend persistence.
Keep tunable inputs proportional to the evidence available; there is no universal safe count. Check sessions, data, tick size, sizing, and costs when changing markets. Use native Inputs for numbers and Quant when the logic needs to change.
To reduce overfitting, incorporate walk-forward validation in addition to simple in-sample optimization. That gives you a better sense of whether performance survives when the strategy is repeatedly tested on unseen data rather than only on the period used to tune parameters.
Step 4: Test Your Strategy with LuxAlgo Backtesting Tools
Run the custom strategy on LuxAlgo and expand its Backtest Summary. Review Performance, Trades Analysis, and Trades Log. Configure capital, order size, pyramiding, commission, slippage, and margin in Properties; inspect fills on standard price bars. Star the baseline to retain its script, symbol, interval, inputs, and Properties.
To test across timeframes, change the interval and rerun the same strategy; Quant backtests it against years of history on each one. Save every run as a separate experiment and compare trade count, average trade duration and drawdown alongside the net result, not just the best figure from a parameter search.
Step 5: Deploy and Monitor Your Strategy
Keep your tested native run and workspace available for review. Confirm the supported connection before adding alerts or automated orders. Native backtesting, strategy alerts, TradingView alerts, and broker execution are distinct workflows; custom Quant code does not automatically run through all of them.
Configuring Alerts and Automation on TradingView
TradingView notification and frequency options depend on the selected condition, alert() call, or strategy order-fill event. Choose supported behavior that matches the rule, for example:
- Only Once: Sends a single notification.
- Repeated triggers: use the options supported by the selected condition.
- Once Per Bar Close: Reduces noise by waiting for the candle to close.
- Once Per Minute: where available, limits notification frequency; it does not establish suitability for a fast strategy.
Use bar-close behavior where supported if the rule requires a completed candle. Strategy order-fill alerts follow simulated order events; notification frequency does not change the fill model or confirm broker execution.
Supported strategy order-fill placeholders, including {{strategy.order.action}}, {{strategy.order.price}}, and {{strategy.position_size}}, describe strategy events rather than confirmed broker fills. Follow TradingView’s webhook documentation and the receiver’s format. Test mapping, sizing, order responses, and duplicate handling.
TradingView saves the script and settings when creating an alert. Recreate affected alerts after changing them. Test the full workflow in a controlled paper environment, including rejections and disconnections; a smaller timeframe is not a substitute for matching the strategy’s actual timing.
Sharing Strategies and Getting Feedback from the LuxAlgo Community
After deploying your strategy, sharing it with the LuxAlgo community can lead to valuable feedback. Posting the strategy logic, alert structure, and performance metrics allows other traders to review the approach and point out blind spots or alternative filters. This kind of collaboration often helps uncover edge cases that are hard to notice when building alone.
Community feedback is especially useful when combining multiple systems, such as pairing momentum logic with a market-structure filter. Small tweaks discovered through discussion can materially improve a strategy over time.
Updating Your Strategy as Market Conditions Change
Review the unchanged baseline before tuning it. On native charts, inspect the saved run, Performance, and Trades Log; on TradingView, use the Strategy Tester for that script. Investigate data, execution, exposure, and market conditions before adjusting rules, and validate every revision as a new hypothesis.
In practice, this ongoing maintenance loop is one of the best reasons to keep using Quant. Instead of manually editing Pine Script® every time the market changes, you can iterate on logic faster, test alternate rule sets, and clean up code more efficiently.
Conclusion
Turning chart analysis into automated strategies can be a smooth process when you follow a structured workflow. Start by identifying patterns with LuxAlgo, translate those ideas into code with Quant, debug and refine the script, backtest it thoroughly, and then deploy it with proper monitoring and alert logic.
The main benefit of combining technical analysis with automation is consistency. When you encode patterns like head and shoulders reversals or momentum-based crossover logic into a strategy, you remove much of the emotional hesitation that often affects manual execution. The strategy follows the same rules on every trade, which makes both testing and review more objective.
Native LuxAlgo charts connect Quant development with strategy testing and saved runs. Record which assumptions produced each result.
That said, automation is not a set-and-forget solution. Markets are dynamic, and strategies must evolve as volatility, trend persistence, and liquidity conditions change. Review performance regularly, stay engaged with feedback, and keep refining the rules so the system remains aligned with the environment you are trading.
FAQs
What’s the fastest way to turn a chart idea into Pine Script® with Quant?
The fastest route is to use LuxAlgo Quant, the coding agent built into every LuxAlgo chart for Pine Script® generation and refinement. You can describe the idea in natural language, upload chart images, or iterate on existing code. Quant then helps generate, validate, and debug the script so you can get from concept to usable indicator or strategy much faster.
How do I avoid overfitting when optimizing a strategy in backtests?
To reduce overfitting, use validation methods that better reflect real trading conditions. That includes time-based data splits, walk-forward validation, and testing across different market regimes such as trending, mean-reverting, and volatile periods.
It also helps to keep the strategy simple. Too many tunable parameters can make a system look strong in historical data while weakening its ability to generalize. Validate changes on unseen data, avoid optimizing every variable at once, and focus on logic that remains stable across nearby parameter values rather than only at one perfect setting.
What do I need to automate TradingView alerts with webhooks safely?
Start with a secure webhook URL that uses HTTPS, then make sure your alert payload is formatted properly, usually in JSON. Use a trusted automation layer or execution bridge, keep credentials out of the message body, and restrict access to the endpoint wherever possible.
You should also enable 2-Factor Authentication (2FA) on TradingView, test the full alert flow before going live, and monitor endpoint activity so you can quickly spot failures or suspicious requests. Done properly, webhook-based automation can be both reliable and secure.
References
LuxAlgo Resources
- LuxAlgo
- Native Strategy Viewer and Saved Runs
- LuxAlgo Quant
- Quant Documentation
- RSI Candlestick Oscillator
- Support and Resistance Trading
- Stress Testing for Trading Strategies
- Head and Shoulders Pattern
External Resources
Read next