Common Problems with Volume Indicators and Solutions
Volume indicators describe trading activity, but they cannot explain every participant’s motivation or guarantee that a price move will continue. A misleading reading can come from the data feed, a mismatched comparison period, an indicator’s formula or an untested trading rule. Diagnose which problem you have before adding another indicator.
LuxAlgo’s AI trading and charting platform brings native charts, Order Flow tools and Quant, its coding agent, into one workspace. That makes it easier to inspect volume beside price and turn a clearly defined idea into a test. It does not remove the need to understand the source data or review the generated strategy.
- Check the feed: know the venue, volume units, session and available history.
- Compare like with like: use completed bars or match the elapsed part of a session.
- Understand the calculation: OBV, VWAP, A/D and MFI encode different information.
- Test the rule: compare a volume-filtered strategy with the same strategy without that filter.
Common Problems with Volume Indicators
1. Volume Does Not Explain Intent
A volume spike shows increased activity in the observed data. It does not identify whether the cause was an earnings announcement, hedging, rebalancing, a liquidation or a change in expectations. Every executed trade has a buyer and a seller; “buying pressure” needs a defined measure, such as which side initiated the trade, rather than simply a high volume bar.
Review company announcements, the calendar and the surrounding price behavior. A spike near resistance could accompany a breakout, rejection or repeated two-way trading. The level and subsequent behavior help frame a hypothesis; they do not prove the story behind the trades.
Likewise, a doji or hammer on high volume is a pattern to investigate, not a reliable identification of institutional intent. Keep an observation such as “volume was twice its baseline” separate from an interpretation such as “buyers are accumulating.” The first can be checked directly; the second needs more evidence.
2. The Feed May Cover a Different Market or Session
Before comparing platforms, confirm that both charts use the same instrument, venue, session, timezone and bar interval. A single crypto venue and an aggregated feed need not show identical volume. Share volume, contract volume and tick activity are different units; raw values cannot be compared as though they measure the same thing.
Regular-hours and extended-hours data can also change an indicator. An opening bar following overnight news is not directly comparable to an ordinary midday bar. Check holidays, shortened sessions, halts and missing observations before concluding that participation has suddenly disappeared.
On LuxAlgo, check the market-data documentation for the instrument and tool you want to use. Candle data and footprint data have different coverage requirements. An empty plot can mean unavailable data rather than zero trading activity.
3. Developing Bars and Historical Baselines Can Mislead
A live bar is still accumulating volume. Comparing its first minute with a completed five-minute bar understates activity; comparing a full session with a short extended-hours window creates a different mismatch. For intraday analysis, use a baseline matched to the time of day or the same elapsed portion of prior sessions.
Calculation lag and feed delay are separate issues. A moving average of volume smooths past observations by design. A delayed feed delivers observations late. Many indicators can update during the current bar, but a condition that appears before the close may disappear before the bar is final. Decide whether your rule uses intrabar values or confirmed closes and test the same behavior.
A 20-session average can be a useful starting comparison for daily volume, but it is not a universal standard. Exceptional event days can pull an average upward. Inspect the underlying sample and consider whether a median, matched event group or time-of-day baseline better answers your question.
4. Manipulation Cannot Be Diagnosed from a Volume Bar Alone
Wash trading can create artificial activity, while spoofing concerns orders placed with the intent to cancel before execution. The CFTC’s guidance describes that intent requirement. Unexecuted spoof orders affect displayed interest; they do not directly become executed volume merely because they appeared in the order book.
Dark pools are a different subject. They are trading venues with limited pre-trade display, not inherently evidence of manipulation. FINRA explains that listed-stock executions on alternative trading systems, including dark pools, are reported through trade-reporting facilities and published on the consolidated tape. What your chart includes still depends on its feed and processing.
The absence of an obvious news headline does not prove a spike is artificial. Nor does rapid algorithmic activity establish misconduct. Historical open, high, low, close and volume data cannot by itself reveal participant identity, intent or the full order lifecycle. Treat suspicious readings as a reason to investigate data quality and context.
Solutions and Best Practices
Combine Volume with a Defined Price Condition
Start with a concrete price setup and ask what volume contributes. For example, define a breakout as a completed daily close above the previous 20 sessions’ high, then compare it with and without a volume requirement. “Strong volume near resistance” is too ambiguous to reproduce consistently.
Adding several indicators derived from the same price and volume series does not necessarily create independent confirmation. OBV, A/D and MFI may respond differently because of their formulas, but agreement between them is not three separate pieces of market evidence. Prefer a small set with distinct analytical roles.
Normalize the Comparison
Suppose a completed session trades 1.5 million shares and the prior 20 completed sessions average 1 million. Relative volume is 1.5. That is a descriptive ratio, not a 50% improvement in signal quality or proof that a breakout will succeed.
If you are testing that threshold, use only information available at the decision time. Do not use the final full-day volume to justify an order placed in the morning. Compare different sessions, events and volatility conditions without repeatedly selecting the threshold that makes the historical chart look best.
| Symptom | Check first | Useful response |
|---|---|---|
| Two platforms show different volume | Venue, units, session and feed coverage | Align the inputs before comparing indicators. |
| Opening volume looks unusually high | Time-of-day and event context | Compare with prior opening periods. |
| A signal disappears | Developing versus confirmed bar | Match alert and backtest timing to the intended rule. |
| Delta is blank | Footprint coverage and supported interval | Verify availability; do not substitute zero. |
| A filter improves win rate but lowers returns | Trade count, costs and average win/loss | Evaluate the complete strategy, not one metric. |
Volume Indicator Comparison
Choose an indicator by the calculation you need rather than an unsupported ranking of which one is “best” in a market regime.
| Indicator | Calculation and use | Main limitation |
|---|---|---|
| On-Balance Volume (OBV) | Adds volume when the close rises, subtracts it when the close falls, and leaves the total unchanged on an equal close. Useful for comparing a cumulative series with price. | Assigns the entire bar’s volume according to close direction; it does not measure actual aggressor-side volume. |
| Volume Weighted Average Price (VWAP) | A volume-weighted price average from a chosen anchor. Can provide session or longer-window context. | The result depends on the anchor, source price and feed. A touch is not a guaranteed support or resistance reaction. |
| Accumulation/Distribution (A/D or ADL) | Weights volume by the close’s location inside the bar’s high-low range, then accumulates it. | Does not directly incorporate the change from the previous close; a gap can make it diverge from close-to-close price direction. |
| Money Flow Index (MFI) | Uses typical price and volume to form an oscillator of positive versus negative money flow. | Its overbought/oversold readings are formula outputs, not direct measurements of investor cash flows or automatic reversal signals. |
TradingView provides the standard calculations for OBV, ADL and MFI. Its anchored VWAP guide also illustrates why VWAP is not limited to a daily reset.
Divergence is a difference between series that merits investigation. It is not, by itself, a reversal forecast. An indicator can diverge for an extended period, and changes in the underlying data can also produce unexpected readings.
Using LuxAlgo for Volume Analysis
Inspect Native Order Flow beside Price
Open LuxAlgo’s chart workspace, select the instrument and interval, then add the relevant tool from Indicators → Orderflow. Choose the active chart first when using a multi-chart layout.
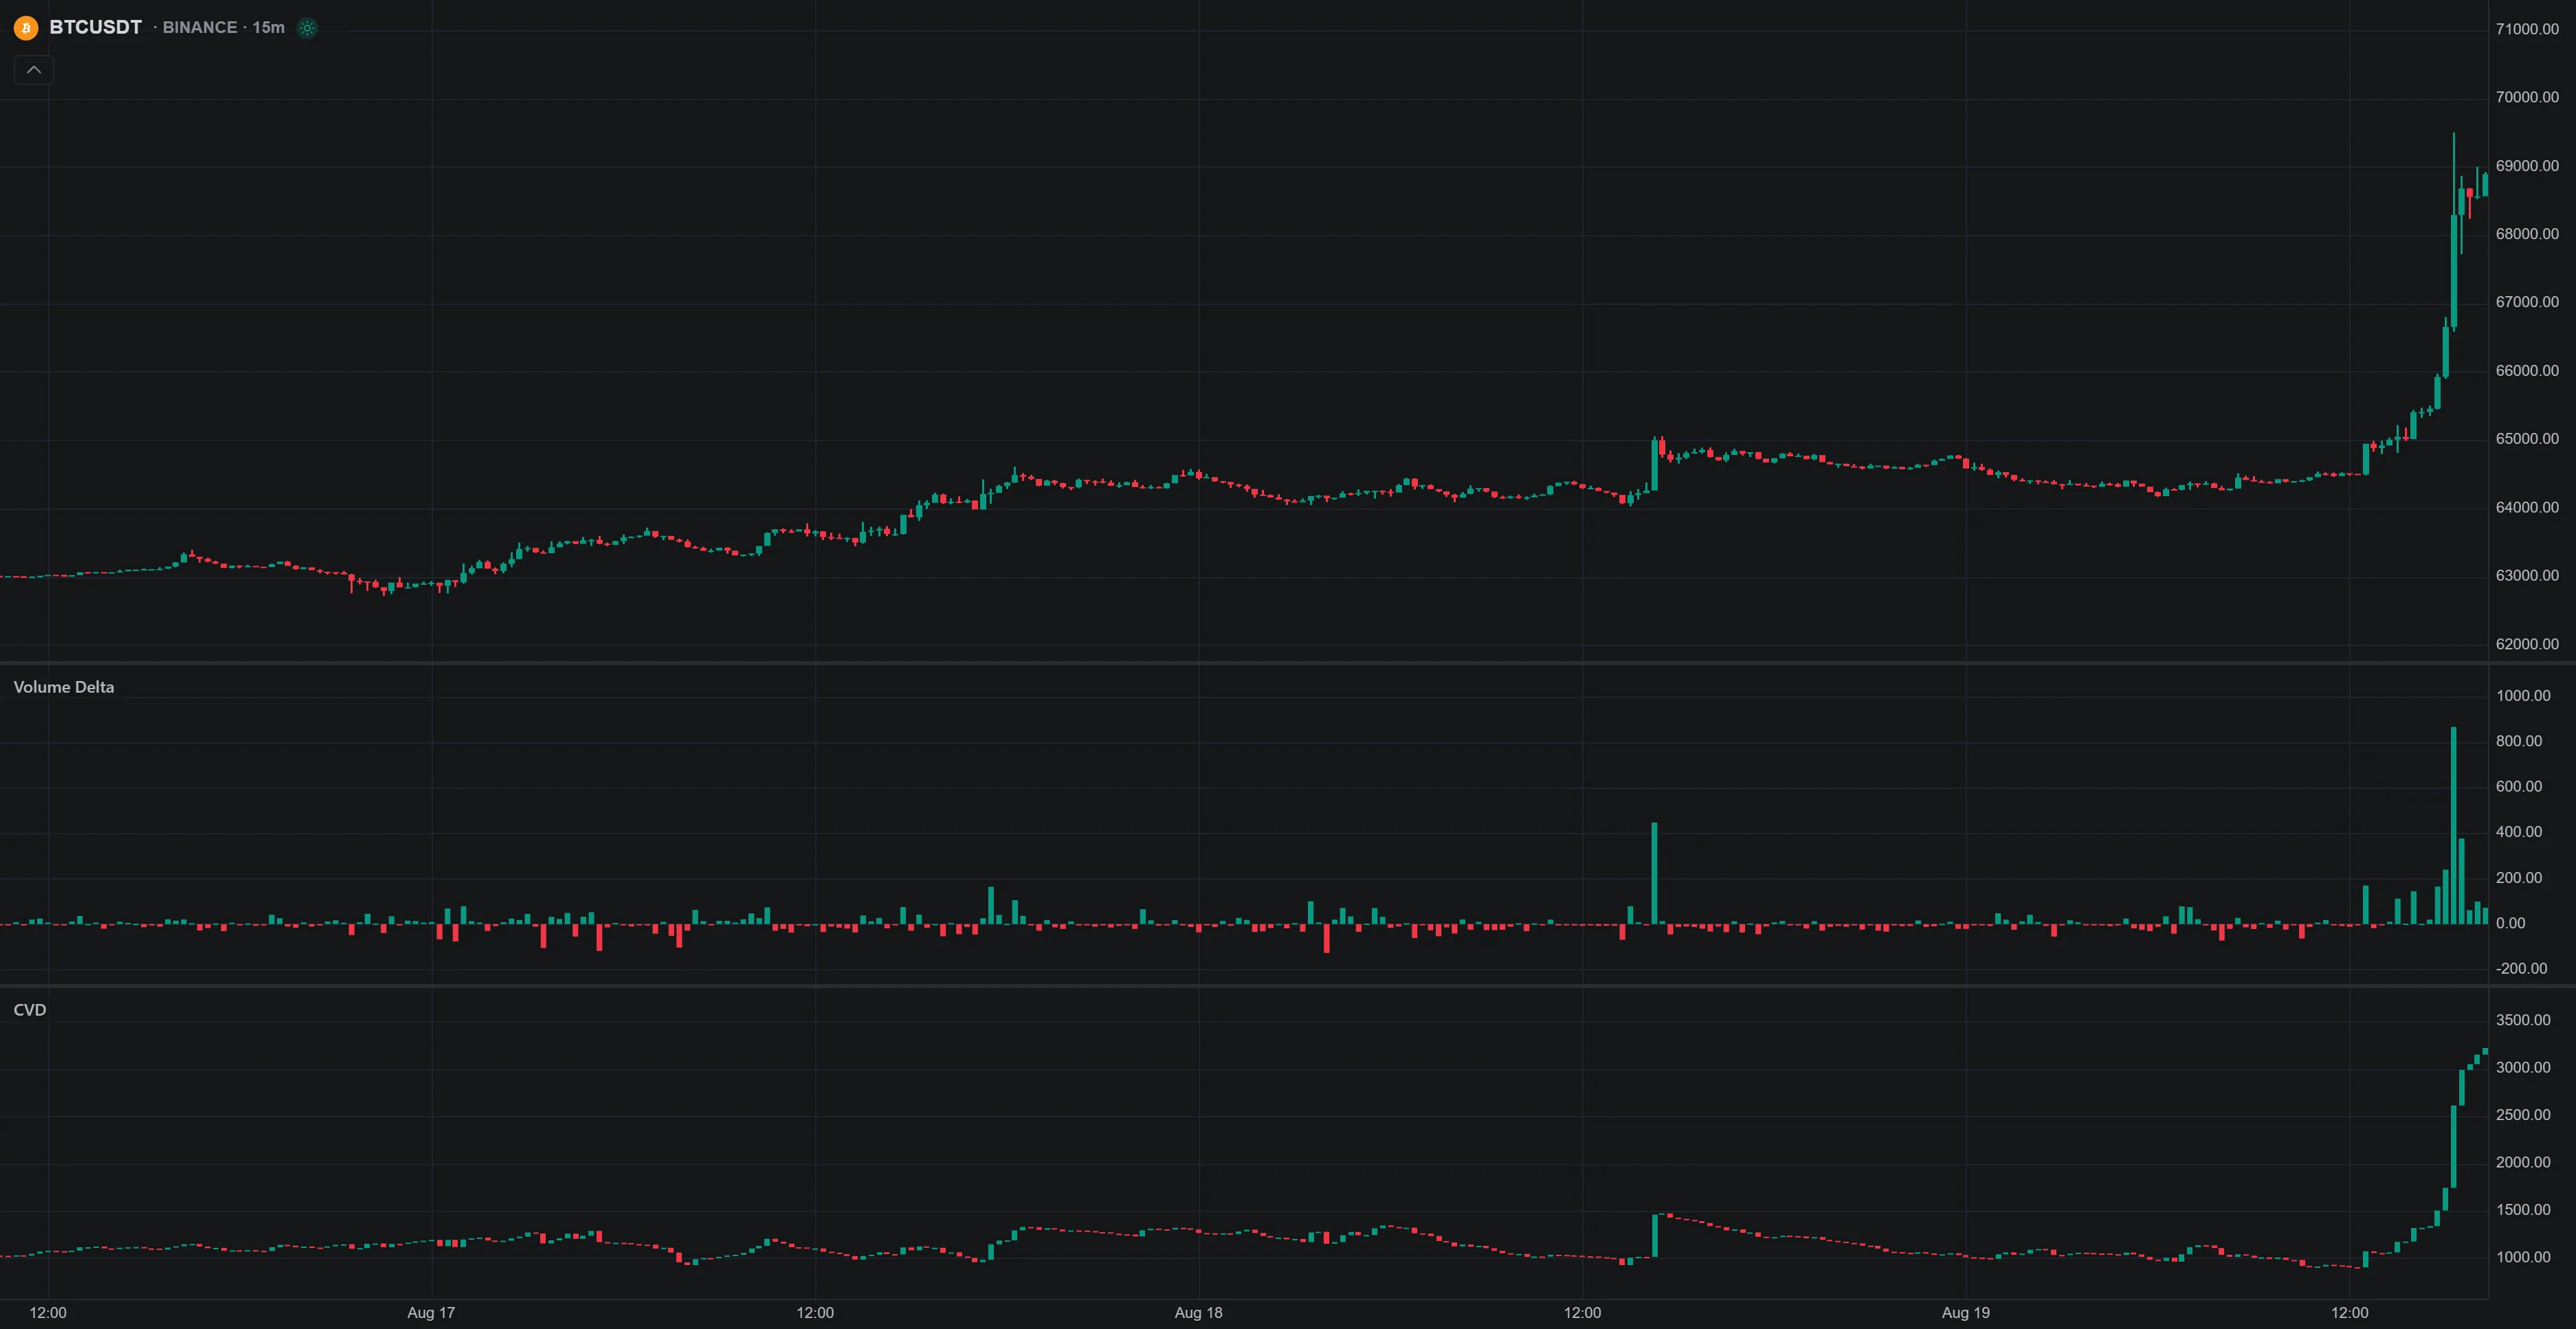
Volume Delta’s Total mode subtracts sell volume from buy volume for each bar. CVD accumulates that difference from its anchor. Average mode instead compares average trade sizes on each side; it is a different measure. These tools require footprint-capable data and a fixed bar duration, and are unavailable on monthly timeframes. Missing per-side trade counts can leave gaps in Average mode.
Keep the CVD anchor consistent when comparing charts. A daily reset and an all-data accumulation answer different questions. Price rising while CVD weakens may prompt investigation of absorption or changing participation, but the chart alone does not prove either explanation.
LuxAlgo’s VWAP Bands uses candle price and volume, with Day, Week or Month anchors in UTC. Its Source setting can use HLC3, OHLC4 or Close. Match those choices before comparing it with another chart. VWAP is an aggregate reference price, not every participant’s cost basis.
Test a Volume Rule with Quant
Quant can turn a precise description into indicator or strategy code on LuxAlgo’s charts. For a daily-bar experiment, a prompt could specify: “Enter after a confirmed close above the prior 20 bars’ high, only when volume exceeds 1.5 times the prior 20 completed bars’ average. Exclude the current bar from both baselines. Exit after five bars and use one unit per trade.” These are illustrative test rules, not a recommended trading strategy.
- Review Code: verify the lookbacks, current-bar exclusion, signal timing and exit behavior.
- Run and inspect: compare several generated trades with the underlying candles. A script that compiles can still implement the wrong rule.
- Set assumptions: check capital, sizing, commission and slippage. Confirm when the engine fills an order relative to the signal.
- Compare a baseline: run the same rules without the volume filter, keeping the other assumptions fixed.
- Validate separately: inspect trade count, net results, drawdown and average trade; reserve data that was not used to choose the filter.
See Quant’s strategy workflow for the native controls. Testing ordinary candle volume does not test a footprint-delta rule unless that required historical data is actually available to and used by the script. Showing a visual tool beside the chart is not evidence that a backtest consumed its data.
Keep Alerts and TradingView Workflows Distinct
Configure alerts for the condition and symbol you intend to monitor, then check their timing and delivery settings. LuxAlgo’s native chart documentation lists plan-based alert limits and paid-plan webhooks. Do not assume a saved Quant backtest automatically becomes a running email or webhook strategy alert.
The legacy Strategy Alerts service and TradingView toolkits have separate workflows. When moving code to another charting environment, validate its supported functions, data and execution assumptions there. A successful run on one platform is not proof of identical behavior on another.
Make the Volume Workflow Repeatable
Record the feed, session, interval, anchor and rule version when comparing results. If a reading looks wrong, first reproduce it from those inputs. Add context from price structure and events, then evaluate whether the extra condition improves the strategy after costs. Avoid explaining every anomaly with a story about manipulation or institutional activity.
FAQs
Can a volume spike reveal market manipulation?
No. A spike alone cannot establish manipulation or identify trader intent. Check the data source, timing, events and any available trade or order records. Missing news is not proof of artificial activity, and lawful dark-pool trading should not be treated as manipulation.
How can historical volume patterns improve a trading test?
They provide a baseline for measuring unusual activity. Match the instrument, session and elapsed time, use only data available at the decision point, and compare a strategy with and without the volume condition. A descriptive volume ratio does not guarantee better returns.
How can LuxAlgo help troubleshoot volume indicators?
LuxAlgo combines native charts, Order Flow tools and Quant for inspecting data and testing explicit rules. Verify tool coverage and settings, review generated code and trades, and configure alerts separately. Neither additional indicators nor a successful backtest removes data limitations or proves future performance.
Read next