Counting Systems: Trading Metrics Simplified
A useful trading count needs a defined event and a consistent denominator. Counting winning trades, consecutive qualifying bars and columns on a point-and-figure chart are different tasks. Each can support analysis, but they do not produce the same kind of information.
This guide separates trade-performance metrics from signal rules and chart-based counts. Start with reproducible definitions, calculate the results from complete records and assess risk alongside returns. A count or price objective is not, by itself, a probability of a profitable trade.
Three Different Meanings of a Trading Count
| Type of count | What is counted | What it tells you |
|---|---|---|
| Trade statistics | Closed trades, wins, losses and their outcomes | How a specified sample performed |
| Rule-based signal counts | Bars or events meeting a written condition | Whether the condition occurred under that definition |
| Point-and-figure counts | Boxes or columns in a defined chart pattern | A chart-based price projection under a stated method |
A moving-average crossover is a signal rule, not automatically a counting system. You could count its occurrences or require several qualifying bars, but you must specify that extra rule. Similarly, a point-and-figure target describes a projected price level; it does not estimate the chance of reaching that level without separate statistical analysis.
Core Trading Metrics
Win Rate, Profit Factor and Payoff Ratio
| Metric | Calculation | Interpretation limit |
|---|---|---|
| Win rate | Winning trades divided by the defined trade count | Depends on whether breakeven trades and costs are included |
| Profit factor | Total profits from winning trades divided by the absolute total losses from losing trades | Can be unstable with few losses; undefined when the loss denominator is zero |
| Realized payoff ratio | Average winning outcome divided by the absolute average losing outcome | Describes realized outcomes, not the entry target |
| Planned reward-to-risk | Planned target distance divided by planned stop distance for a simple linear position | Does not guarantee either the fill or the realized average payoff |
AmiBroker’s report documentation distinguishes profit factor from the average-win/average-loss payoff ratio. Read each platform’s implementation before comparing reports: similarly named fields can use different trade handling, cost treatment or return conventions.
There is no universal professional win rate or profit-factor range that proves a strategy is good. A high win rate can coexist with losses if losing trades are large. A high profit factor from a small, selected sample may disappear when costs, additional trades or different market conditions are included.
A Reproducible Ten-Trade Example
Suppose a hypothetical sample has four winning trades of $200 each and six losing trades of $100 each, before costs. There are no breakeven trades or open positions in this example.
- Win rate: 4 ÷ 10 = 40%.
- Total winning profits: $800; absolute total losing losses: $600.
- Profit factor: $800 ÷ $600 ≈ 1.33.
- Realized payoff ratio: $200 ÷ $100 = 2.
- Average outcome: ($800 − $600) ÷ 10 = $20 per trade.
If round-trip costs are $25 on every trade, the winning outcomes become $175 and losing outcomes become −$125. The net result is $700 − $750 = −$50, or −$5 per trade, and the net-outcome profit factor is approximately 0.93. The win count stays the same here, but sufficiently small gross winners could become net losers after costs.
Expectancy Is an Estimate, Not a Forecast
For a sample with wins and losses only, average outcome can be written as: win fraction × average win − loss fraction × absolute average loss. Include zero outcomes consistently if there are breakeven trades. The formula summarizes the sample; it does not establish future probabilities.
A hypothetical 30% win fraction with average position returns of +20% on winners and −8% on losers gives 0.30 × 20% − 0.70 × 8% = +0.4% per trade before costs. This arithmetic does not establish a CAN SLIM win rate or the realized performance of William O’Neil’s method. It is also not automatically a 0.4% account return: allocations, overlap, compounding and costs matter.
Count Signal Events Without Looking Ahead
Moving-Average Systems
A simple moving average gives equal weight to observations within its window; an exponential moving average gives greater weight to more recent observations. Either can be used at different horizons. Neither is inherently restricted to long-term or short-term trading.
For an illustrative trend rule, choose the source price, two periods and the exact crossover condition. Then decide whether the event is evaluated only on completed bars, whether repeated qualifying bars count once or repeatedly, and when an order could first execute. Periods such as 10, 20, 50, 100 and 200 are common research choices, not universal optimum settings.
Breakout Systems
Define the support or resistance reference using information available before the signal. A breakout above the prior 20 completed bars’ high is different from a breakout above a level selected later by visual inspection. Specify whether a close beyond the level is required and which timeframe supplies that close.
Volume and an additional confirmation rule can change the sample, but neither guarantees a genuine breakout. A daily close is not mandatory for every intraday system. Track failed breakouts and the costs of delayed confirmation instead of discarding them from the results.
Reversal Systems
Support and resistance, volume, price action, RSI, MACD and the stochastic oscillator can contribute to a defined reversal hypothesis. State the actual threshold, pattern or crossing condition rather than writing “enter when exhaustion is clear.” An overbought or oversold reading can persist while a trend continues.
Adding several indicators derived from similar prices does not automatically create independent confirmation. Compare the base rule with each added filter on later data, retaining the rejected trades in the research record so you can see what the filter changed.
Point-and-Figure Counts Are Price Projections
Point-and-figure charts use columns of Xs and Os to represent qualifying price changes. A horizontal count uses a defined congestion pattern’s width, while a vertical count uses an identified column. Record the box size, reversal setting, data method and counting convention so another reader can reproduce the projection.
StockCharts explains horizontal price objectives as estimates from a completed pattern. Under its illustrated fixed-box convention, multiply the counted width by box size and reversal amount, then apply the extension to the specified pattern reference. Other conventions can produce different objectives.
In its historical Chevron example, the bearish extension is 7 × $1 × 3 = $21, subtracted from $69 to give $48. The bullish example uses 5 × $1 × 3 = $15, added to $80 to give $95. These are chart-method calculations, not current Chevron targets or probabilities.
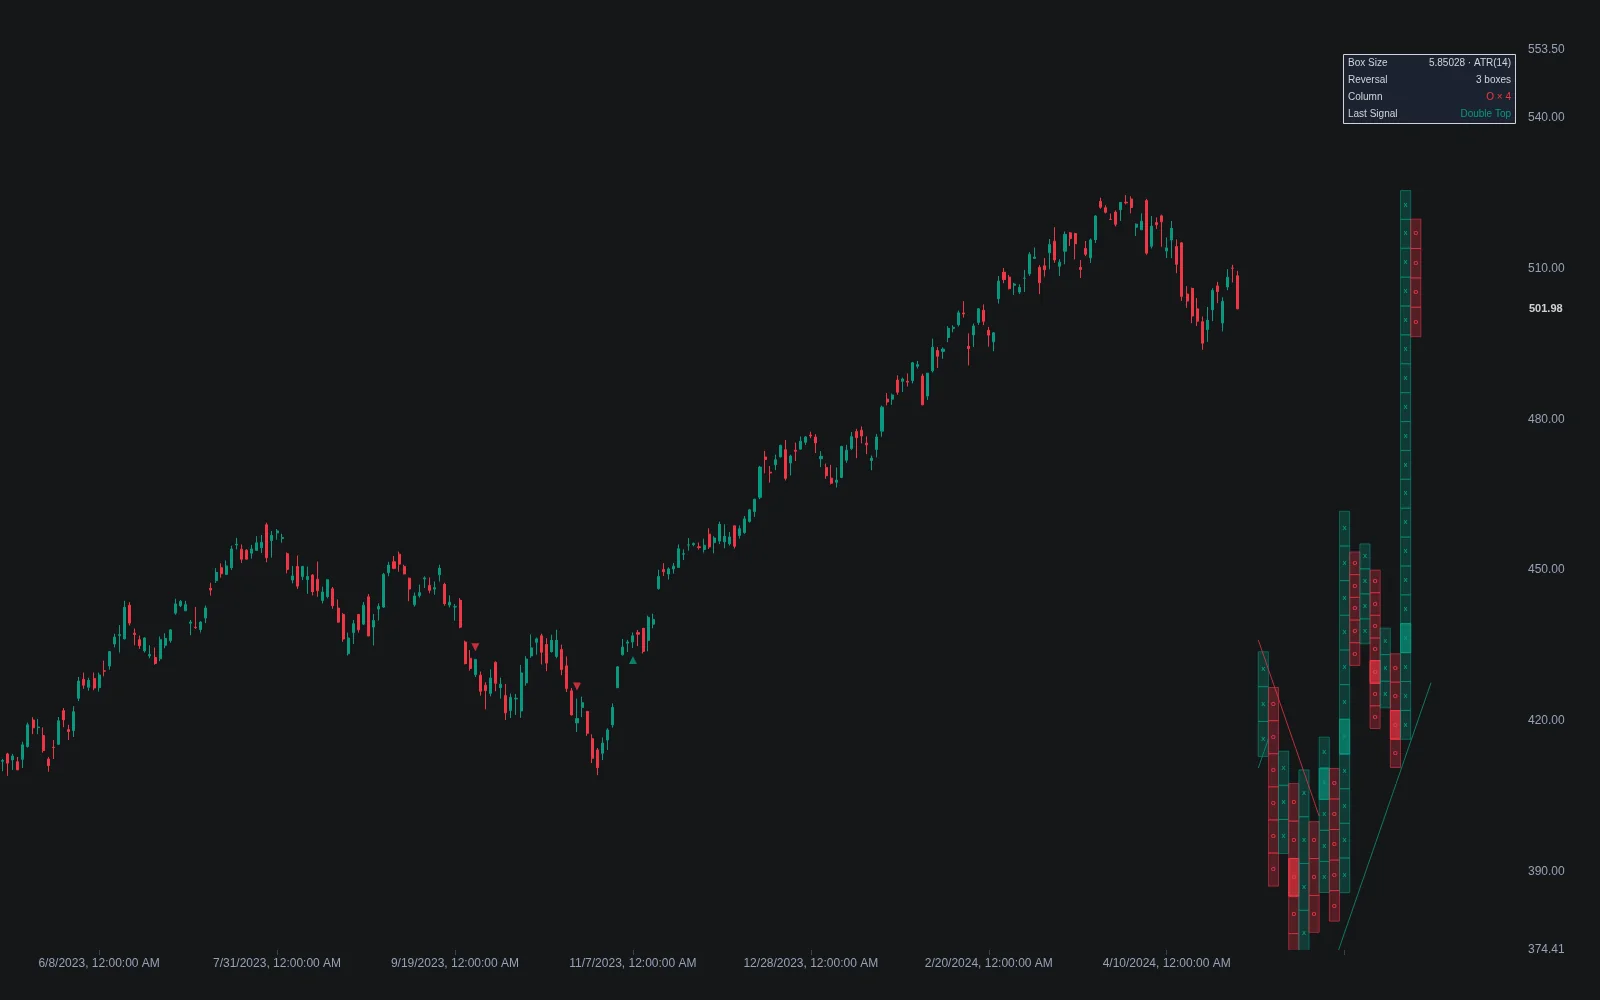
A wider pattern can generate an implausibly distant objective. Assess invalidation and executable risk separately; a target does not establish a deadline or a guaranteed move. A multi-timeframe view can add context, but it does not convert the projection into a validated probability.
Check the Arithmetic Behind Strategy Claims
Consider a hypothetical dip strategy with a 3% profit outcome and a 10% loss outcome. At a 70% win rate, its simplified average return is 0.70 × 3% − 0.30 × 10% = −0.9% before costs. At 80%, the result is +0.4%. The breakeven win rate before costs is 10 ÷ (10 + 3), or about 76.9%. A broad “70–80% success rate” therefore does not establish profitability.
An entry described as reclaiming the 50-period moving average after a 2% drop still needs a reference for that drop, a signal timeframe, fill assumptions and a precise exit. Likewise, “RSI below 35, exit when a 9-period average crosses a 50-period average on 15-minute bars” is a hypothesis to test, not evidence of an effective bullish-market strategy.
Win rate and payoff ratio alone cannot justify monthly dollar forecasts for a $20,000 account. You also need trade frequency, position sizing, costs, available capital, overlap and the distribution of losses. Avoid translating selected historical metrics into a promised income figure.
Risk Assessment Beyond the Count
- Review maximum drawdown and the equity path, not just the final profit. Specify whether equity includes open-position changes.
- Measure exposure and concentration across simultaneous trades; several correlated positions can lose together.
- Define the initial risk unit before entry if reporting R-multiples. Keep realized R separate from the planned reward-to-risk ratio.
- Document the return frequency, risk-free-rate treatment and annualization when comparing Sharpe ratios. A fixed threshold such as 0.75 is not a universal acceptance rule.
- Check sensitivity to fees, spreads, slippage and missed fills rather than assuming the original backtest is executable.
A 1% account-risk allowance is an illustrative sizing choice, not a requirement suitable for every trader. Read the LuxAlgo guide to trade risk and consecutive losses for the relationship between sizing and drawdown. A stop order does not guarantee a maximum loss at its trigger price.
Widening a stop while leaving quantity unchanged generally increases planned loss exposure for a simple linear position. Recalculate size when changing the stop distance. Protective puts have premiums, expiration and contract-matching constraints; sector rotation can change exposure but is not a guaranteed hedge. Treat both as separate strategy choices requiring their own evidence.
Probability and Statistics: Video
The retained QuantProgram video, published July 31, 2021, introduces probability-distribution ideas using a historical Apple example. Its TradingView/Pine Script presentation is separate from LuxAlgo’s native platform. A fitted distribution or historical frequency does not guarantee that future returns follow the same pattern.
Build a Repeatable LuxAlgo Research Workflow
Start with LuxAlgo’s native charts to define the market, timeframe and signal conditions. For a supported strategy, ask Quant, our coding agent to implement those rules. Inspect the generated code and run it manually, then review the strategy settings and individual trades to confirm that the events and executions match your definition.
Use standard candles for execution-oriented testing and document costs, sizing and the test interval. A point-and-figure projection needs its own explicitly supported charting or implementation workflow; do not treat a normal candlestick chart as an automatic P&F counter. Synthetic chart levels are not necessarily tradable prices.

The native journal supports review of recorded trading activity. Reconcile imports with broker records and label the strategy version, setup and market conditions in your research notes. Keep simulated strategy trades separate from actual fills when interpreting results.
Organize related experiments in a workspace, as demonstrated below. Save the rules and settings with each run rather than keeping only the best headline number.
Review Results Without Overfitting
Choose the primary evaluation measures before optimizing. Compare meaningful periods and market conditions, inspect both winners and losers, and retain a later sample that did not determine the settings. A one-, three- or five-year summary is useful only when the data coverage and strategy horizon make that comparison meaningful.
Document changes as hypotheses. If results deteriorate, first check data quality, execution costs and whether the rules were followed. Automatically adjusting parameters after every loss can hide the difference between ordinary variation and a genuine change in the strategy’s behavior.
The practical objective is a reproducible record: what was counted, when it became known, how it was traded and how the result was measured. That makes a simple metric more useful than an impressive number with an unclear denominator.
Frequently Asked Questions
Is profit factor the same as the payoff ratio?
No. Profit factor divides total winning profits by absolute total losing losses. The payoff ratio compares the average winner with the absolute average loser.
Can a high win rate still lose money?
Yes. Large losses and trading costs can outweigh frequent small gains. Evaluate the full outcome distribution and net results.
Does a point-and-figure count give a probability?
Not by itself. It produces a chart-based price objective under a stated counting method. A probability estimate requires separate statistical evidence.
Does positive historical expectancy guarantee future profit?
No. It summarizes a particular sample and its assumptions. Costs, execution and changing conditions can alter later results.
What should I check before comparing two backtests?
Match the data, dates, trade definitions, sizing, costs and calculation conventions. Inspect individual trades and the equity path as well as headline metrics.
Read next