Cumulative Volume Delta Explained
Cumulative Volume Delta (CVD) adds each bar’s volume delta to a running total from a chosen starting point. It helps compare directional trading activity with price, but it does not identify institutions, guarantee a reversal, or measure every participant’s sentiment.
Start with CVD on LuxAlgo’s native charts to examine activity alongside price. Then use Quant to develop and test a precisely defined rule, checking that the required data is available to the strategy. Before interpreting the line, establish how the tool classifies volume and when its running total resets.
How Cumulative Volume Delta Works
The CVD Calculation
For a total-volume implementation:
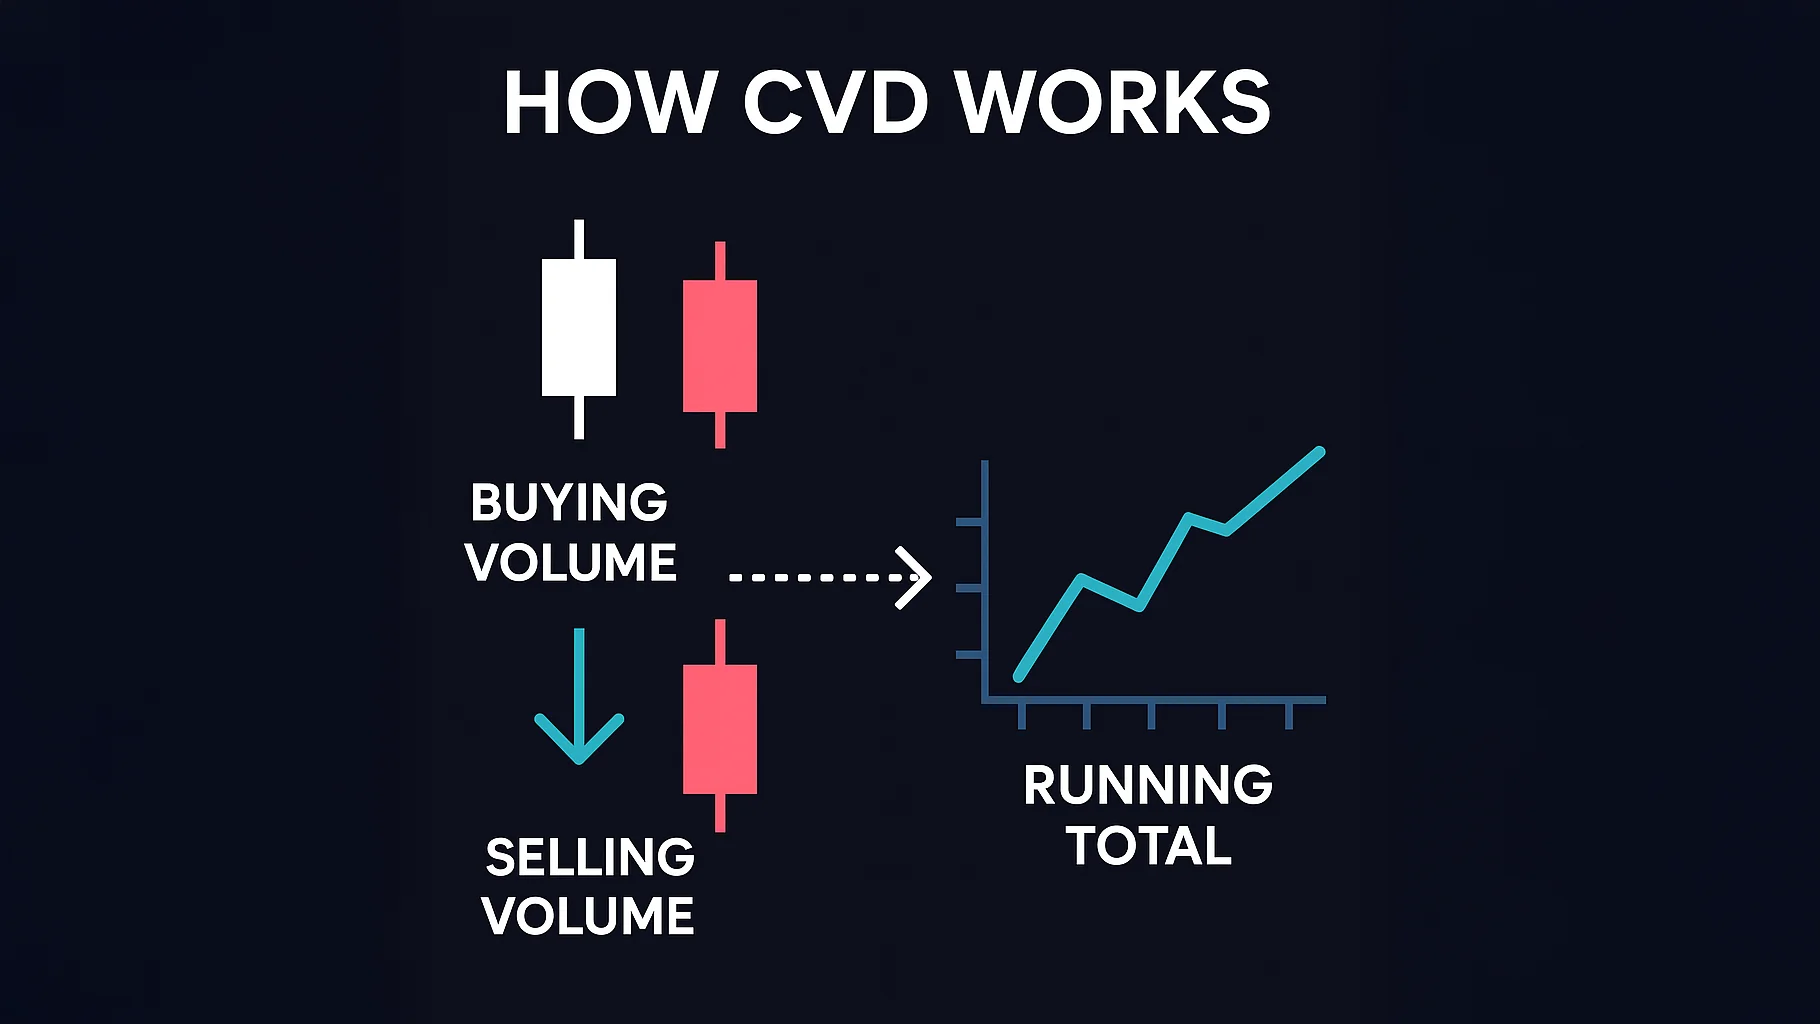
Bar delta = classified buy volume − classified sell volume
CVD = previous CVD + current bar delta, except at the chosen reset.
Every executed trade has both a buyer and a seller. In an aggressor-based feed, “buy volume” generally refers to buyer-initiated trades and “sell volume” to seller-initiated trades. Other indicators estimate direction from lower-timeframe candles instead. These methods can produce different results, so the labels alone do not establish how a particular CVD was calculated.
| Bar within one anchor period | Buy volume | Sell volume | Bar delta | CVD from zero |
|---|---|---|---|---|
| 1 | 1,200 | 700 | +500 | +500 |
| 2 | 600 | 900 | −300 | +200 |
| 3 | 400 | 800 | −400 | −200 |
This hypothetical example uses comparable volume units and no reset between bars. At bar 2, CVD remains positive even though the latest delta is negative. Its sign describes the accumulated balance since the anchor; its change describes more recent activity. A daily reset would begin a new calculation rather than carrying the previous day’s total forward.
CVD Is Different from Ordinary Volume
Total volume measures activity without subtracting one side from the other. Delta measures the directional difference under a stated classification, while CVD accumulates that difference. Trade count measures the number of prints rather than the number of shares or contracts exchanged.
Two bars can have the same total volume and very different deltas. Likewise, a high-volume bar with nearly balanced sides can add little to CVD. None of these observations identifies whether the traders were retail, institutional, opening positions, or closing them.
Set Up CVD on LuxAlgo’s Native Charts
Open Indicators → Orderflow and add Cumulative Volume Delta. Native CVD uses footprint buy/sell volume, requires a footprint-capable symbol and fixed-duration bars, and is unavailable on monthly chart timeframes. Check data coverage first.
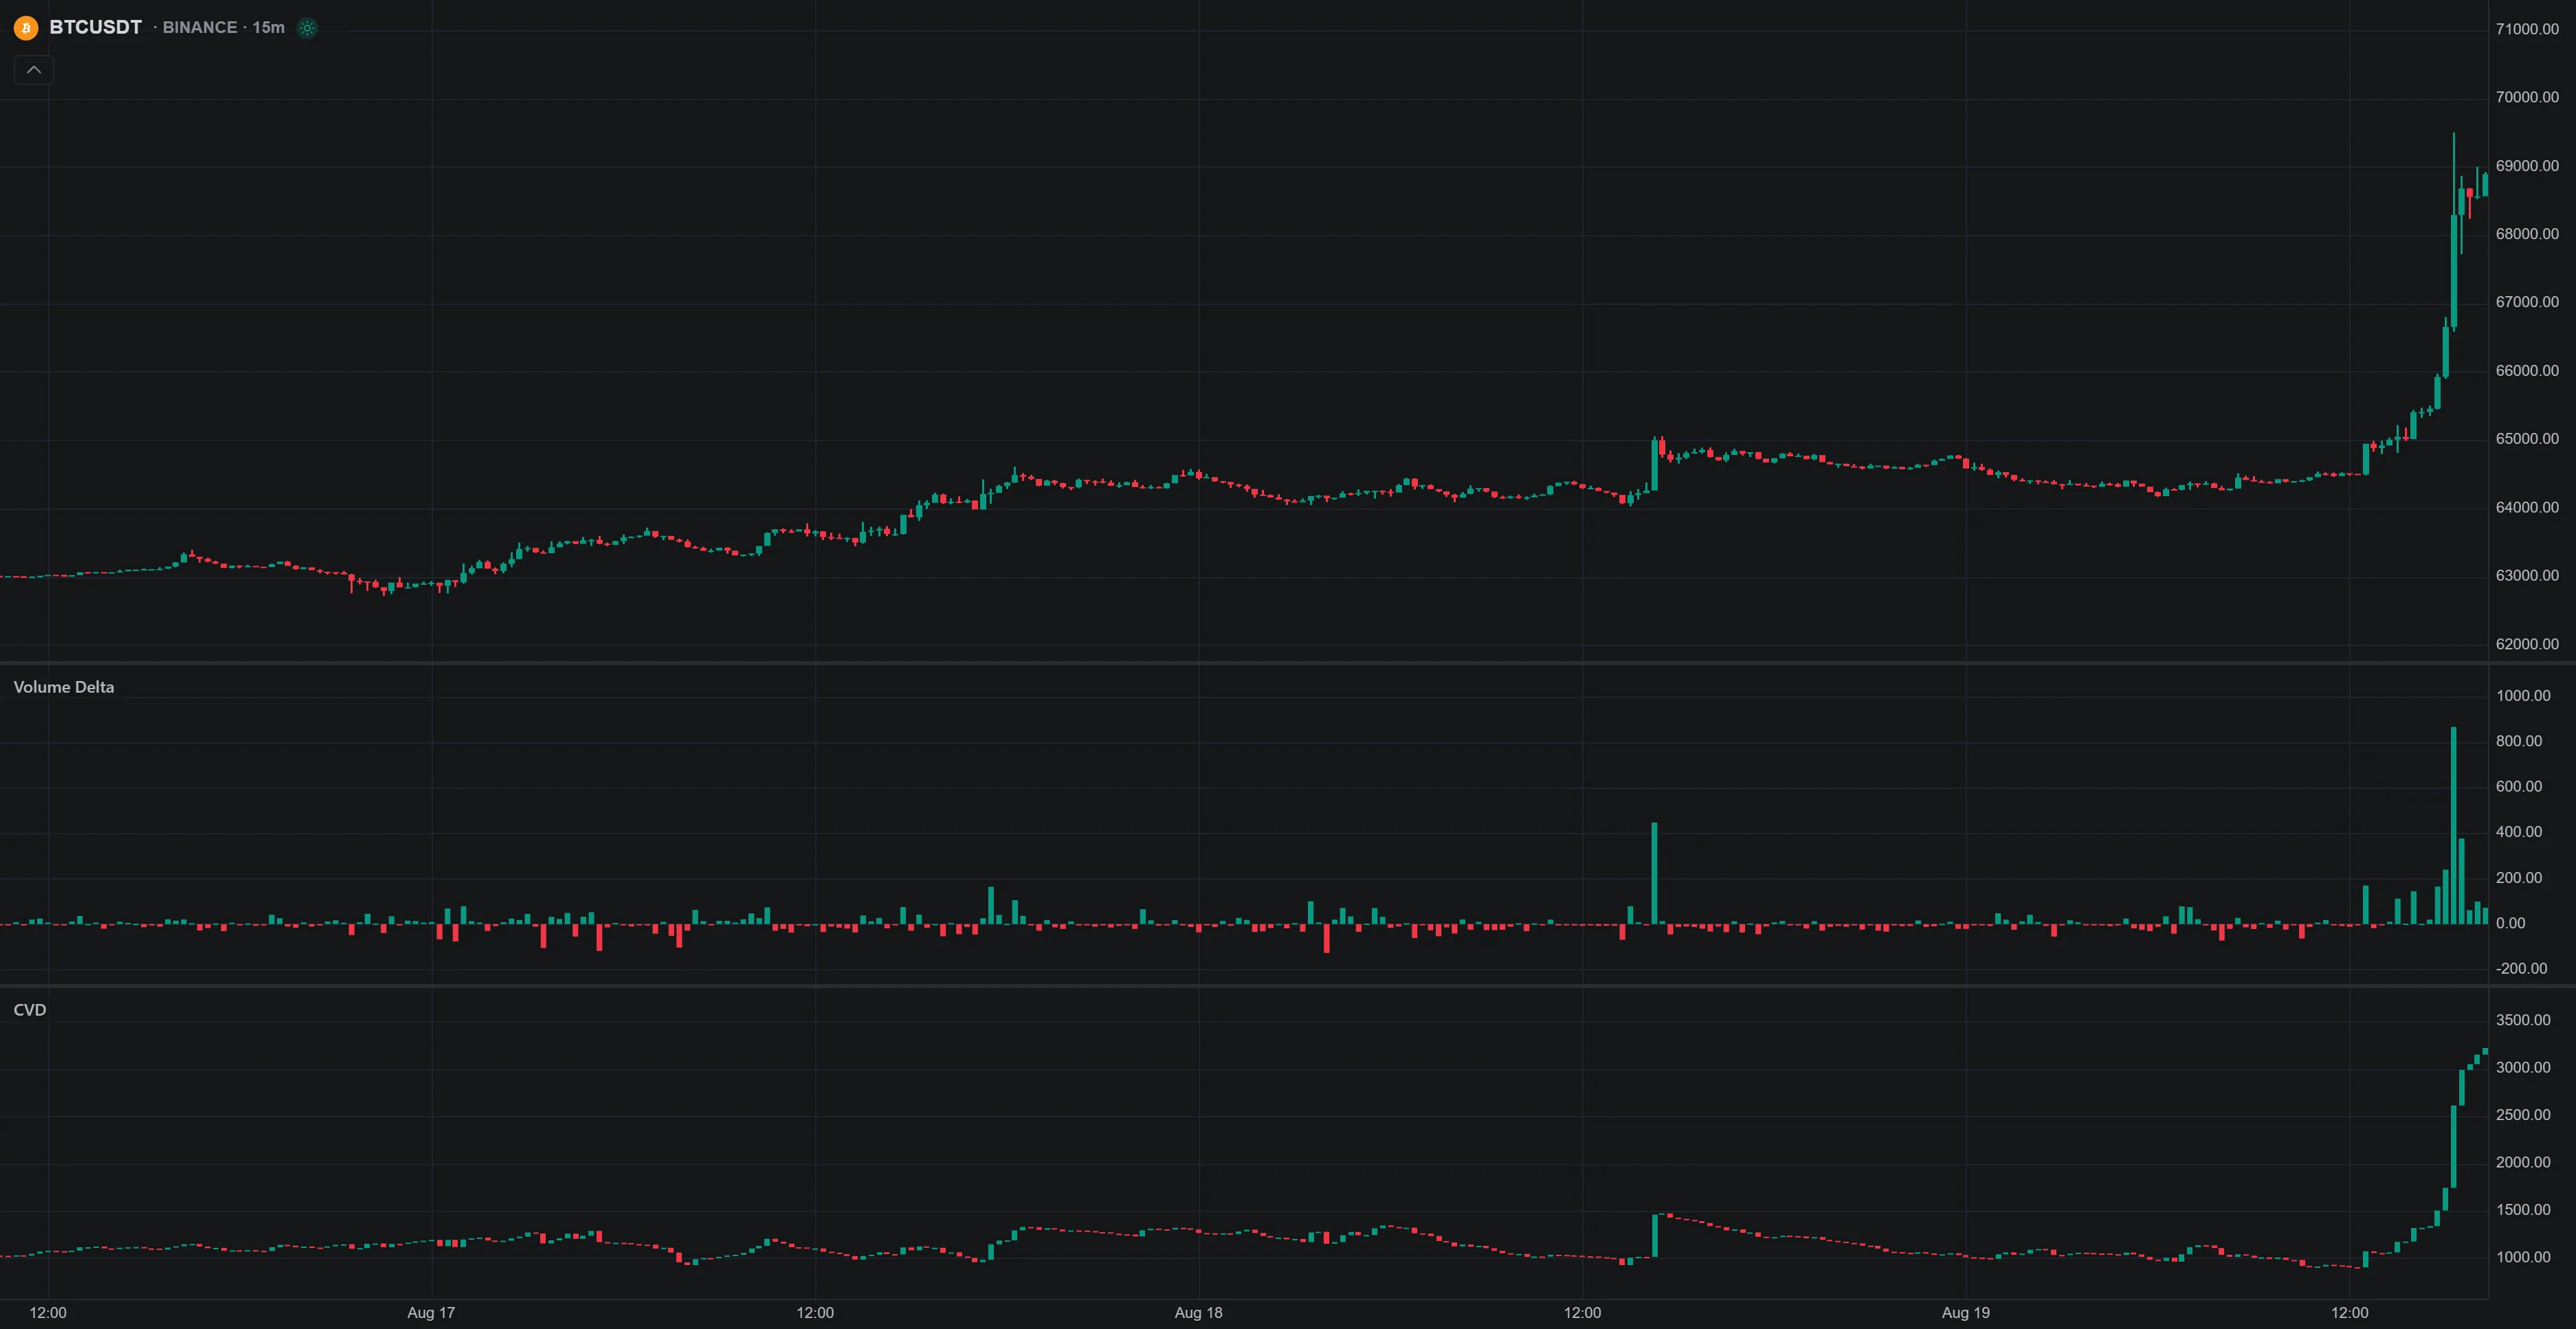
CVD supports Candles, Line, and Area styles. Its UTC anchors are Day, Week, Month—the default—or All data. A Month anchor controls the reset period; it is distinct from selecting a monthly chart timeframe.
Total mode accumulates differences in traded volume. Average mode uses differences in average trade size per side, so it is a different measure; it requires per-side trade counts, with gaps when those counts are missing. Review the native Volume Delta and CVD settings rather than interpreting both modes as total net volume.
Using CVD with Price Action
Price and CVD moving in the same direction describe alignment in the observed data. They do not independently establish a profitable entry. A price breakout can fail even while CVD rises, and a falling CVD line does not force a breakdown.
| Price observation | CVD observation | Question to investigate |
|---|---|---|
| Break above resistance | Rising over the same interval | Does the predefined breakout or retest rule hold after costs? |
| Break below support | Falling over the same interval | Does price continue or reclaim the broken level? |
| Consolidation | Rising | Does price eventually break upward, or does buying fail to move it higher? |
| Consolidation | Falling | Does selling move price lower, or does the range hold? |
For example, suppose price repeatedly tests a premarked resistance zone while CVD rises. That is evidence of increasing cumulative delta under the selected method, but it is not a confirmed breakout. Write down the price condition needed to enter and what would invalidate it.
Identify CVD Divergences Carefully
- Regular bullish divergence: price makes a lower low while CVD makes a higher low at the corresponding swings.
- Regular bearish divergence: price makes a higher high while CVD makes a lower high at the corresponding swings.
These mismatches are candidates for further analysis, not proof of hidden accumulation, distribution, or manipulation. A divergence may persist while price keeps trending. Price falling while CVD rises also warrants investigation, but a broad opposing slope is not necessarily the same as a defined pair of swing divergences.
Compare corresponding timestamps, use a consistent anchor, and check whether a reset separates the swings. If a pivot requires later bars to confirm, the signal becomes available only after those bars arrive. A backtest that enters at the earlier pivot using that later confirmation includes information the trader did not yet have.
Use Other Indicators for a Specific Purpose
A moving average can define a trend filter; RSI can describe momentum; Bollinger Bands can frame price relative to recent volatility. Decide what each condition adds, then test the combined rule. Several price-derived indicators are not independent votes, and adding them does not automatically improve accuracy.
For more context, see using volume for trend confirmation and volume-based support and resistance.
CVD on TradingView and Other Platforms
TradingView’s built-in CVD estimates directional volume from intrabar price movement and accumulates it over an anchor period. Lower intrabar timeframes offer more granular estimates with less historical coverage; larger ones extend coverage with less precision. This is a different method from classifying individual executions by aggressor side.
Video: Volume Delta and CVD on TradingView
This official TradingView tutorial demonstrates its Volume Delta and CVD indicators. Its platform controls and estimation method are separate from LuxAlgo’s native implementation.
When comparing platforms, inspect the instrument feed, classification method, historical coverage, reset controls, and strategy access. A platform name or a “real-time” label does not guarantee consolidated volume, trade-by-trade aggressor data, or identical calculations. In forex, broker-specific tick activity is not the entire market’s traded volume; in crypto, venue coverage matters.
Keep Library Tools and CVD Distinct
The Library’s momentum and money-flow tools are separate from CVD. A divergence or money-flow display is not automatically a CVD calculation.
The Volume Delta Candles and Volume Delta Methods (Chart) Library indicators offer other implementations to investigate. Read each indicator’s method and supported environment before comparing its values or trying to reproduce it in a strategy.
Turn a CVD Idea into a Testable Strategy
- Specify the data and calculation. Name the symbol, venue, chart interval, classification method, mode, and anchor.
- Define the price setup. Use an observable condition such as a completed close above previously established resistance.
- Define the CVD condition. For example, compare CVD at the current completed bar with its value three bars earlier within the same anchor period. This is a candidate rule, not a recommended universal setting.
- Specify exits and sizing. Include the stop, target or exit rule, risk budget, and execution assumptions.
- Review Quant’s implementation. Confirm that the script can access the required inputs, handles resets correctly, and does not substitute a different delta method without making that change explicit.
- Compare results fairly. Test the price-only setup and the same setup with CVD, include costs, inspect individual trades, and reserve later data for validation.
Use native strategy properties and results to examine net performance, drawdown, and trade behavior. A script running successfully does not prove it represents the intended signal or will perform well in live trading.
Manage Risk Independently of the Indicator
A strong-looking divergence does not justify unlimited leverage or a larger loss allowance. In a hypothetical share trade, an entry at $50, stop at $48, $200 risk budget, and $0.10 per-share cost allowance permits floor($200 ÷ $2.10) = 95 shares, with planned risk of $199.50. Actual losses can be greater if execution differs.
Account for contract value when trading other instruments and include existing exposure. The CME position-sizing guide explains the relationship between stop distance and size. A CVD reading does not change that arithmetic.
Common CVD Mistakes to Avoid
- Equating positive with rising. CVD can be positive and falling, or negative and rising.
- Ignoring the anchor. A reset is a calculation boundary, not a sudden market reversal.
- Comparing unlike data. Different venues, modes, sessions, and estimation methods can produce different curves.
- Treating gaps as zero. Missing inputs are unavailable evidence, not proof of balanced trading.
- Reading participant identity into volume. CVD does not separate institutions from retail traders or reveal their motives.
- Using hindsight pivots. Record when a divergence could actually have been recognized.
- Assuming longer timeframes are always better. Choose an interval and anchor that fit the question, then check data coverage and sample size.
Begin with one market and a fixed setup. Keep examples of failures as well as successes, and change rules only through a deliberate testing process. Intraday and longer-horizon analysis use the same need for consistent definitions; neither horizon makes CVD predictive by itself.
FAQs
What does cumulative volume delta show?
CVD shows the accumulated difference between directionally classified volumes since a chosen anchor. Interpret its level and slope separately and check the calculation method. It does not identify participants or guarantee the direction of price.
What is the cumulative delta function?
In a total-volume implementation, it adds each bar’s buy volume minus sell volume to the previous running total, resetting at the specified boundary. Estimated candle-direction versions use their own classification rules, and average-trade-size modes measure something different.
How can traders use CVD?
Compare it with price at defined levels or corresponding swings, specify an entry and invalidation rule, and test the strategy with realistic costs. Check anchors, data availability, and signal timing before treating a divergence or aligned move as useful evidence.
Read next