Cup and Handle Pattern Success Rates Explained
There is no single cup-and-handle success rate that applies to every market, timeframe, and trading rule. Historical target attainment, breakout failure, and a trader’s realized win rate measure different things. Before using a percentage, check its sample, definition of success, and exit assumptions.
Use LuxAlgo’s native charts and Quant, our coding agent, to turn a recognizable chart idea into explicit rules you can review and test. The pattern can organize a trading hypothesis; it cannot guarantee a profitable breakout.
What the Cup and Handle Pattern Shows
A traditional bullish continuation interpretation starts with a prior advance, followed by a rounded consolidation and recovery toward the earlier high. A smaller pullback or trading range forms the handle. A breakout above the chosen resistance level is the event to evaluate—not the appearance of a bowl alone.
StockCharts’ formation guide describes a rounded cup, a shorter handle, and expanding breakout volume. Its duration and retracement guidelines are descriptive conventions, not a formula that guarantees success. Daily and weekly patterns can take months; an intraday resemblance is not automatically covered by historical stock-pattern statistics.
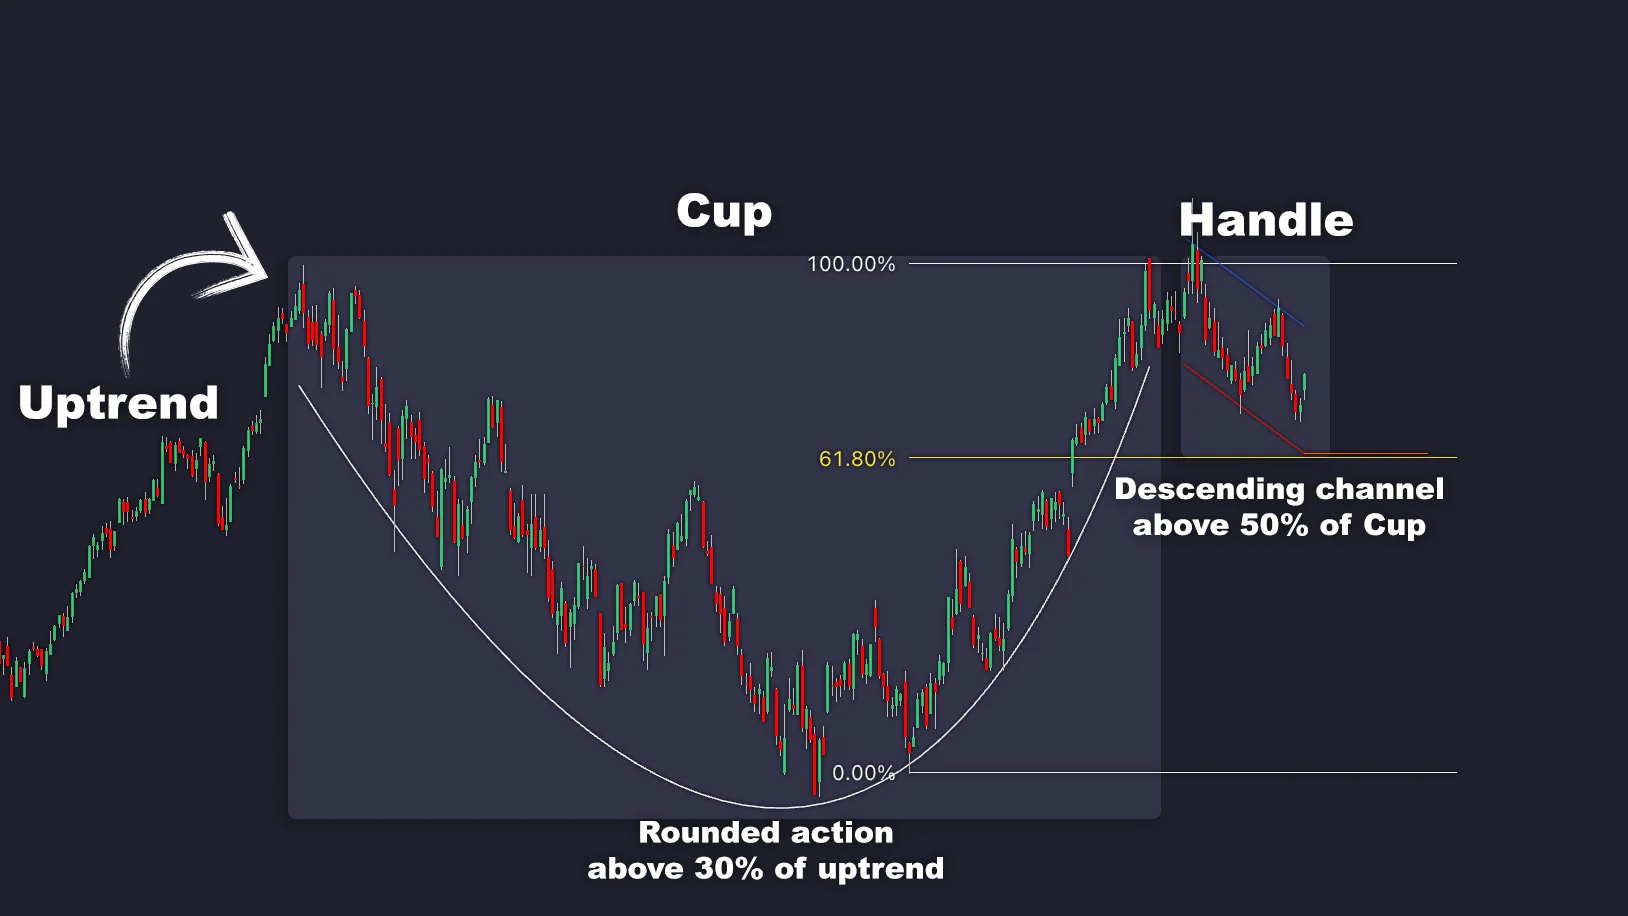
Define measurements consistently. Cup depth as a percentage of the rim price differs from retracement of the preceding advance. Handle depth relative to the cup also differs from the handle’s own percentage price decline. Mixing these denominators produces contradictory rules.
What the Historical Statistics Actually Measure
Thomas Bulkowski’s cup-with-handle page, reviewed September 7, 2026, reports the following bull-market results from 913 historical “perfect trades.” These are study statistics, not a live account’s returns or a forecast for the next setup.
| Reported measure | Result | How to interpret it |
|---|---|---|
| Meeting the price target | 61% | Historical target attainment under the study’s rules |
| Break-even failure | 5% | Failure to advance at least 5% after an upward breakout |
| Average rise | 54% | Movement to the subsequently identified ultimate high, not a realizable exit promise |
| Throwback | 62% | A separate measure of return toward the breakout area, not a losing-trade rate |
The study glossary defines average rise from the opening price after breakout to the ultimate high. That high is identified using subsequent price behavior, including a 20% decline criterion and end-of-data conditions. A trader cannot assume they would know that peak in advance.
Consequently, 5% break-even failure does not mean a strategy wins 95% of trades. A stop may be hit before a later advance, and costs and execution can change outcomes. Likewise, target attainment does not specify your holding period or portfolio return.
The often-repeated progression of 70%, 80%, and 85% success over one, five, and ten years is not established by these figures. Longer holding periods do not mechanically improve every setup’s probability. Report results for the actual rules and sample instead of combining unrelated percentages.
Calculate the Target and Risk Separately
A conventional measured-move projection adds the cup’s height to the breakout level. It is a planning reference, not a guaranteed destination. Suppose an illustrative cup has a rim at $100 and a low at $80. Its height is $20, giving a $120 projection from a $100 breakout reference.
If an entry fills at $101 and a planned stop is $95, the initial price risk is $6 per share and the projected reward is $19. The planned reward-to-risk ratio is about 3.17:1 before costs. A later entry at $108 with the same stop and target gives only $12 of projected reward against $13 of risk. The pattern itself does not provide a fixed 2.5:1 ratio.
A stop below the handle may be one rule to investigate, but it needs an explicit buffer and position-sizing method. Gaps and slippage can produce a worse exit than planned. An indicator’s liquidation estimate is not a protective order and does not automatically place a stop.
Use Volume and Market Context Carefully
Compare breakout volume with a defined baseline, such as prior completed bars, and state whether the current bar is complete. Test any threshold instead of presenting “40% above average” as universally required. An arbitrary percentage change in cumulative OBV is not equivalent to a percentage increase in traded volume.
Know the data source. Exchange-specific crypto volume, a particular equities feed, and forex tick activity are not interchangeable measures of total market participation. Money-flow or delta readings do not establish the identity of institutional buyers.
A broader trend filter may help or hurt a particular strategy. Compare the same entry and exit rules with and without it, including the trades it removes. Do not assume a moving-average filter halves failures without a reproducible test.
Test the Pattern in Native LuxAlgo Charts
Start with the intended symbol, interval, session, and standard candles in native LuxAlgo charts. Mark the candidate rims, cup low, handle range, and breakout reference. Review failed formations as carefully as attractive examples.
This short native demonstration shows organizing and switching workspaces, useful for keeping a consistent research layout.
Before asking Quant for a strategy, specify the following:
- How the prior trend, rims, cup low, and handle are identified.
- Permitted duration, depth, rim mismatch, and handle retracement.
- Whether confirmation requires a completed close above the handle, rim, or another level.
- When the simulated entry occurs and how stops, targets, and time exits interact.
- Position sizing, costs, overlapping signals, and the rule for rejected setups.
Review Code, then Run the strategy and inspect individual trades. If pivots require future bars to confirm, an entry must wait until those bars exist; plotting a label back on an earlier candle does not make it available then. A visually recognized pattern also needs a reproducible definition before it can support a meaningful automated test.
Evaluate separate periods and market conditions, including costs and drawdowns. Keep a record of parameter trials to avoid selecting a lucky version of history. See in-sample and out-of-sample testing and execution limitations in backtests. A library pattern detector or a database of other strategies does not, by itself, validate your custom cup-and-handle rule.
FAQs
What is the success rate of the cup and handle pattern?
There is no universal rate. Bulkowski reports 61% target attainment in a historical bull-market sample of 913 perfect trades, which is different from a live strategy’s win rate. Your result depends on identification, entry, exit, risk, costs, market, and test period.
How do you calculate the cup-and-handle price target?
Measure the distance from the cup’s rim to its low and add that height to the chosen breakout reference. Treat the result as a projection, then calculate risk from the actual entry and stop. The target may not be reached.
Read next