Cup and Handle Swing Trading Strategy Guide

The cup and handle is a bullish continuation pattern: an advance gives way to a rounded consolidation, price recovers toward the earlier high, and a smaller pullback forms the handle. Swing traders watch for a breakout, but the shape alone does not establish an entry, a success rate, or a guaranteed target.
A useful plan separates pattern identification from execution. Mark the cup, define handle resistance, decide what counts as confirmation, and calculate position size from a stated invalidation level. LuxAlgo's native charts and Quant, our coding agent, can help turn that plan into an inspectable research workflow.
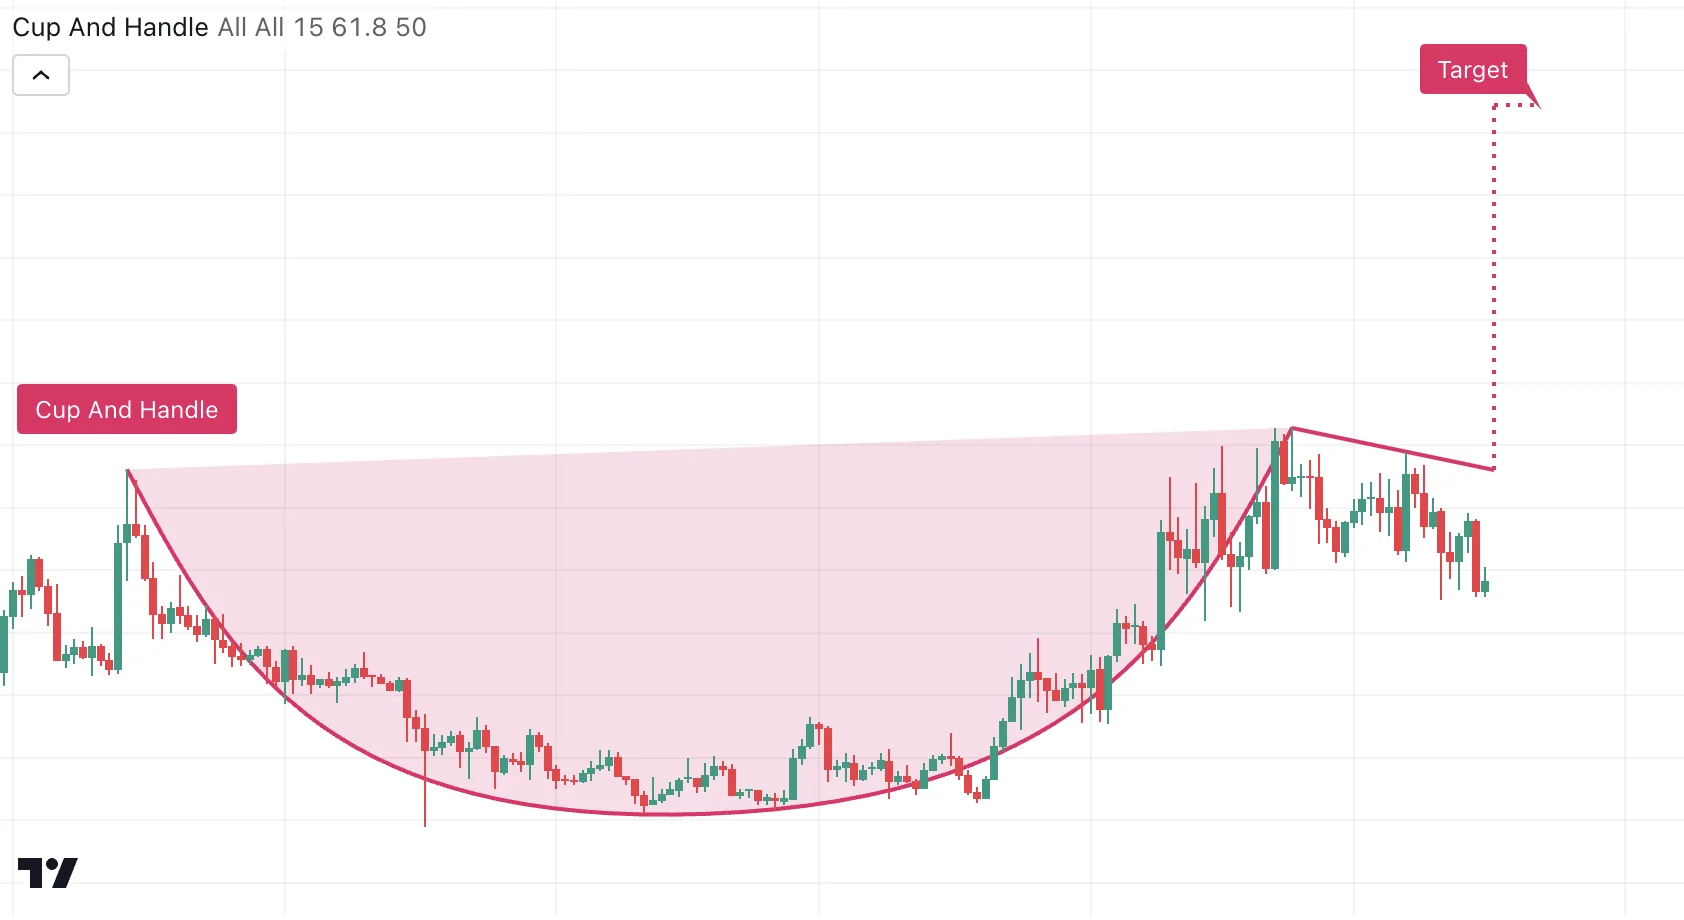
Identifying the cup and handle pattern
Fidelity's cup-with-handle guide describes a rounded base after an advance, followed by a smaller consolidation on the right. It gives roughly one to six months for the cup and one to four weeks for the handle as typical stock-chart guidelines, with exceptions. These are recognition conventions, not a universal clock for every market or timeframe.
| Component | What to identify | What needs caution |
|---|---|---|
| Prior trend | An advance before the base. | A similar shape during a downtrend is a different context. |
| Cup | A rounded base with identifiable left and right rims. | A sharp V-shaped rebound or a shape chosen only after a large rally. |
| Handle | A smaller consolidation near the upper part of the cup. | A deep decline that undermines the recovery rather than a modest pullback. |
| Breakout | A move through the predetermined resistance level. | An intrabar move that closes back inside the handle. |
| Volume | Activity evaluated against a clearly defined baseline. | Comparing different sessions, venues, or incomplete and completed candles. |
Measure depth consistently
Do not interchange a percentage decline from the rim with a percentage retracement of the previous advance. Suppose price rises from 60 to 100, then the cup bottoms at 80. The cup is 20 points deep: a 20% decline from the 100 rim, but a 50% retracement of the 40-point advance. Calling both “20% depth” would describe different measurements.
Handle depth also needs a denominator. If the right rim is 100 and the handle low is 95, the handle declines 5% from the rim. Relative to a recovery from 80 to 100, that is a 25% retracement. Write the formula into your screening rules instead of mixing fixed percentage ranges.
StockCharts' pattern discussion treats depth and duration as guidelines with variation, rather than rigid guarantees. Deeper cups, long handles, and unusually sharp recoveries should be classified consistently and tested separately. Wider stops do not make a weak formation safe.
Volume and timeframe confirmation
Daily charts can make a multiweek stock setup easier to organize; weekly charts supply broader context. A four-hour chart can help inspect the handle, but it does not validate a daily breakout before that daily candle closes. Use the last completed higher-timeframe candle when testing a rule that requires its final values.
Expanding breakout volume is a common confirmation convention. A rule such as “volume at least 1.5 times the average of the previous 20 completed daily bars” is one testable choice, not an established requirement for every instrument. Exclude the signal bar from that average. Keep the trading session and data source consistent; exchange volume and broker tick volume are not interchangeable measurements.
Price and volume do not identify who traded. Institutional accumulation and a shakeout of weak holders are interpretations, not facts established by the cup's shape.
Entry strategies for cup and handle swing trading
Breakout entry method
Choose the resistance definition before the signal: for example, the handle's highest price during a fixed formation window, or a defined sloping boundary. If the right cup rim remains above that boundary, decide whether your strategy also requires clearing the rim. Keep that choice consistent.
A completed-bar approach waits for a close above resistance, applies any preselected volume filter, and enters at the next permitted execution time. A stop-entry order placed beforehand is a different strategy with different fill behavior. Neither is adequately described as simply “buy the breakout.”
A mandatory 2–3% close above resistance may be a large move for one market and ordinary noise for another. If you use a percentage or volatility buffer, record it as a parameter and test its effect on missed trades, entry price, and remaining reward.
Retest entry method
A retest approach waits for price to revisit the breakout area. It can offer a closer invalidation level, but some breakouts never return and some retests fail. It is not automatically safer or more profitable.
For a reproducible research variant, define a five-bar retest window after a confirmed breakout. Specify the permitted distance from resistance, the candle-close condition for holding the level, the entry time, and when the candidate expires. “Bullish reversal candle” also needs a definition; choose an explicit close or candlestick rule rather than judging it differently on each chart.
Confirming entries with indicators
Possible filters include RSI above 50, a MACD line crossing above its signal line, or rising 20- and 50-period moving averages. Specify lengths, smoothing, price source, and whether the event must occur on the breakout bar. For a daily stock test, these are daily periods.
Indicators derived from the same prices may repeat the same information. Compare the basic pattern rule with each added filter on later data, including rejected setups. More confirmation can mean fewer entries without improving net results.
Worked example: entry, stop, and target
Consider an illustrative stock setup with a right rim and handle resistance at 100, a cup low at 80, and a handle low at 95. The cup's 20-point depth suggests a measured-move reference at 120 when added to the 100 breakout level. That reference is a planning tool, not a forecast.
Suppose a breakout closes at 101 and the next opening fill is 102. The planned stop is 94.50, slightly below the handle. The actual entry-to-stop distance is 7.50 per share, while the distance to 120 is 18. The gross reward-to-risk ratio is therefore 18 ÷ 7.50 = 2.4:1.
| Item | Illustrative calculation |
|---|---|
| Account and planned loss budget | 30,000 account; 150 budget, or 0.5%. |
| Entry-to-stop distance | 102 − 94.50 = 7.50 per share. |
| Whole-share quantity before costs | 150 ÷ 7.50 = 20 shares. |
| Capital exposure | 20 × 102 = 2,040. |
| Gross target profit if filled at 120 | 20 × 18 = 360, or 2.4 times the planned loss. |
| Adverse opening execution at 92 | 20 × (102 − 92) = 200 loss before costs. |
Fees and adverse fills require allowance within the budget. A stop order does not guarantee its stop price. If the next opening price is unexpectedly high, reassess both size and reward-to-risk before entering; do not size using the earlier signal close as though that fill were assured.
The traditional full-depth projection is only one exit rule. Partial exits at fractions such as 62% of cup depth, extensions such as 161.8%, ATR-based stops, and trailing exits are separate variants. Define the anchor, activation timing, and remaining position size for each. Do not present those levels as probabilities or move the target retrospectively to match the chart.
Research the pattern in LuxAlgo
Use LuxAlgo's native charts to mark the rim, cup low, handle, and decision timestamp. The drawing tools include lines, measurements, and Fibonacci tools, with annotations anchored to chart time and price and saved in the workspace. Save the setup before the outcome develops so later review does not become a collection of obvious winners.
Once the rules are explicit, ask Quant to build a strategy for review and backtesting. Include the resistance calculation, signal timing, volume baseline, entry method, stop activation, exits, position size, costs, and test dates. A request to “trade cup and handle” leaves too many choices unspecified.
Review the generated code and several individual trades. Confirm that a pattern is first tradable when it becomes detectable, not at an earlier pivot drawn on the chart. Test the same symbol, session, and timeframe used in your specification. Native chart backtests do not automatically prove out-of-sample reliability or realistic execution through price gaps.
Half Cup is a related but different tool
The Half Cup Library page offers “Use in Quant” for native charts and access to its TradingView publication. Half Cup looks for a partial curved formation and channel breakouts. It does not require a completed cup and handle, so its signals should be evaluated as a separate strategy.
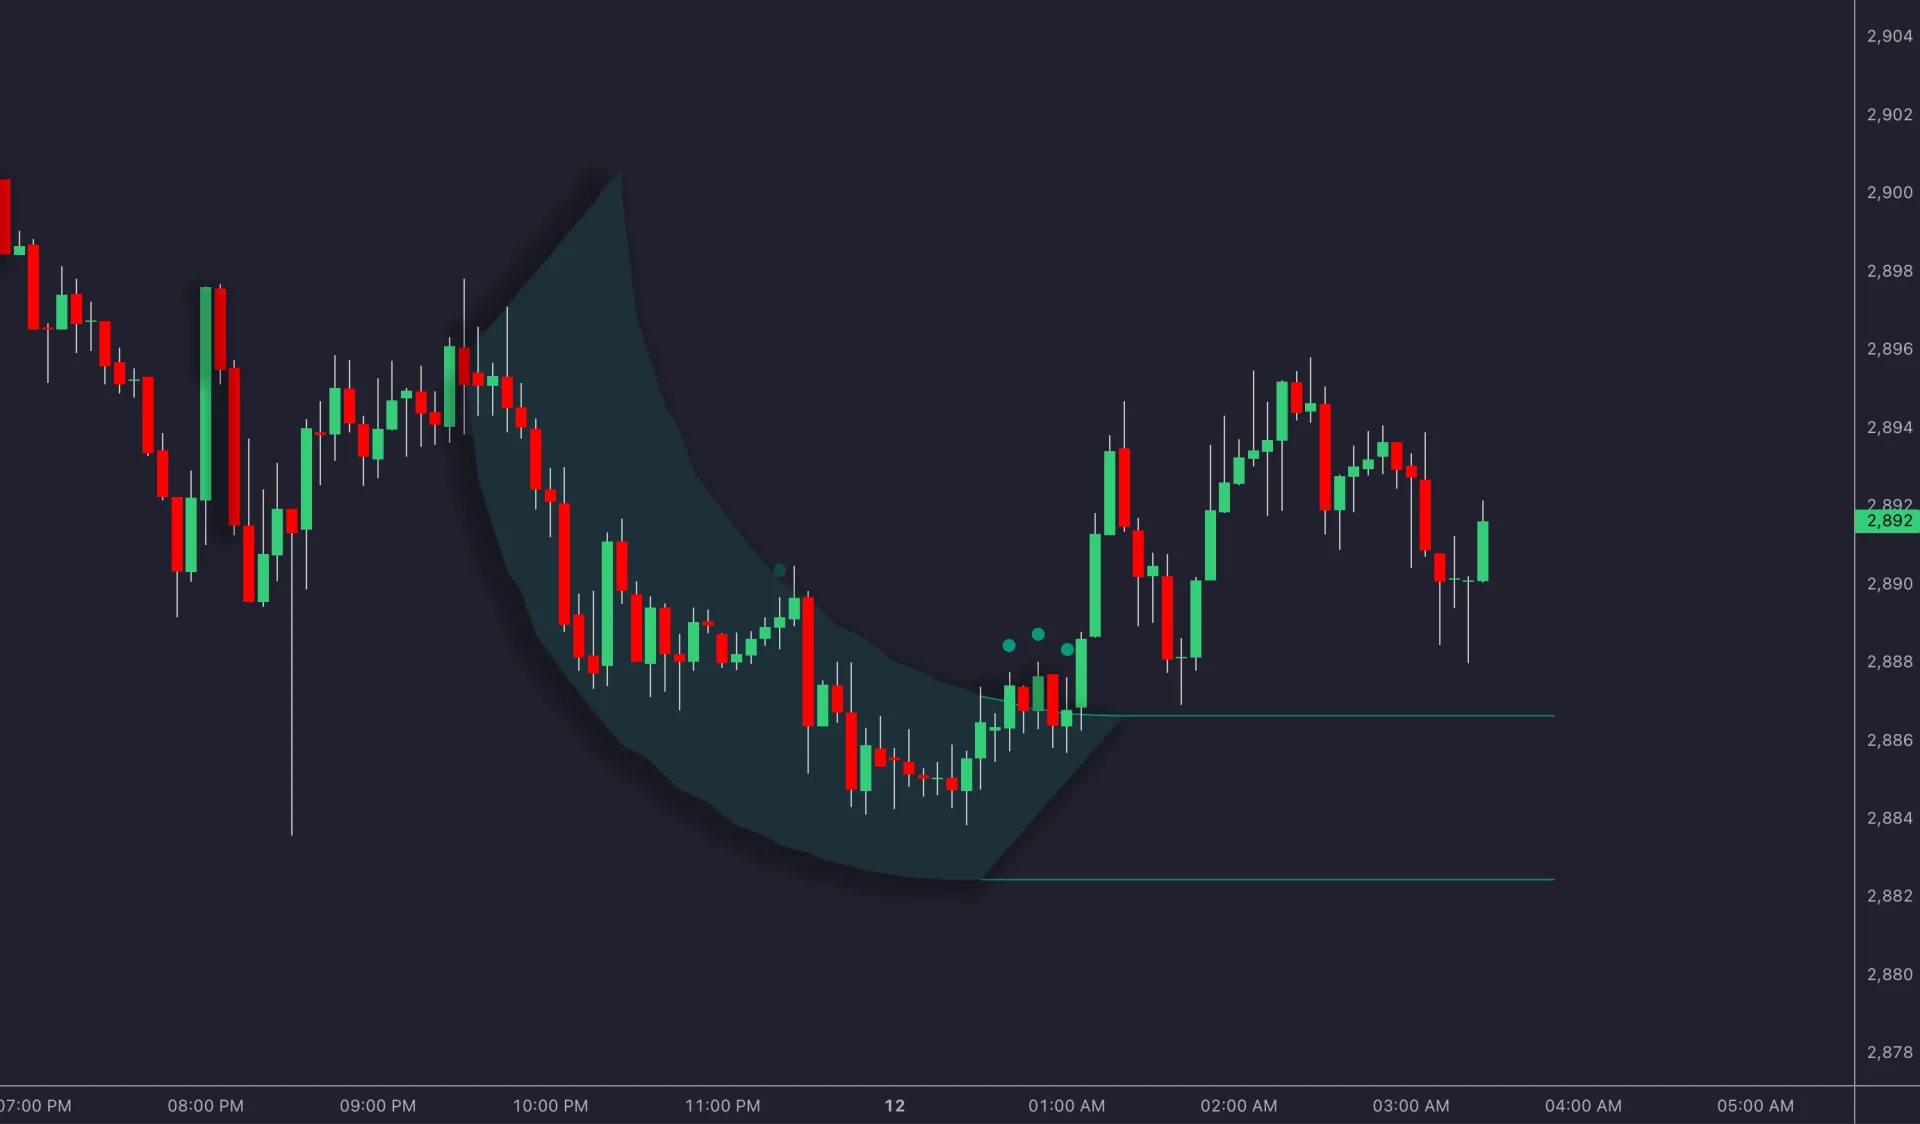
The official open-source Half Cup publication explains that patterns are backpainted, channels begin at detection, and breakout dots remain after older drawings are updated or removed. Swing Length, shape settings, validation thresholds, and Channel Length affect results. Preserve the detection timestamp and inspect the implementation before turning visual history into entry signals.
Review and common mistakes
- Recognizing patterns only after they win: Record candidates and invalidations as they become available, including failures and missed trades.
- Changing the definition: Keep cup depth, handle tolerance, volume rules, and retest windows fixed during an evaluation period.
- Ignoring earnings and gaps: State whether the strategy holds through scheduled events and test that policy consistently.
- Assuming a target will be reached: Compare exits using actual trade sequences, costs, drawdown, holding time, and exposure.
- Optimizing repeatedly on the same history: Preserve tested variants and reserve later data for the rules you select.
A reliable research record is more useful than an unsupported pattern success percentage. Judge the complete plan—recognition, timing, execution, and risk controls—on the markets and data you intend to use.
FAQs
How to trade cup and handle formation?
Identify a rounded consolidation after an advance and a smaller handle, then define resistance and a breakout or retest trigger before entering. Calculate size from the intended fill, invalidation level, and loss budget. Use cup depth as a target guideline, account for costs and gaps, and test the complete rules on later data. Neither the shape nor a volume surge guarantees a profitable trade.
Read next