Directional Filters: Enhance Your Trade Setup
A directional filter is a rule that decides which trade setups a strategy is allowed to take. For example, a system might permit long entries only when price is above a moving average, or require a minimum ADX reading before considering a trend-following signal.
Direction and strength are different questions. Moving averages and the +DI/−DI relationship can describe directional conditions. ADX measures trend strength without telling you whether price is rising or falling. Combining these tools can change which trades you take, but does not automatically improve accuracy or returns.
This guide explains moving averages, ADX and DMI, then shows how to turn a filter into explicit rules you can research with LuxAlgo’s charting and AI platform. Use Quant Charts to inspect the setup and Quant, our coding agent, to develop and test the logic.
ADX and DMI: Separate Strength from Direction
Welles Wilder’s directional movement system includes +DI, −DI, and ADX. Positive and negative directional movement compare changes in successive highs and lows; the smoothed values are scaled relative to true range. The relationship between +DI and −DI describes directional dominance, while ADX smooths a measure of their separation.
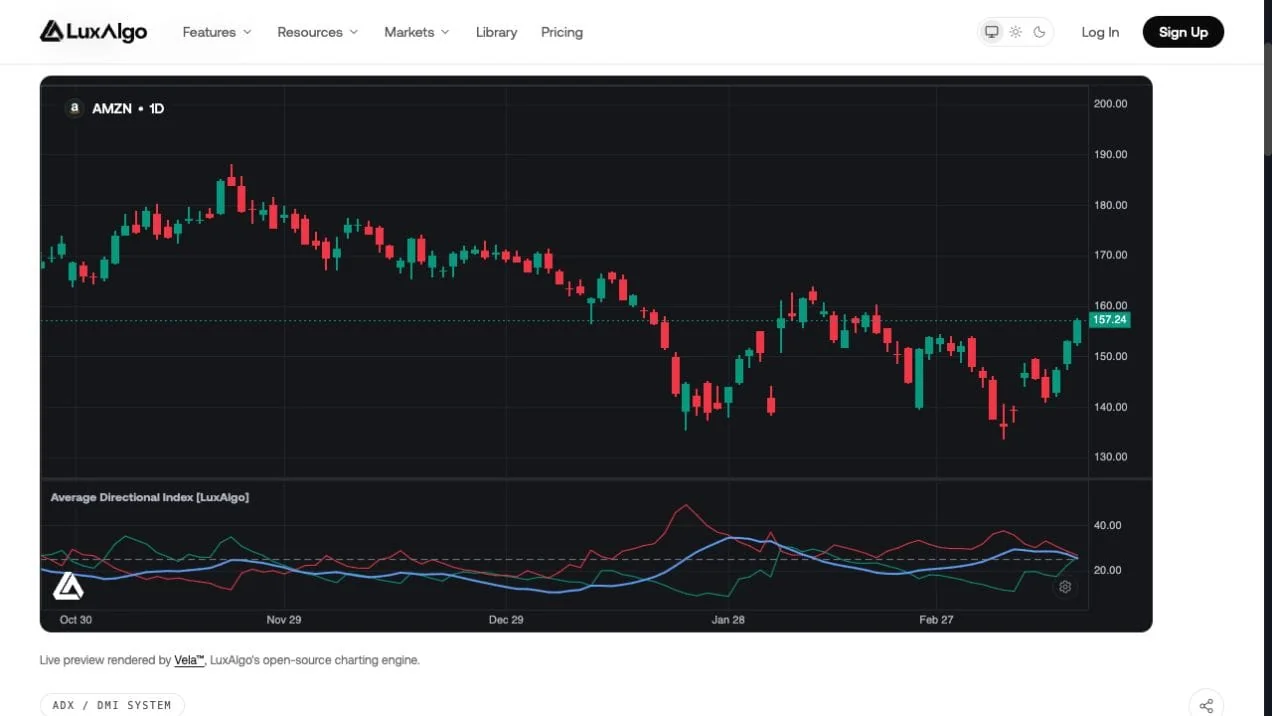
The LuxAlgo Average Directional Index indicator plots the full system. Its documented defaults are a DI Length of 14, ADX Smoothing of 14, and a Key Level of 25. These are starting settings, not proven optimal values for every instrument or timeframe.
Moving Averages: A Basic Directional Filter
Moving averages smooth price history. A rule such as “close above the 50-period average” is different from “the average is rising,” and both differ from “the fast average is above the slow average.” Specify the condition you actually want to test.
Choose the Chart Interval and the Lookback Separately
| Lookback example | On a daily chart | Potential role | Tradeoff |
|---|---|---|---|
| 10–20 bars | 10–20 trading sessions | Shorter-term trend context | Responds sooner but can change direction frequently. |
| 50 bars | 50 trading sessions | Intermediate trend context | More smoothing and later response. |
| 200 bars | 200 trading sessions | Longer-term trend context | Substantial lag; not an intraday entry trigger by itself. |
A 20-period average on a five-minute chart uses 20 five-minute bars, not 20 days. The 5–8–13 SMA combination is another short-lookback example you can investigate, but its settings alone do not define entries, exits, or profitability.
Multiple chart intervals can provide context, but a higher timeframe is not automatically more reliable. When a lower-timeframe system uses a daily filter, specify whether it uses the last completed daily bar. Using the final daily close before that day ends introduces information that was not yet available.
SMA vs. EMA
A simple moving average gives equal weight to each observation in its window. A conventional exponential moving average gives more weight to recent observations through the recurrence:
EMA = α × current price + (1 − α) × previous EMA, where α = 2 ÷ (N + 1).
For a 10-period EMA, α is about 18.18%. With a previous EMA of 100 and a new close of 102, the updated EMA is about 100.36. Earlier observations continue to influence the result with declining weights through the previous EMA; there is no single “oldest of ten” observation with a fixed 3% contribution. Initialization and available history also matter. See the StockCharts moving-average explanation.
Moving-Average Crossovers
A fast average crossing above a slow average can serve as an entry event, while remaining above it can serve as an ongoing filter. Neither is the same as a price crossover. A 50/200-day crossover on a stock such as GOOG illustrates a longer-term rule; it does not establish a profitable trade without dates, fills, exits, and costs.
Similarly, two hypothetical QQQ price legs of 0.79% and 0.80% are price changes, not automatically a strategy’s realized return. At full sequential exposure and without costs, their compounded change would be (1.0079 × 1.0080 − 1), or about 1.60%. If those legs span 51 and 35 five-minute bars, they cover 255 and 175 minutes of bar time respectively. Actual trading results depend on whether a rule captured those moves, its exposure, and its execution assumptions.
ADX: Measuring Trend Strength
Interpret ADX as a Filter, Not an Instruction
ADX conventionally ranges from 0 to 100. StockCharts’ discussion of Wilder’s system describes 20 and 25 as commonly used reference levels, with a gray area between them. These levels describe an indicator state; they do not assign a probability to the next price move.
| Reading | Common interpretation | What it does not prove |
|---|---|---|
| Below 20 | Relatively weak directional movement under this calculation | That fading the market will work or that price must remain in a range. |
| 20–25 | Transition area under a common convention | A universal boundary between valid and invalid trades. |
| Above 25 | Stronger directional movement; a possible trend-following eligibility rule | Whether to buy or sell. |
| High or falling from a high | A strong trend or a change in its measured strength | A guaranteed top, bottom, or immediate reversal. |
ADX can rise during a persistent decline and can fall while price continues moving in the same direction. Values above 50 or 75 are sometimes described as very strong or extreme, but they are not automatic hold or exhaustion signals. Read the price structure and +DI/−DI relationship separately.
Combine Tools with Distinct Jobs
- ADX + moving average: an illustrative long filter might require a completed close above a 50-period EMA and ADX above 25. Define the actual entry trigger separately.
- ADX + RSI: use momentum context deliberately. RSI below 30 during a strong downtrend is not, by itself, a reason to buy. If researching an uptrend pullback, define the uptrend, the pullback, and the recovery trigger.
- ADX + MACD: a MACD crossover can be an entry event while ADX is an eligibility condition. Both use price history, so agreement is not independent confirmation.
More filters can remove winning trades as well as losing ones. Give each rule a reason to exist, and test its incremental effect instead of assuming that several indicators agreeing creates an edge.
Add Filters to Your Trading System
Compare the Same Strategy With and Without the Filter
- Freeze the baseline. Specify the entry, exit, position size, data feed, interval, and session before adding a filter.
- Add one change. For example, permit baseline long entries only when ADX is above 25 and +DI is above −DI on a completed bar. Decide what happens to an existing position when the filter changes; an entry filter need not be an exit rule.
- Use enough history. Allow indicator initialization, and examine trending and sideways periods. Keep data preparation and corporate-action assumptions consistent.
- Include realistic costs. Compare trade count, average net trade, total net result, drawdown, exposure, and losing streaks—not just the percentage of winning trades.
- Evaluate unseen data. Reserve a later period before choosing parameters. Try nearby settings and document the number of alternatives considered; a single attractive historical setting can be overfit.
For illustration, suppose an unfiltered test takes 100 trades averaging 0.10R after costs, while a filtered version takes 40 trades averaging 0.15R. Their totals are 10R and 6R respectively. The filter improved average trade quality in this hypothetical example but reduced the total result. Whether it helped also depends on drawdown, time in the market, and the uncertainty of the smaller sample. Here R means a consistently defined initial trade-risk unit; no live results are claimed.
Research the Filter in LuxAlgo
Open the ADX Library indicator on Quant Charts to compare strength and direction with price. To develop a custom study or strategy, give Quant, our coding agent, explicit rules such as:
Compare my baseline entry rules with a version that only permits new long entries when the completed bar closes above its 50-period EMA, +DI exceeds −DI, and ADX exceeds 25. Use 14 for DI Length and ADX Smoothing. Preserve the baseline exits and sizing. Do not exit merely because the filter turns false, and do not use future bars.
Provide the baseline rules as well; a filter alone is not a complete strategy. Follow the Making Strategies guide: inspect the generated code and run it manually. Review the simulated trades and costs, then compare the two versions on the same history. Consult the data and market-coverage documentation when selecting the feed and available history.
Risk Control with Filters
ADX does not measure the stop distance a trade needs. High ADX alone does not justify widening a stop, and low ADX does not justify tightening it. Base the exit on the setup’s invalidation rule and price variability, then adjust size to the planned loss budget.
For a hypothetical stock trade entered at $100, a $98 stop creates $2 of price risk per share. A $200 price-risk budget permits 100 shares before costs. If the setup instead needs a $96 stop, the same budget permits 50 shares. A nominal 1.5R target is $103 in the first example and $106 in the second, producing $300 before costs at those sizes. A target multiple is a design choice, not evidence of positive expectancy.
Stops may slip, so the realized loss can exceed the plan. Consider reducing exposure or skipping a setup when conditions do not fit the tested strategy. Waiting is an option; automatically switching to a reversal strategy whenever ADX falls below 20 is not a substitute for testing that separate method.
ADX and DMI Video
Conclusion: Make the Filter Earn Its Place
A useful filter has a precise role, consistent timing, and evidence that it improves the result you care about. Separate direction from strength, preserve the baseline when testing, and account for fewer trades and delayed entries. Quant Charts and Quant can help make that comparison reproducible; the indicator threshold itself does not establish a trading advantage.
Frequently Asked Questions
What is a directional filter?
It is an eligibility rule that permits or blocks a trading setup according to a defined market condition. It is separate from the entry trigger unless the strategy explicitly combines them.
Does ADX show whether price is rising or falling?
No. ADX measures trend strength. Use price, moving averages, or the +DI and −DI relationship to describe direction.
Is ADX above 25 a guaranteed good trade?
No. It is a commonly used threshold, not a win probability. Test it with the instrument, interval, entry, exit, and costs of the actual strategy.
Is a 20-period moving average always 20 days?
No. The period counts chart bars. It represents 20 trading sessions on a daily chart or 20 five-minute bars on a five-minute chart.
Does adding more filters improve a strategy?
Not necessarily. Filters can remove good trades, delay entries, and reduce sample size. Compare the baseline and filtered versions on the same data, including costs and unseen periods.
Can Quant help test directional filters?
Yes. Define the baseline and filter rules, inspect the generated code, and run it manually. Keep entry eligibility, exits, sizing, and bar timing explicit so the comparison measures the intended change.
References
LuxAlgo Resources
- Average Directional Index Indicator
- LuxAlgo Quant
- Making Strategies with Quant
- Quant Charts Data and Market Coverage
External Resources
Read next