Double-Bottom Cheat Sheet: Buy the Spring Signal
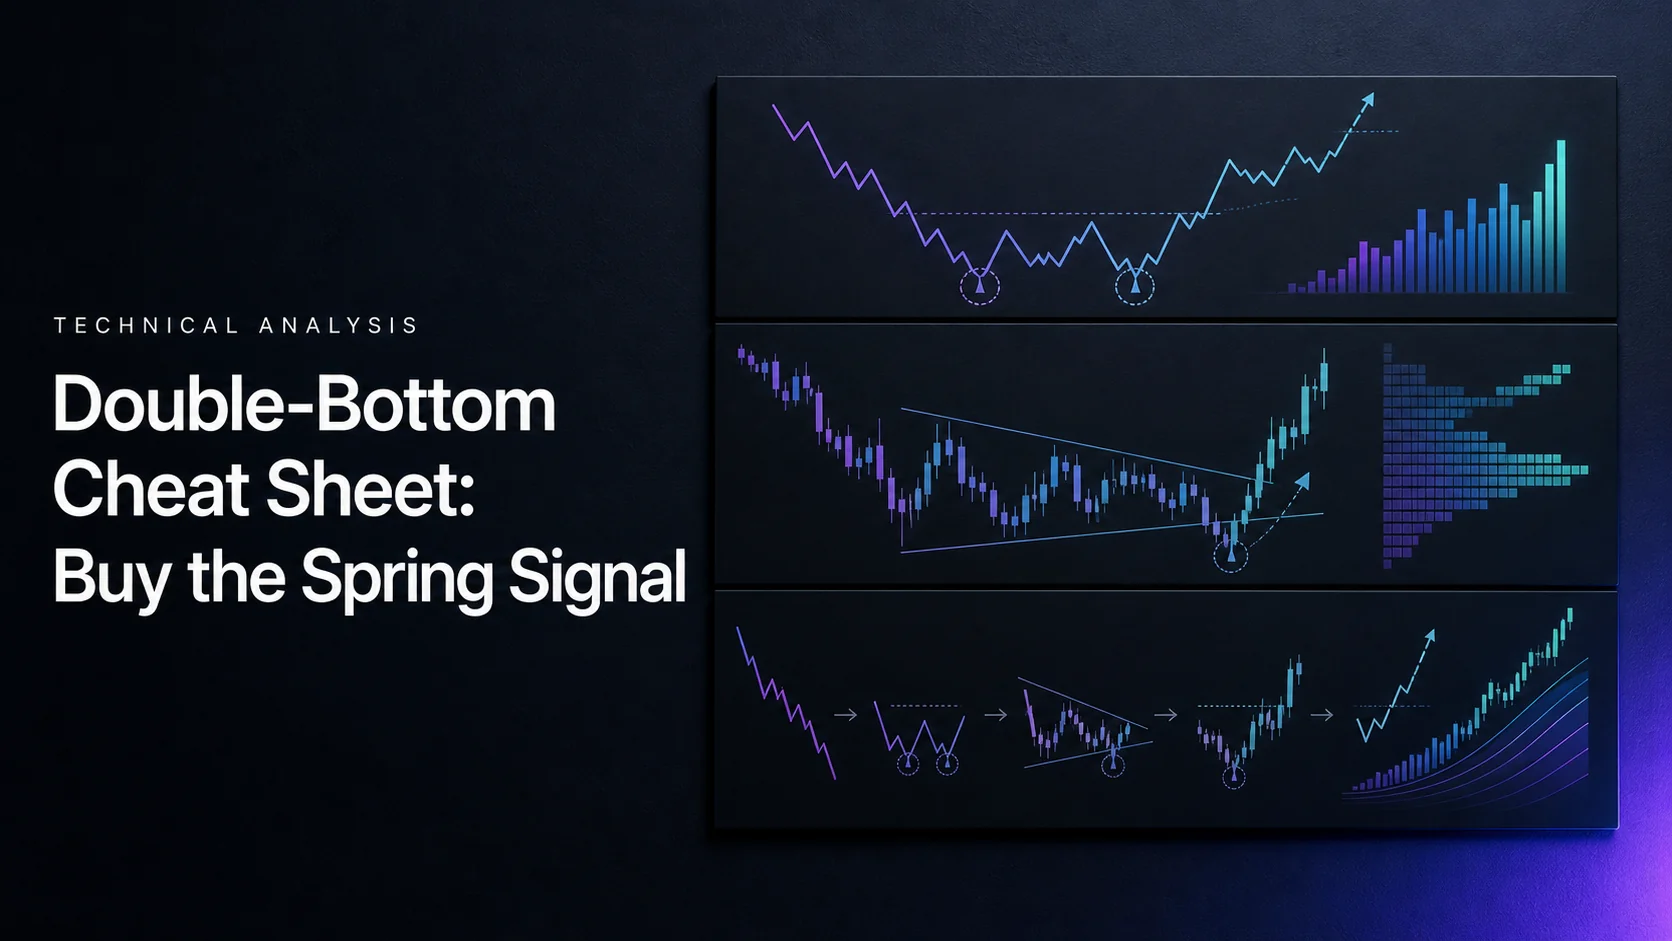
A double-bottom spring setup combines a failed break below support with a potential W-shaped bullish reversal. The spring is the dip below support and recovery back into the range. A completed double bottom requires a later break above the intervening peak, often called the neckline. Buying the support reclaim and buying the neckline breakout are different trades.
This cheat sheet explains how to identify each event, define an entry and calculate the risk. Use LuxAlgo’s charting and AI platform to compare the sequence on Quant Charts, then work with Quant, our coding agent, to turn a specific spring or breakout hypothesis into rules you can inspect and test.
Double-Bottom Spring Cheat Sheet
- Map the structure: a preceding decline, first low, recovery peak and second test near support.
- Separate the signals: a spring reclaims support; the neckline breakout completes the conventional double bottom.
- Define confirmation: specify the required close, recovery window and any subsequent test before looking at the outcome.
- Calculate the trade: use the actual entry, invalidation, position size and realistic execution costs.
- Measure performance: no universal 88% success rate or 50% average gain applies to every version of this setup.
Double Bottom Pattern Basics
Core Pattern Elements
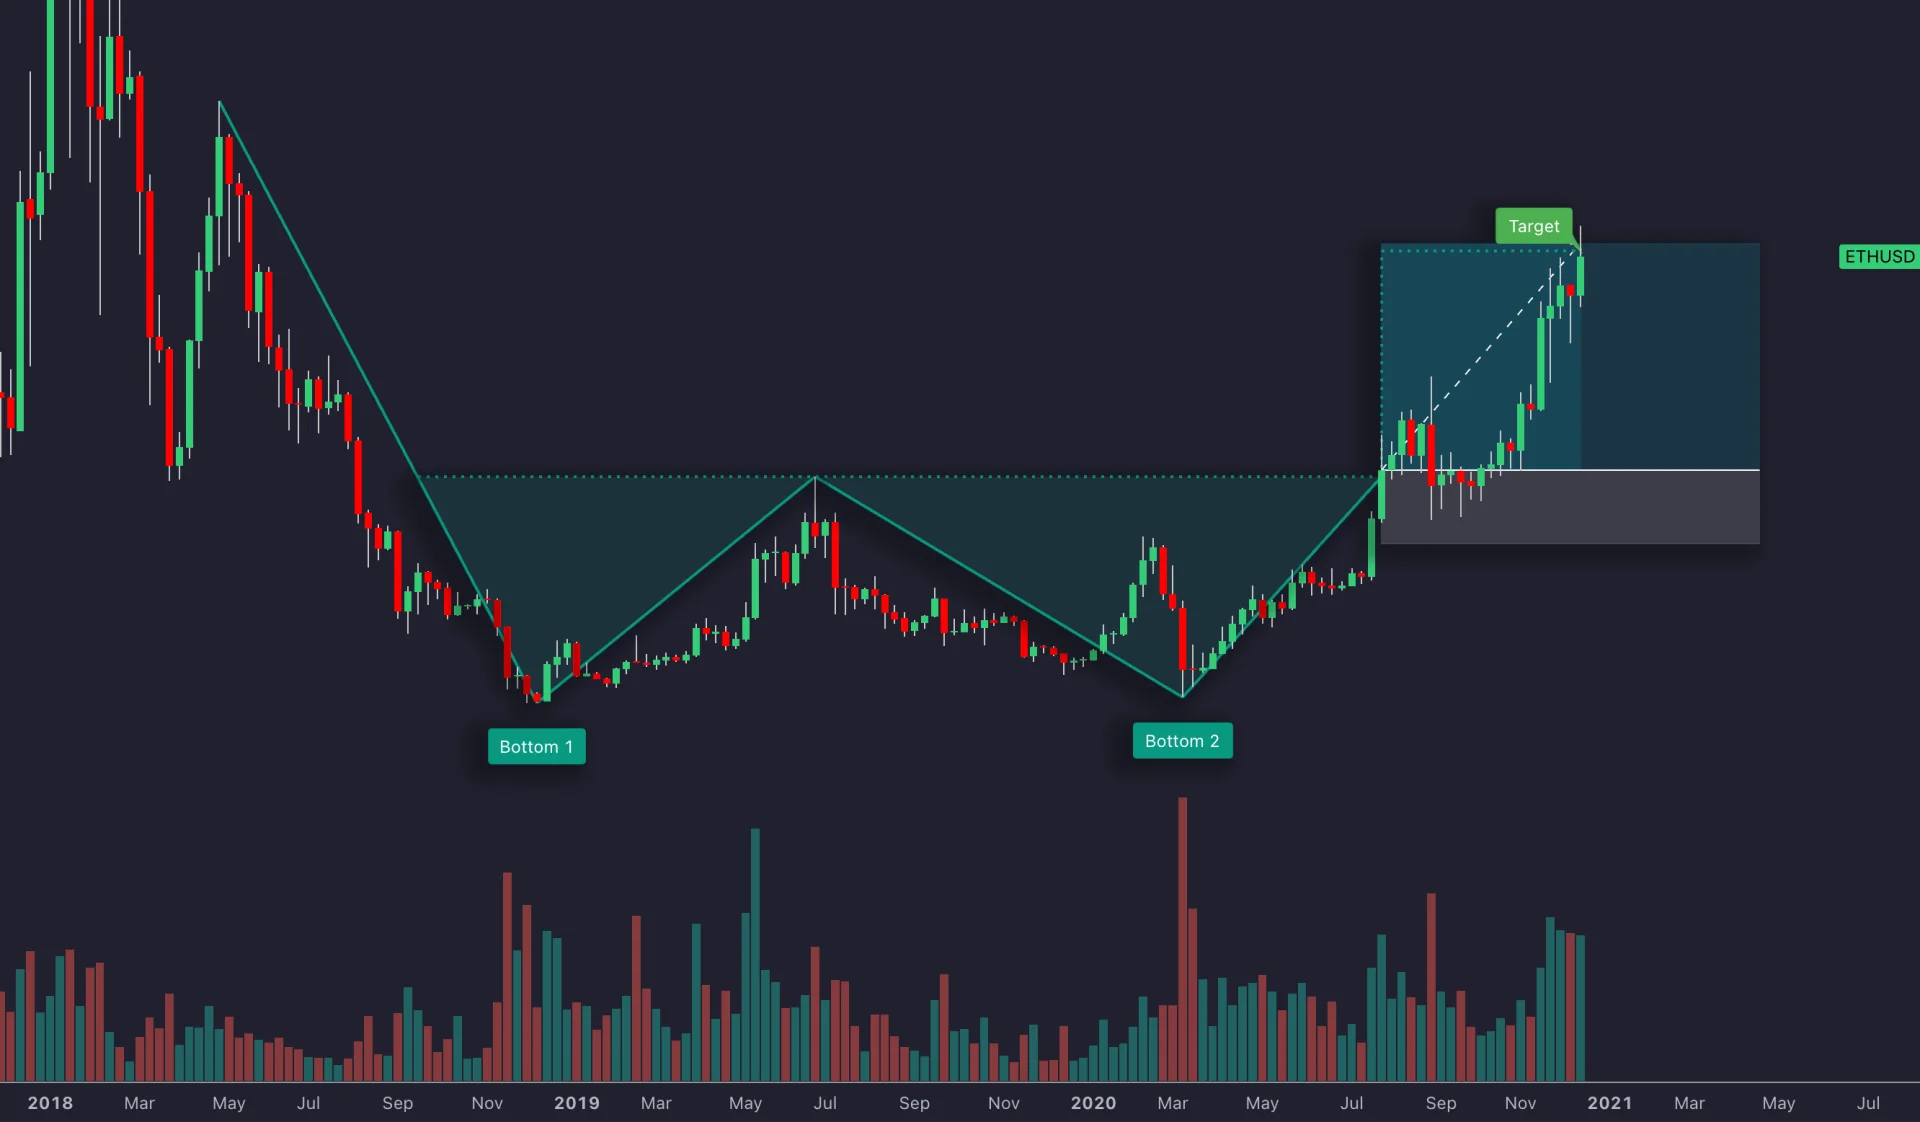
A double bottom has two distinct troughs near the same support area with a recovery high between them. It is a potential bullish reversal of a preceding decline. The lows need not be identical, but a pair of adjacent candles at similar prices is not automatically a meaningful W-shaped base.
| Component | What to identify | What remains unconfirmed |
|---|---|---|
| First bottom | A low after a decline | The downtrend may continue |
| Recovery rally | A distinct peak between the two lows | The rebound alone does not reverse the trend |
| Second bottom | A later test of the support area | Two lows do not complete the pattern |
| Spring variation | A break below support followed by a reclaim | The neckline can remain intact |
| Neckline breakout | A break above the intervening peak | The breakout can still fail |
| Retest | A later pullback toward reclaimed support or the neckline | A retest is not guaranteed to occur |
The StockCharts double-bottom guide describes the classic intermediate-to-long-term formation. Its percentage and spacing guidelines relate to that charting framework. They are not universal requirements for every intraday, futures or cryptocurrency implementation.
For a reproducible test, choose a maximum difference between lows, a minimum separation and a definition of the intervening peak. State whether those distances use percentages, ticks or a volatility measure. Mixing a 3–4% tolerance with a 4–10% tolerance changes the pattern sample and cannot be treated as one rule.
What the Pattern Contributes to a Trade
The structure provides reference levels for an entry hypothesis, invalidation and target. It does not verify strong support merely because price visits an area twice. Repeated tests can hold or eventually break.
A conventional measured target adds the pattern’s height to the neckline. That projection is a planning reference, not a promised 10–20% gain or a reason to double the target automatically. The entry price and stop distance determine the reward-to-risk ratio of the actual trade.
Spring Signal Analysis
What Makes a Spring?
In the Wyckoff framework, a spring moves below the low of a trading range and then closes back within it. It is often studied late in an accumulation range, sometimes followed by a test. A range can also resolve upward without a spring.
A spring near the second trough can coexist with a double-bottom setup. The terms are not interchangeable: a broader range can have a spring without a clean two-trough pattern, and a double bottom can complete without undercutting the first low.
The visible observation is a failed downside break and recovery. Describing that as a “bear trap” can be useful shorthand, but the chart alone does not reveal every trader’s positions or prove deliberate institutional manipulation.
Make the Spring Conditions Measurable
| Question | Example rule to specify | Why it matters |
|---|---|---|
| Where is support? | A prior confirmed low or predefined range boundary | Avoid drawing the level after the reversal |
| What is an undercut? | A trade below support by a stated minimum distance | A touch is different from a break |
| What is a reclaim? | A completed close back above support within a chosen number of bars | “Quickly” needs a measurable definition |
| Is a test required? | A later higher low that holds the reclaimed area | A separate test creates a later entry |
| What is the expiry? | Cancel if the setup fails to recover or trigger within the allowed window | Avoid leaving an old setup active indefinitely |
A Hammer or Bullish Engulfing near the reclaim can be an additional condition, but a candle shape alone is not a complete spring definition. Wait until any required candle has closed. If the model uses pivots that need later bars for confirmation, record the time those pivots actually became known.
Read Volume and Follow-Through Together
Wyckoff analysis often looks for reduced selling activity on a later test and strength on the subsequent advance. A high-volume undercut may need further testing before an analyst accepts the spring interpretation. A lower-volume test is different from simply requiring lower volume on every rebound.
Higher volume during recovery does not automatically turn a spring into a different pattern. Price location and the reclaim define the event; volume supplies context. Specify the comparison period and use the volume actually available from your feed. Tick volume and exchange-traded volume are not interchangeable measures.
Spring Signal Pitfalls
- No recovery: price stays below support, so the proposed reclaim has not happened.
- Failed reclaim: price returns into the range but then violates the defined invalidation.
- Continuing decline: a brief bounce can occur inside a strong downtrend without ending it.
- Unclear range: marking every new low as a spring removes the context that gives the setup meaning.
- Hindsight: selecting the low only after a large rally makes recognition look easier than it was in real time.
Consolidation is not a blanket reason to reject springs; the trading range is central to the Wyckoff context. The practical question is whether its boundaries and the recovery rule are clear enough to trade and test.
Trading Guide: Double Bottom Spring
A Checklist Before Entry
- Identify the preceding decline, support and intervening peak without using future bars.
- Check that the second test satisfies your distance and spacing rules.
- Observe the undercut and completed reclaim if a spring is required.
- Choose either the reclaim, a later test or the neckline breakout as the trigger.
- Set the initial stop, target, expiry and account-risk budget.
- Check spread, liquidity, scheduled events and whether the remaining reward justifies the risk.
Three Entries, Three Different Tests
| Entry approach | Potential advantage | Trade-off |
|---|---|---|
| Spring reclaim | Can enter near a clearly defined spring low | The double bottom is still incomplete and recovery may fail |
| Test after the spring | Allows observation of whether the reclaimed area holds | A test may not occur or may violate support |
| Neckline breakout | Waits for conventional double-bottom completion | A stop below the spring may be far away, reducing reward relative to risk |
For a spring-based long, initial invalidation might sit below the spring low with a predefined buffer. “Below the second bottom” is insufficient if a later undercut creates a lower extreme. A neckline-retest stop is another model; it should not be quietly substituted to make a breakout trade’s ratio look better.
Worked Example: Why Entry Choice Matters
Assume a hypothetical first low at $100, neckline at $110 and spring low at $98. Price then closes back above $100. Using $100 as the chosen base reference gives a $10 pattern height and a $120 measured target: $110 + ($110 − $100). If your method measures from the $98 extreme instead, its projection is $122; choose the convention before testing.
Suppose a reclaim entry fills at $102 with a stop at $97.50. The initial risk is $4.50 per share. A $110 first target offers $8, or about 1.78R. The $120 projection offers $18, or 4R, before costs. Neither target is assured, and taking partial profits changes the trade’s realized average payoff.
With a hypothetical $20,000 account and a 0.5% risk budget, the planned allocation is $100. Whole-share sizing gives floor($100 ÷ $4.50) = 22 shares, a $2,244 position and $99 planned loss at the assumed stop fill. If a gap instead produces an exit at $95, the loss becomes $154 before costs: 22 × ($102 − $95).
Now compare a neckline-breakout entry at $111 using the same $97.50 stop and $120 target. Risk is $13.50 and potential reward is $9, only about 0.67R. Waiting for completion can change the trade economics substantially. A trader requiring at least 2R would reject this version or test a genuinely different stop/entry model, rather than assume every double bottom offers favorable reward.
LuxAlgo Tools for Double-Bottom Spring Analysis
Review the Sequence on Quant Charts
Open Quant Charts to compare the support test, reclaim and neckline on the same market. A higher interval can help establish the broader range while a lower interval shows the proposed entry. Keep the symbol, session and price feed consistent and avoid using an unfinished higher-timeframe bar as confirmed evidence.
The LuxAlgo Library includes studies for additional context. Reversal Candlestick Structure recognizes candle formations; it is not a complete double-bottom spring trading system. A 20-period moving average or RSI can provide a predefined trend or momentum filter, but neither proves that support will hold.
The Library’s pattern and market-structure tools on a Quant Chart can label double bottoms, structure shifts, liquidity grabs and order blocks. Treat them as observations to check against your own definition, not as confirmation of a Wyckoff spring: a double-bottom label does not include the support-reclaim, volume, expiry or test conditions in this guide.
Build and Test the Rules with Quant
Use Quant, our coding agent, to help build a strategy from explicit definitions. Specify how the first low and neckline become confirmed, the permitted difference between lows, undercut distance, reclaim window, entry order, stop, target and expiry. Ask for separate reclaim and neckline variants so their results can be compared fairly.
Follow Making Strategies with Quant: inspect the code, then click Run yourself. Review the results with the native backtest guide. Check individual trades, fees, slippage, gaps and bars that touch both stop and target. Code that executes successfully can still implement the wrong pattern logic.
A label on a historical chart does not establish that it was available at the plotted pivot time; make the strategy wait for confirmed pivots.
Strategy Assessment
Benefits vs. Drawbacks
| Aspect | Useful feature | Limitation to evaluate |
|---|---|---|
| Structure | Named support, neckline and invalidation levels | Level selection and pivot timing can be subjective |
| Risk planning | A spring low supplies a potential stop reference | Gaps and slippage can exceed planned risk |
| Entry selection | Reclaim, test and breakout variants can be compared | Later confirmation may leave little reward |
| Volume analysis | Can describe participation and test behavior | Feed differences and ambiguous readings matter |
| Time horizon | Can be studied across clearly defined intervals | A long-term base and an intraday W are different samples |
There is no transferable 88% success rate, 50% average gain or guaranteed advantage in a bull market for this entire family of setups. A valid estimate needs a defined sample, trade count, dates, rules and costs. Selected successful charts and endorsements do not supply those details.
Compare average win and loss, drawdown, losing streaks and exposure alongside win rate. Test each volume, RSI-divergence or moving-average filter against the baseline rather than assuming more confluence always improves performance. Retain losing examples, freeze the rules before an untouched test period and log all parameter changes.
U.S. Market Settings
For U.S. stock studies, specify whether the dataset includes regular trading hours, extended hours or both. The regular session is generally 9:30 a.m.–4:00 p.m. Eastern Time on a full trading day; holidays and early closes require the relevant exchange calendar. Use the exchange timezone so daylight-saving changes are handled correctly.
Do not assume every LuxAlgo indicator contains NYSE/Nasdaq-specific volume presets, automatic holiday filters or a fixed U.S. date format. Check the actual chart, feed and strategy settings. Price formatting in dollars does not establish that a session filter is correct, and split adjustments or overnight gaps can affect historical patterns.
Putting the Setup into Practice
First identify the range and potential W. Then determine whether a support undercut actually recovered and whether a neckline breakout has occurred. Choose one entry model and calculate its risk from the expected fill to the defined invalidation.
Quant Charts supports the visual comparison; Quant helps turn the conditions into inspectable code. The useful outcome is a repeatable process with measured limitations, not a claim that every spring predicts a large rally.
FAQs
What confirms a spring signal in a double bottom?
A spring requires a break below a predefined support or range low followed by a recovery back inside the range. Specify the required close and recovery window. A later test or neckline breakout can be an additional condition, but those are separate events.
Does every double bottom contain a spring?
No. A double bottom can form with two similar lows and then break its neckline without undercutting support. A spring can also occur in a broader trading range without a clean double-bottom shape.
How can I manage risk in a volatile market?
Define invalidation using the actual setup extreme, calculate size from the entry-to-stop distance and include costs. Wait for the chosen trigger rather than assuming a low is final. Gaps and slippage can cause losses larger than the planned stop amount.
Can RSI, moving averages or volume improve the setup?
They can provide explicit filters to test. A 20-period moving average describes trend context, RSI can describe momentum or divergence, and volume can describe participation. None guarantees a reversal or improves every strategy automatically.
How is a double-bottom price target calculated?
One conventional approach adds the distance between the chosen base reference and neckline to the neckline. State the base convention consistently. The result is a projection, and its reward-to-risk ratio depends on the actual entry and stop.
References
LuxAlgo Resources
- Quant Charts
- LuxAlgo Quant
- Making Strategies with Quant
- Native Backtest Guide
- LuxAlgo Library
- Reversal Candlestick Structure
- LuxAlgo Pricing
External Resources
Read next