Double Top Breakdown: Short the Failed Peak
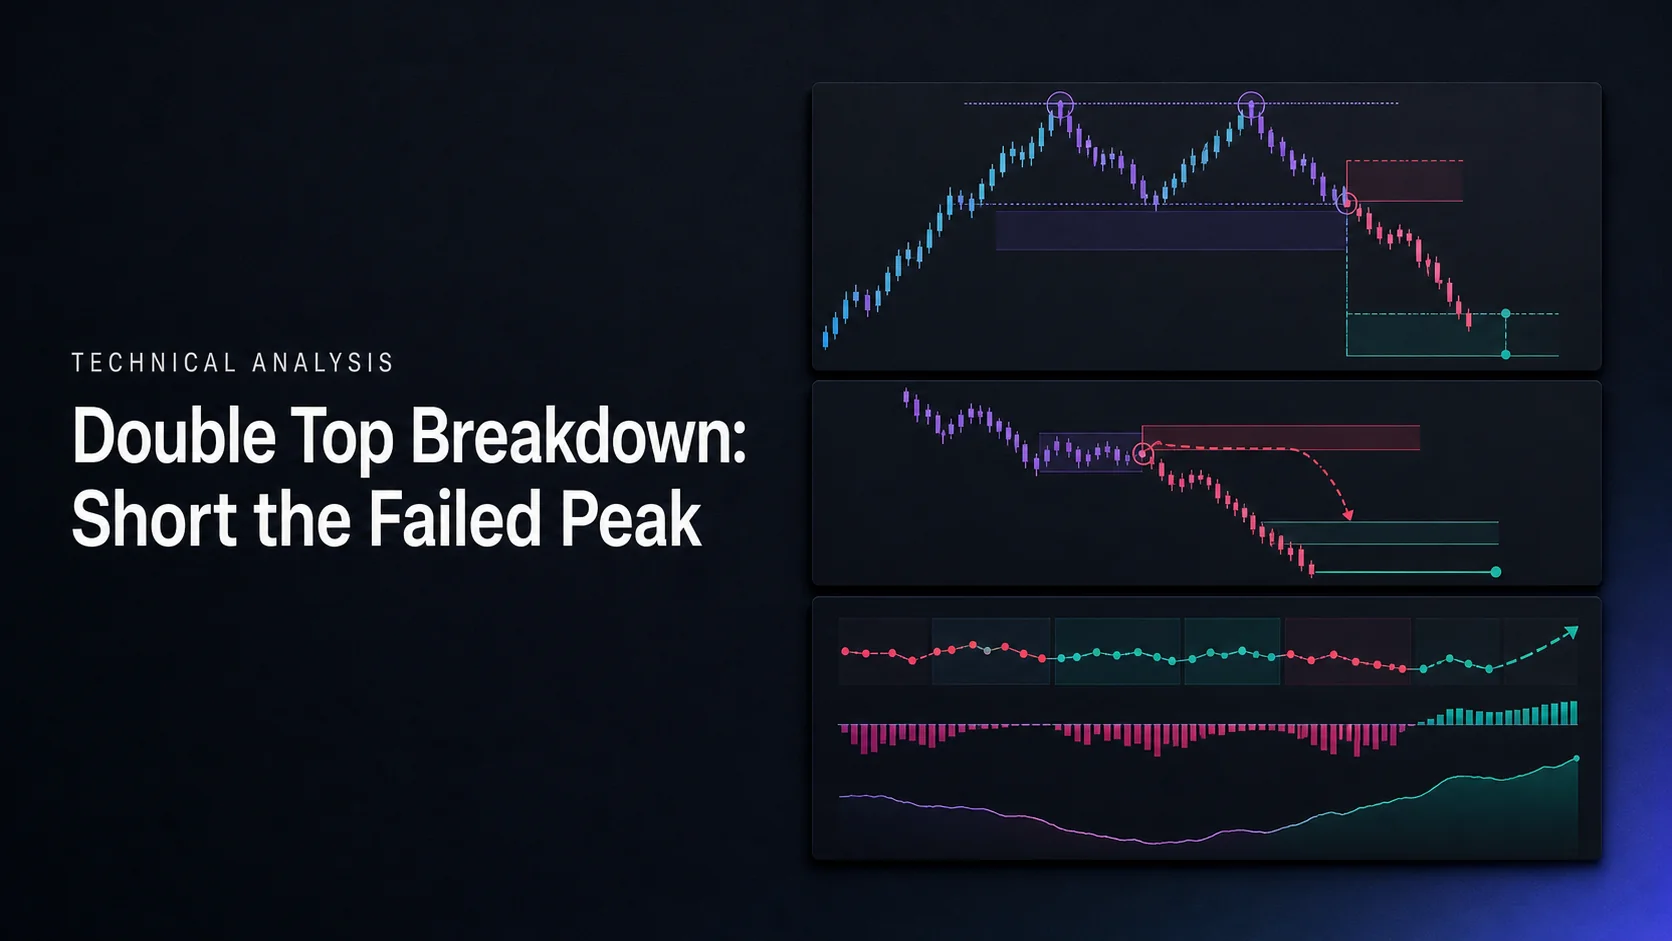
A double top becomes a completed bearish reversal pattern when price breaks the support between its two peaks. Until that neckline breaks, the “M” shape is only a candidate and the prior uptrend may continue. A completed pattern still does not guarantee a profitable short trade.
This guide explains neckline confirmation, breakdown versus retest entries, stop placement and position sizing. Use LuxAlgo’s charting and AI platform to make the setup explicit: mark its levels on Quant Charts, then work with Quant, our coding agent, to implement and test the rules.
Spotting Double Top Breakdowns
Pattern Structure
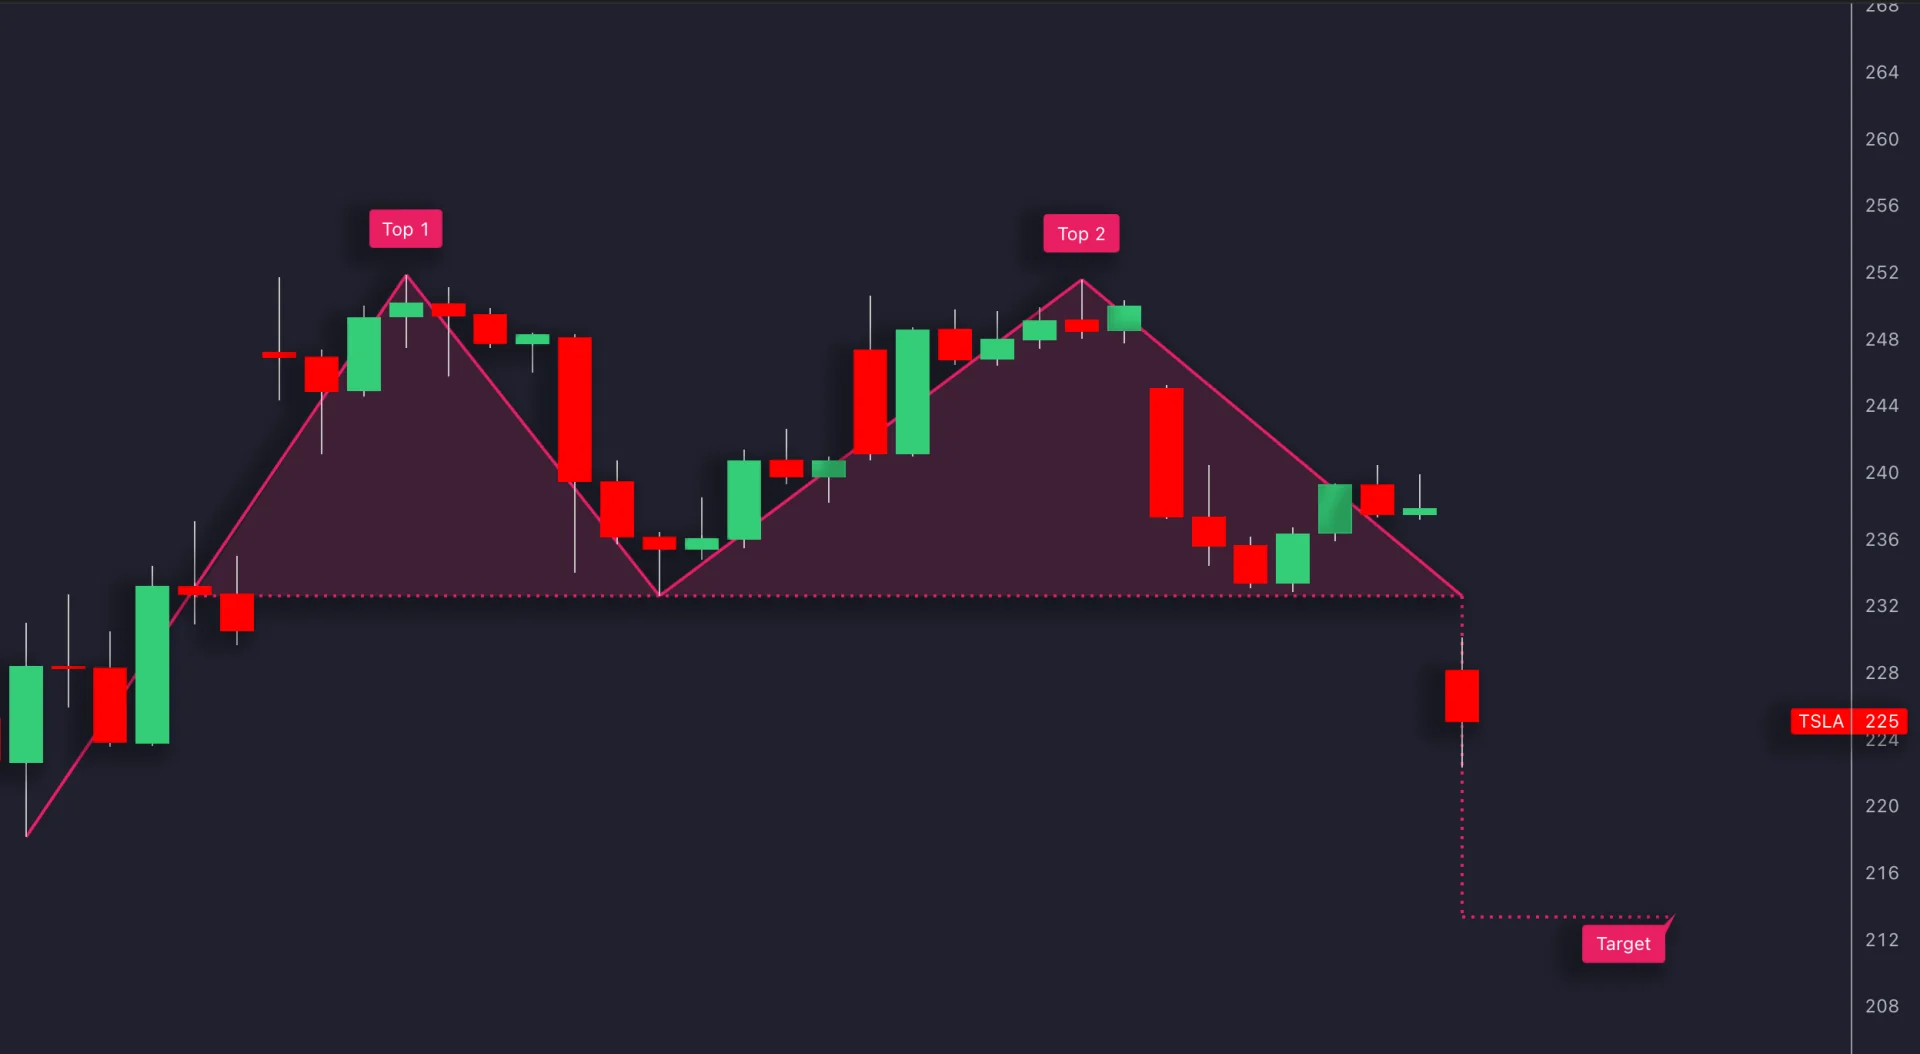
Look for a preceding advance, a first peak, an intervening trough and a second peak near the first. The trough defines the neckline. Peaks need not match exactly, but a strategy must state its permitted price difference, minimum separation and swing-confirmation method.
Two nearby highs can simply be repeated resistance tests. A double top on ordinary price charts also differs from the bullish double-top breakout terminology used in point-and-figure charts. The StockCharts double-top guide explains this distinction and the classic support-break interpretation.
Breakdown Signs
A close below the neckline is a common completion rule. Specify whether it needs a price buffer, several closes or a retest. An intrabar dip and a completed close are different events, and adding confirmation changes the eventual entry price.
Volume contraction near the second peak and expansion during the decline are traditional supporting observations. They are not mandatory outcomes in every market. A test could require breakdown volume above its prior twenty-bar average, but that threshold should be evaluated rather than treated as a universal standard.
Do not classify a candidate using future information. If a pivot requires several later candles to confirm, its signal becomes available only after those candles. Record the time the strategy could actually recognize the formation.
Technical Confirmation Tools
| Observation | Possible use | Limit |
|---|---|---|
| Close below neckline | Defines completion under a close-based rule | Price can immediately reclaim the level |
| Lower volume near second peak | Describes reduced reported participation | Does not directly prove buyers have exhausted |
| Higher volume at breakdown | Can be a specified activity filter | Heavy volume also occurs in failed breaks |
| Weaker RSI near second peak | Describes momentum divergence | Divergence is neither required nor a timing guarantee |
Classic bearish RSI divergence compares a higher price high with a lower oscillator high. Near-equal price peaks may instead show weaker momentum without meeting a strict higher-high definition. State the tolerance and oscillator settings. RSI does not have to be overbought at every valid double top.
Ichimoku Cloud, moving averages, MFI or ADX can provide additional context, but they answer different questions. For example, ADX measures trend strength rather than direction. Test each filter separately; adding several correlated conditions can reduce the sample without improving performance.
Use consistent feeds and sessions for volume comparisons. Forex tick volume differs from traded equity volume, and exchange-specific equity volume differs from consolidated volume. Four-hour, daily and weekly charts represent different holding periods and risks, not an automatic hierarchy of accuracy.
A Historical Example of a Difficult Breakdown
StockCharts documents Ford’s 1998–2000 formation: after the second peak near $36.80, support around $30.50 eventually broke, but a sharp rebound reached roughly $32 before later weakness. The example illustrates why a neckline break can be followed by an uncomfortable recovery rather than a clean decline.
Those are historical chart values from the cited example, not current prices or a verified trading return. For an AMZN example from 2020, the exact dates, adjusted prices and entry/exit rules would be needed before claiming that a double top produced a particular outcome. A selected chart alone cannot establish a strategy’s performance.
Short-Selling Strategy
Breakdown and Retest Entries
| Entry model | Example rule | Trade-off |
|---|---|---|
| Breakdown | Enter after a completed close below the neckline | Earlier participation, but the fill may be far below support |
| Failed retest | After the break, wait for a rally that fails near the neckline | Potentially closer invalidation, but the retest may never occur |
| Price-buffer entry | Require a stated distance below support | Filters small breaks while delaying entry |
A retest is not automatically safer or more profitable. It may fail to hold as resistance, and its stop can be too tight for ordinary price variation. Compare complete models rather than selecting the best entry retrospectively.
A short sale of stock involves selling shares you do not own and buying them back later. As the SEC short-sales overview explains, a lower repurchase price creates a gross gain and a higher price creates a loss. Check the broker’s availability, costs and account requirements before assuming a chart signal is executable.
Targets and Stop Placement
The conventional measured target subtracts the pattern height from the neckline. For peaks near 1.2000 and a neckline at 1.1800, height is 0.0200, or 200 pips for a pair quoted with a 0.0001 pip. The projection is 1.1600. This does not mean a trade entered below 1.1800 still has 200 pips of reward.
A stop above the second peak tests the broader formation’s failure. A stop above a failed retest near the neckline tests a narrower tactical entry. They are different invalidation choices with different stop distances and likely outcomes. There is no universal rule that the midpoint between the peak and neckline invalidates every setup.
Do not force a stop to sit one-third of the target distance away just to display a preferred ratio. First choose a defensible invalidation level, then calculate risk and decide whether the remaining reward suits the strategy. A tighter stop increases the quoted reward-to-risk ratio but can also increase stop-outs.
Worked Forex Example
Using the hypothetical 1.2000 peaks, 1.1800 neckline and 1.1600 target, suppose a short fills at 1.1780. A tactical stop at 1.1840 risks 60 pips while the target offers 180 pips: 3R before costs. A wider stop at 1.2020 instead risks 240 pips, reducing that same potential reward to 0.75R.
For an illustrative 10,000-unit EUR/USD short, the 60-pip stop corresponds to $60 of price risk and the target to $180 of gross reward. A gap cover at 1.1880 would lose $100 before costs. Spreads, financing, slippage and the account’s conversion basis must be included separately.
The two stop choices cannot be compared on headline reward-to-risk alone. Test their trade distributions with consistent sizing and costs. A 3R target can coexist with negative expectancy if it is reached too rarely or execution losses are large.
Managing Trade Risk
Position-Size Control
For a stock short, planned price risk per share equals stop minus entry. Divide the chosen cash-risk budget by that distance and round down to an allowed size. Also check exposure and execution constraints; a tight stop does not justify unlimited position size.
For example, a hypothetical $100 short entry with a $103 stop and $94 target risks $3 per share for $6 potential reward, or 2R. A $20,000 account using an illustrative 0.5% budget allocates $100 of planned risk. That permits 33 shares: $99 of price risk and $3,300 notional exposure. A gap cover at $105 loses $165 before costs.
The risk percentage is an example, not a universal recommendation. Total exposure across correlated shorts matters. Stops do not place a guaranteed ceiling on losses, especially during sharp upward moves or disrupted trading.
Stop Orders and Execution
A protective order for a short position is a buy order. A buy stop is placed above the market and becomes a market order when triggered. The SEC order-types guide explains why the trigger price is not a guaranteed fill price.
| Order | How it works | Important limitation |
|---|---|---|
| Buy stop / stop market | Becomes a market order when the stop condition triggers | The cover price may be worse than the stop |
| Buy stop limit | After triggering, attempts to buy at the limit price or lower | May leave the short open if the market stays above the limit |
| Buy limit target | Attempts to cover at the specified price or lower | A chart touch alone does not guarantee an actual fill |
Check the broker’s trigger convention, supported sessions and handling of gaps or halts. In a backtest, use realistic fill assumptions rather than assuming every stop and target executes at the exact line drawn on the chart.
Using LuxAlgo to Review and Test Double Tops
Mark the Setup on Quant Charts
On Quant Charts, mark both peaks, the intervening trough and the projected target. Add a separate invalidation level for the chosen entry model. Compare the broader trend with the entry timeframe while keeping the symbol, feed and session consistent.
Keep Product Features Distinct
Ultimate RSI is a momentum study to investigate as a filter. Ichimoku Theories is its own study; do not assume its output is interchangeable with every standard Ichimoku Cloud setup. Record the actual settings used.
Volumetric Toolkit and Breakouts with Tests & Retests are additional Library studies with their own definitions. Liquidation Levels is not a substitute for deciding a protective stop, and a Candlestick Structure label is not required to recognize a closing price below the neckline. Choose a study that measures the specific condition in your entry or exit rule.
Test the Rules with Quant
Use Quant, our coding agent, to help implement peak tolerance, minimum separation, neckline completion, setup expiry and your chosen entry/exit rules. State whether a volume filter or RSI condition is optional, and include position sizing and costs.
Follow Making Strategies with Quant: inspect the generated code and click Run yourself. Use the native backtest guide to review fills and metrics. Verify that confirmed pivots and higher-timeframe data were available at the time of each signal.
Compare breakdown and retest entries on the same dataset, retaining failed patterns and an untouched evaluation period. A completed backtest does not establish future profitability or automatically manage a live short.
Double Top Pattern Video Guide
Common Trading Errors
- Shorting the second peak before completion: this is an anticipatory strategy, not a confirmed neckline-break strategy.
- Ignoring the trough: two highs alone do not establish the completion level.
- Assuming confirmation removes failures: price can reclaim support even after a close below it.
- Mixing stop models: a peak stop and a retest stop require different sizing and testing.
- Chasing the decline: a late entry may consume most of the measured reward.
- Selecting only ideal charts: include unmatched peaks, failed breaks and setups that never retest.
Put the Pattern into a Complete Plan
Identify the preceding trend, define the peaks and neckline, then choose an entry rule and an invalidation level. Measure reward from the actual fill, size for the stop distance and account for execution risk. Use Quant Charts to inspect the setup and Quant to help test it consistently.
FAQs
How can I confirm a double top breakdown?
A common rule requires a completed close below the trough between the two peaks. Define any buffer or time filter in advance. Completion does not guarantee that the decline will continue.
Should the stop be above the neckline or the peak?
They represent different models. A stop above a failed neckline retest is tactical; a stop above the peak allows more room but increases risk per unit. Test and size each model separately.
Do higher timeframes make double tops more reliable?
Not automatically. They change the holding period, number of observations and stop distance. Use completed higher-timeframe candles and evaluate the rules on the intended market.
Does a retest entry always offer better results?
No. A retest may offer a different entry and stop distance, but it may never occur or may fail. Compare complete entry models rather than choosing the best historical fill.
Is a 3R target enough to make the strategy profitable?
No. Win frequency, actual average gains and losses, costs and gaps also matter. A target is an intended exit, not a promised return.
Can a stop order guarantee the short’s maximum loss?
No. A triggered stop-market order can fill at a worse price, while a stop-limit order can remain unfilled. Include those execution risks in the plan.
References
LuxAlgo Resources
- Quant Charts
- LuxAlgo Quant
- Making Strategies with Quant
- Native Backtest Guide
- Ultimate RSI
- Ichimoku Theories
External Resources
Read next