Double Tops & Bottoms: How They Work for Trading
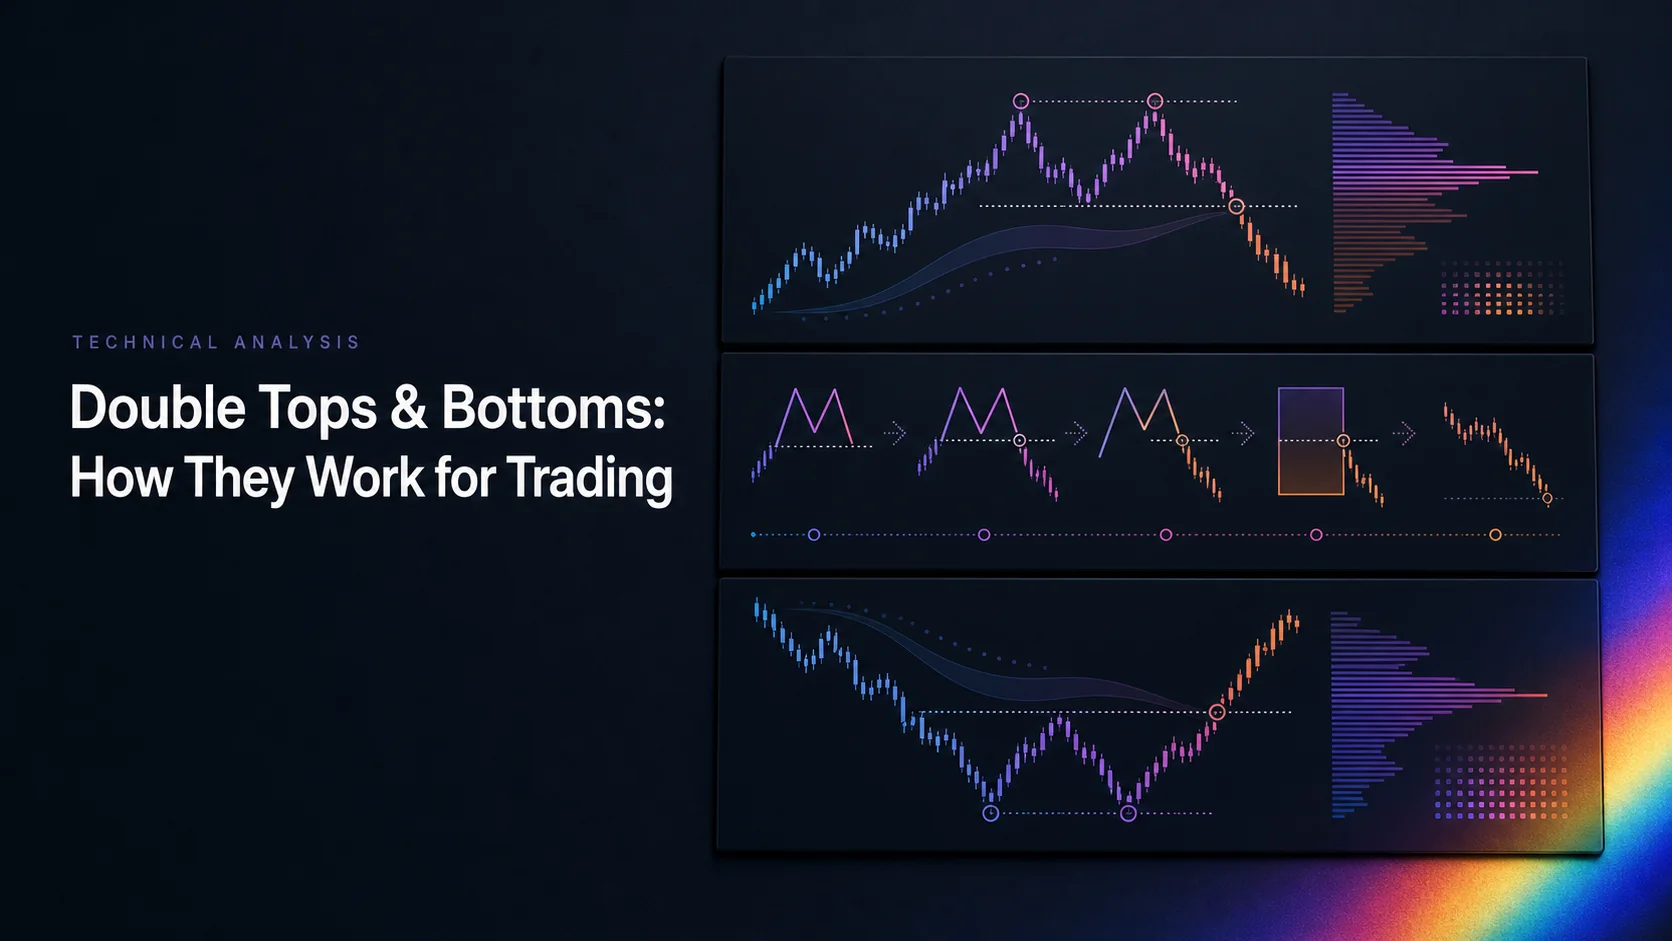
Double tops and double bottoms are candidate reversal structures with two similar price extremes separated by an opposing swing. The intervening low or high provides a confirmation reference. Two nearby peaks or valleys alone do not establish a completed pattern, a trade entry or a profitable outcome.
The useful distinction is between a developing shape, a confirmed break under a specified rule, and the results of an executable strategy. This guide explains that distinction, the basic height projection and the Adam/Eve variations, with the original historical chart examples.
Compare the Two Structures
| Feature | Double top | Double bottom |
|---|---|---|
| Prior movement | An advance that could reverse | A decline that could reverse |
| Main turns | Two peaks near a similar price | Two valleys near a similar price |
| Intervening turn | A low between the peaks | A high between the valleys |
| Confirmation reference | A close below that intervening low | A close above that intervening high |
| Potential thesis | A subsequent decline | A subsequent advance |
The confirmation convention above follows Bulkowski’s Adam & Eve double-top guidelines and double-bottom guidelines. A different strategy may use intrabar crossings, a buffer or another condition, but it should state that choice before testing. Confirmation is a definition of the setup, not an instruction to open a position automatically.
Keep point selection consistent. Decide whether peaks and valleys use highs/lows or closes, how a swing becomes confirmed, and what makes two extremes sufficiently similar. If detecting a swing requires subsequent bars, a backtest cannot act on that knowledge at the earlier turning point.
Treat Percentage and Timing Rules as Definitions
The original article used a 6% tolerance, a 10–20% intervening move and a 5% breakout buffer as broad rules. These should not be combined into a universal definition. For example, Bulkowski’s cited Adam & Eve top page describes peak differences below 3%, an intervening decline of at least 10% with exceptions, and peaks several weeks apart. His bottom page describes similar valley prices and an intervening rise of at least 10%, also allowing variation.
Those are author-specific guidelines for the patterns studied. A percentage distance and a number of daily bars do not transfer automatically to an intraday futures chart or another volatility regime. Define the denominator for any percentage tolerance and retain the same rule when evaluating later data.
A fixed 5% confirmation buffer is not required by the cited identification rules and cannot guarantee avoidance of false breaks. A bottom would require an upward move beyond its confirmation level, not the original article’s contradictory “decline above” wording. If adding a buffer, measure its effects on entry price, missed signals and realized results.
The distance in time between turns also needs an explicit rule. Adjacent candles may represent a single swing rather than two distinct extremes. Conversely, a very long separation may describe a different market context. Volume can be an additional observation, but a declining volume trend is not mandatory proof of validity.
Historical Double Top: OIA
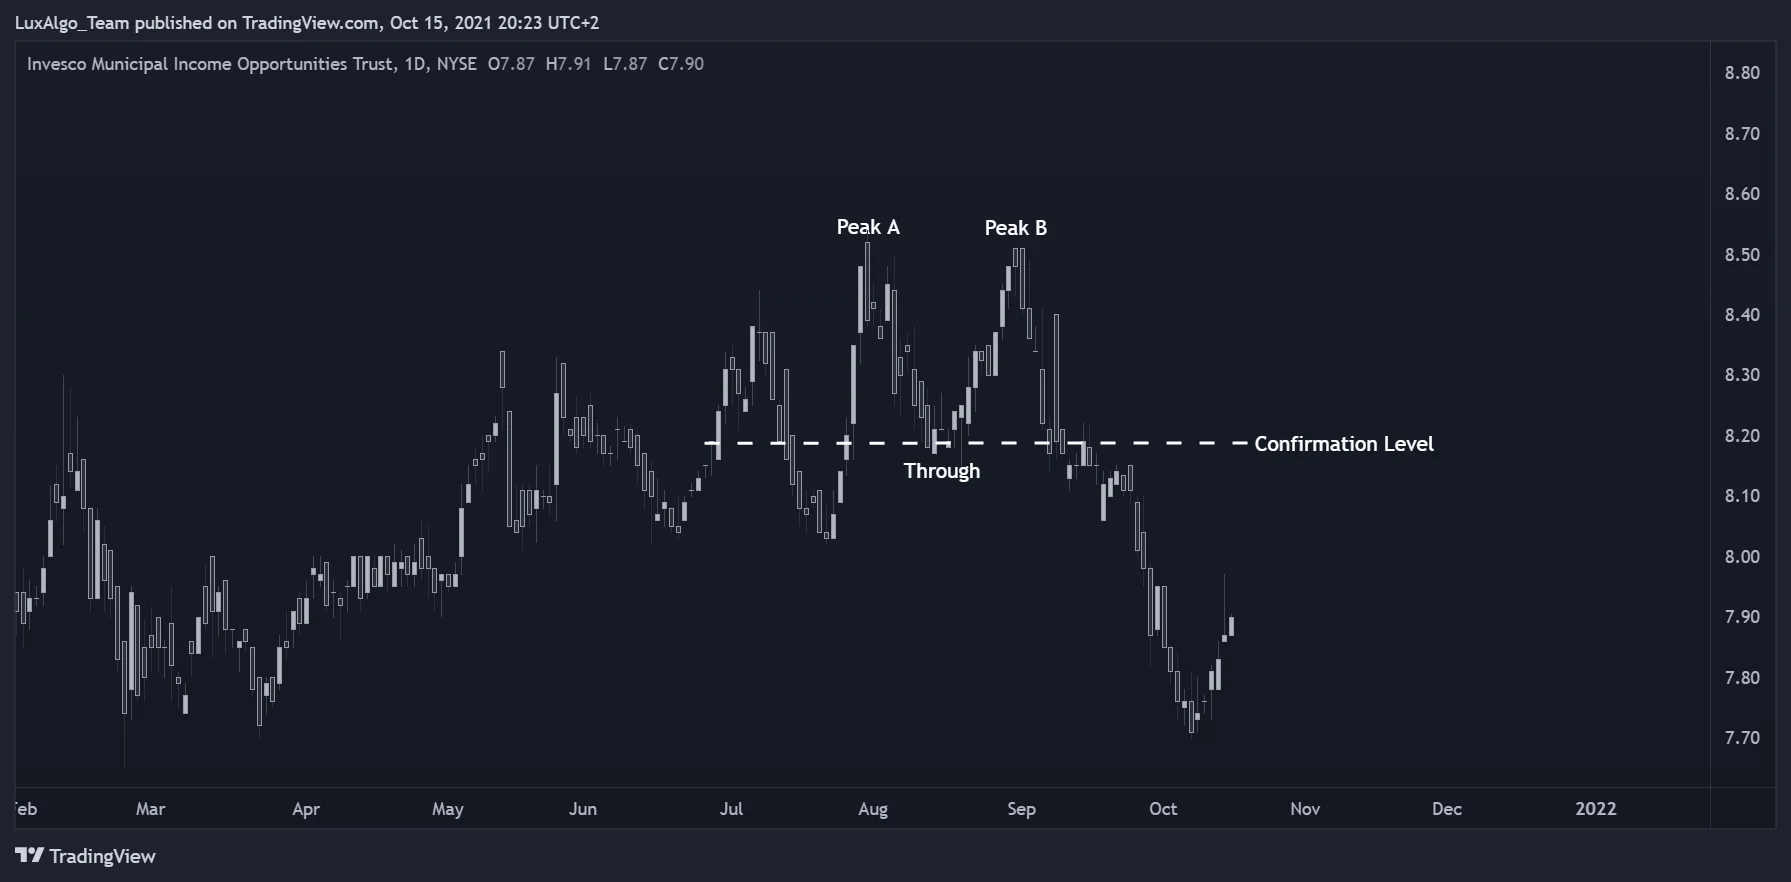
The OIA drawing shows why the intervening trough matters. Selling merely because price returns near the first peak would be a different rule from waiting for a close below the marked level. A later chart cannot establish which price an order would have received.
Historical Double Bottom: CFFN
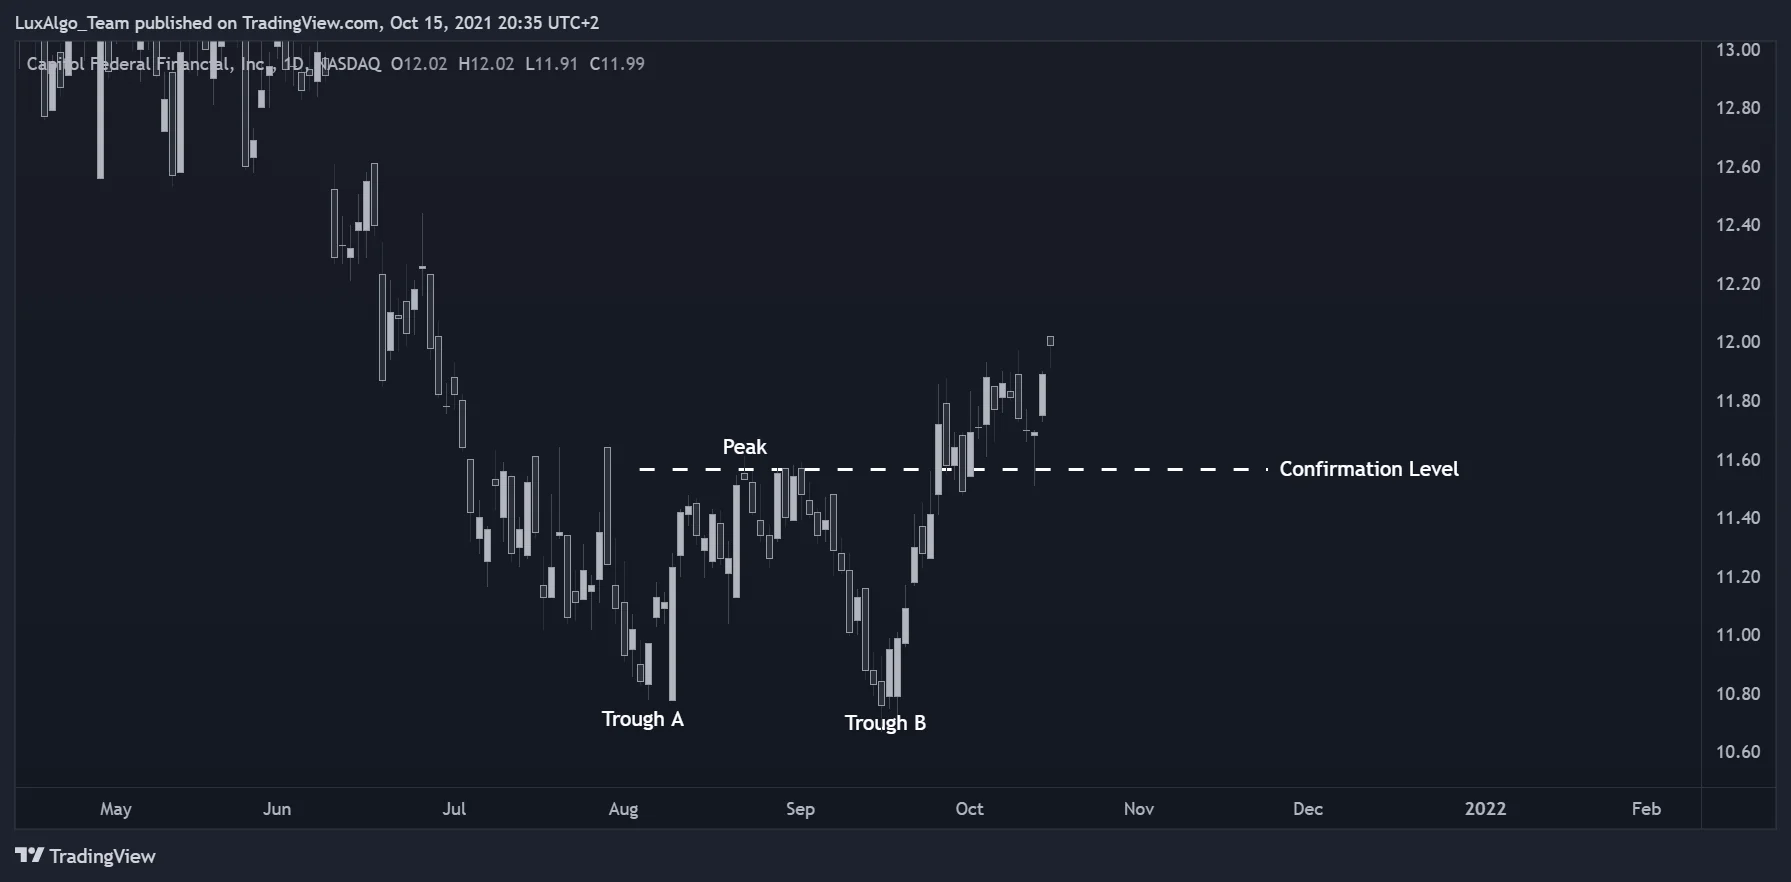
A candidate can revisit its first low and then keep falling without ever confirming. Keep those incomplete candidates when evaluating a detection process. Restricting a review to finished formations that later move in the desired direction creates a misleading sample.
Calculate the Basic Height Projection
For a top, measure from the highest selected peak down to the lowest intervening trough, then subtract that height from the trough reference. For a bottom, measure from the lowest selected valley up to the highest intervening peak, then add that height to the peak reference. These are full-height geometric projections, not expected returns.
| Example | Height | Full-height reference |
|---|---|---|
| Top: highest peak 110, trough 100 | 110 − 100 = 10 | 100 − 10 = 90 |
| Bottom: lowest valley 90, peak 100 | 100 − 90 = 10 | 100 + 10 = 110 |
The cited Bulkowski pages also describe scaling height by a historical target-hit percentage. That is a different construction from the full-height examples above. The original article’s standalone 73% factor should not be treated as a universal expected move: a sample-based adjustment needs its source, pattern definition and evaluation period.
Neither construction determines a stop-loss or guarantees that the target will be reached. Separate invalidation, position sizing and exit management from the visual projection. The actual entry may occur beyond the reference level, changing both planned risk and reward.
Understand Adam and Eve Variations
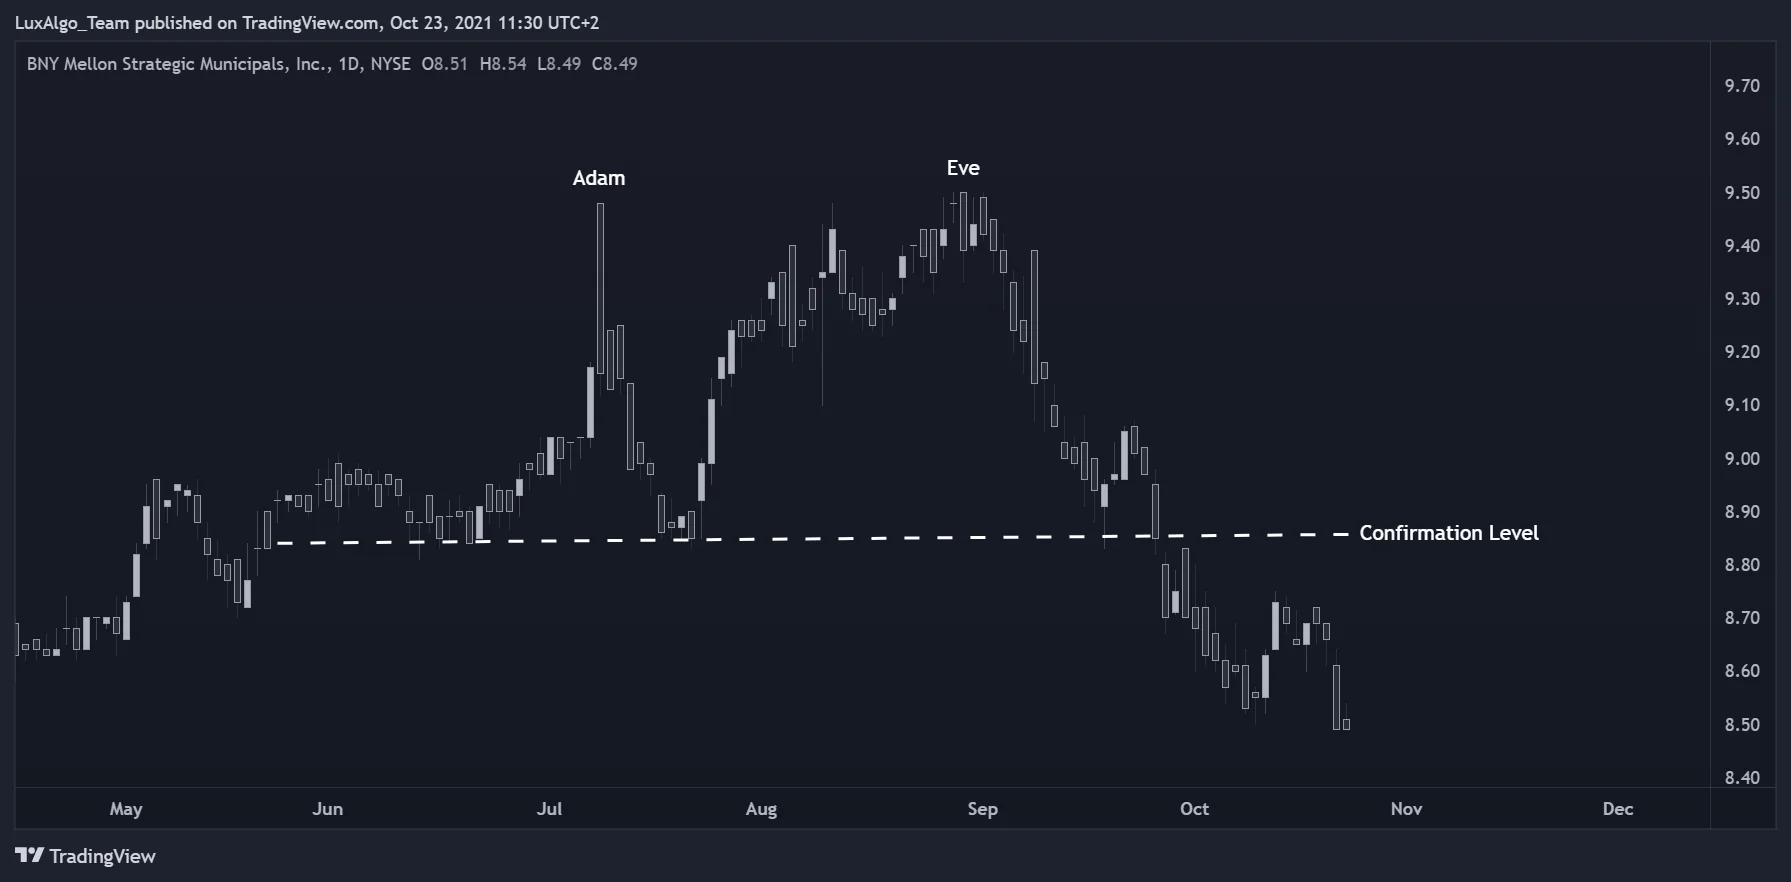
Adam describes a comparatively narrow, pointed turn, sometimes dominated by a spike. Eve describes a wider, rounder turn. At a top, Adam resembles an inverted V; at a bottom it resembles a V. Judge the overall shape across the turn rather than classifying it from one isolated candle.
| Sequence | First turn | Second turn |
|---|---|---|
| Adam & Adam | Narrow and pointed | Narrow and pointed |
| Adam & Eve | Narrow and pointed | Wider and rounder |
| Eve & Adam | Wider and rounder | Narrow and pointed |
| Eve & Eve | Wider and rounder | Wider and rounder |
These names describe the order of the turns from left to right. They do not change the need for a prior move, an intervening reference and a stated confirmation rule. Not every trader uses this classification, and a borderline shape should not be relabeled after its outcome is known.
Bulkowski’s performance ranks compare defined patterns within his research. A rank is not a probability that the next signal will win, and an average post-breakout move is not a realized strategy return. Evaluate costs, confirmation timing and losing cases before using a ranking to select trades. A small collection of attractive charts cannot establish superiority among the four variants.
Separate Research Explanations from Trading Evidence
Big M and Big W are related labels discussed by Bulkowski for double formations with prominent incoming moves. A dramatic visual shape does not guarantee a return to the earlier starting price. Record the additional conditions if treating either as a separate strategy.
Caginalp and Balevonich’s A Theoretical Foundation for Technical Analysis was published in the Journal of Technical Analysis in 2003, with its SSRN entry posted in 2005. The authors describe a dynamical model that can generate double-top structures through the behavior of a modeled group. This supplies a possible theoretical mechanism, not evidence that a real chart reveals identical investor valuations or guarantees an executable edge.
Test an Execution Rule, Not Just a Drawing
Define the entry, invalidation and exit before measuring performance. For a hypothetical long entry at 101 and an exit trigger at 97, planned price risk is 4 per unit. A 200 price-risk budget corresponds to 50 units before costs. An exit at 95 after a gap produces a 300 price loss; the planned amount is not a guaranteed cap.
Investor.gov’s order guide explains why market orders do not guarantee a price and limit orders may not execute. Include spread, fees and slippage; for short positions, account for access and borrowing or funding assumptions where relevant.
- Keep development data separate from later evaluation.
- Use the time a swing becomes known, not only the earlier bar where a marker is drawn.
- Count failed, incomplete and missed candidates consistently.
- Specify treatment of repeated breaks, retests and overlapping patterns.
- Review individual trades and compare the fixed rule with a suitable baseline.
TradingView’s repainting documentation describes why later-confirmed pivots can appear at earlier chart positions. Preserving that timing is essential when converting a visual pattern into a test.
Research Double Patterns in LuxAlgo’s Native Charts
Start in LuxAlgo’s native charts with a specific symbol, interval, swing definition and confirmation rule. Use standard candles for execution-oriented tests and document any transformed display separately. Keep the same price and volume source when comparing experiments.
Ask Quant, our coding agent to express a supported hypothesis with explicit turn detection, confirmation, exits and sizing. Inspect the generated code and run it manually. Review strategy settings and individual trades to confirm that the implementation matches the intended timing and cost assumptions.
Check native data coverage and available history. The documented US-equity source is Cboe EDGX rather than a consolidated all-venue feed. Re-run the experiment after changing the symbol, interval or assumptions.
Frequently Asked Questions
When does a double top confirm?
Under the close-based convention discussed here, it confirms when price closes below the lowest intervening trough. Two similar peaks alone remain a candidate.
When does a double bottom confirm?
Under the same convention, price must close above the highest intervening peak. A second valley by itself does not establish an upward reversal.
Is a 5% breakout buffer mandatory?
No. It is an optional strategy condition rather than a universal identification rule, and it does not guarantee protection from false breaks.
What is the difference between Adam and Eve?
Adam is comparatively narrow and pointed, while Eve is wider and rounder. The names describe the first and second turns in chronological order.
Does a measured target determine the stop-loss?
No. A height projection is a reference level. Invalidation, sizing and execution rules are separate, and the target may never be reached.
Read next