Elliott Wave Theory for Beginners
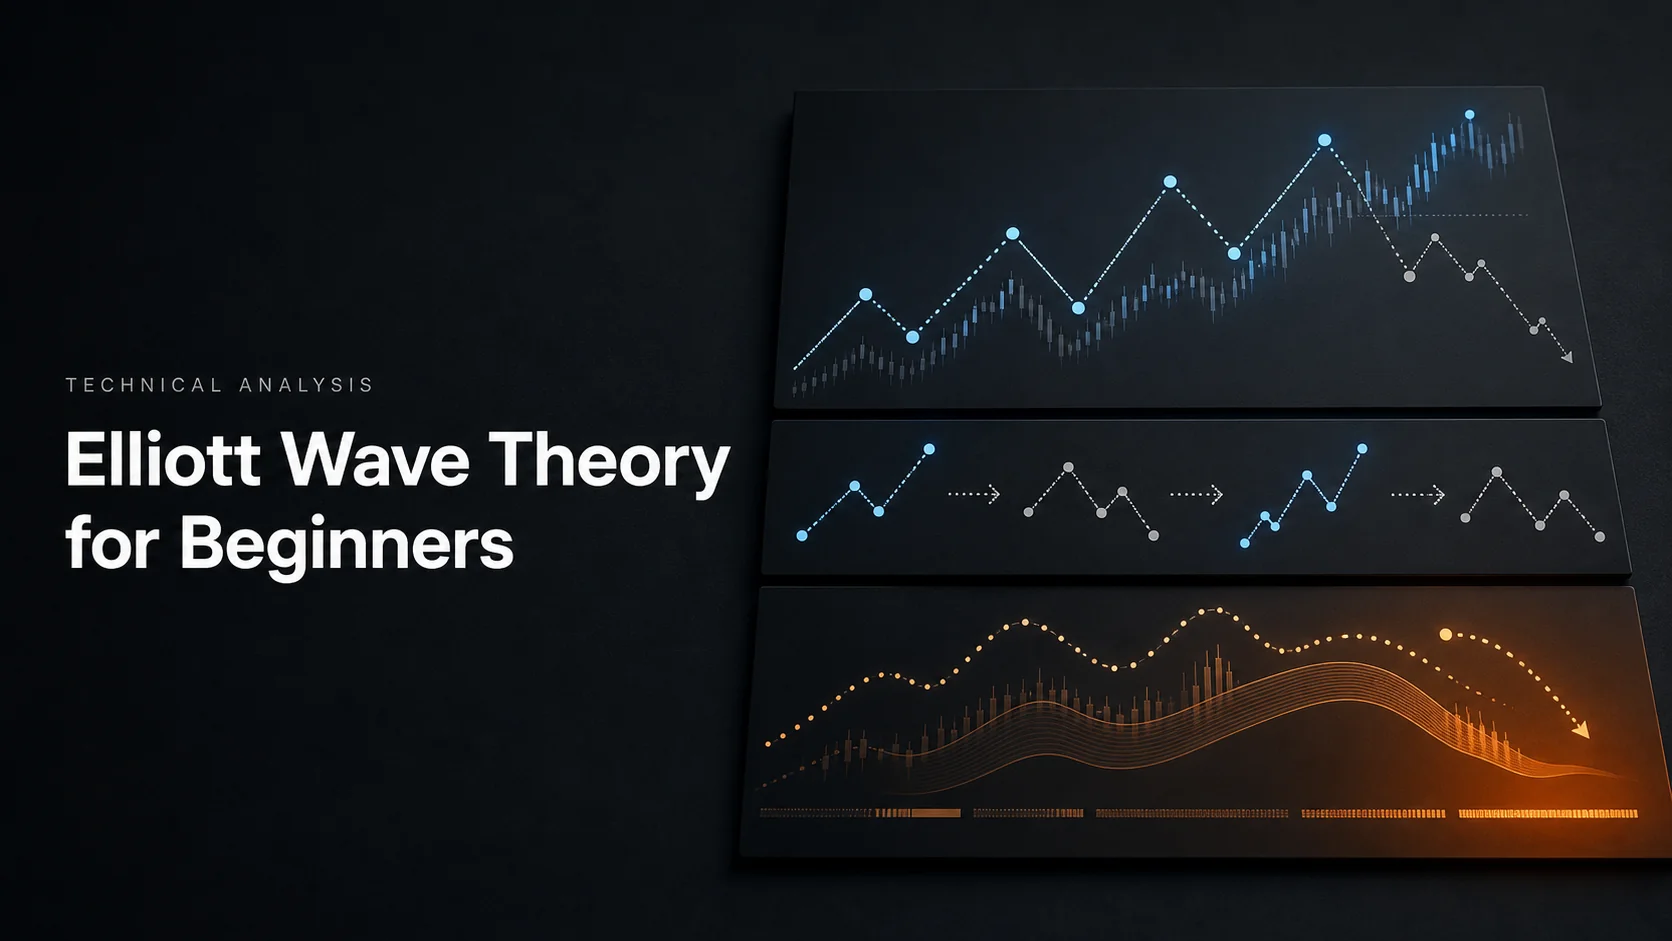
Elliott Wave Theory is a framework for labeling market swings as motive and corrective structures. Its best-known illustration is a five-wave advance followed by an A–B–C correction, but actual counts can be ambiguous and corrections have several forms. Treat a count as a hypothesis with explicit invalidation, not a forecast that price must follow.
For beginners, the useful starting point is to distinguish hard impulse rules from guidelines, mark what was knowable at each bar, and keep an alternative count. In Quant Charts, LuxAlgo’s native charting platform, you can organize those drawings and library studies, then use Quant to help test a precise rule.
What Does Elliott Wave Theory Describe?
Ralph Nelson Elliott developed the Wave Principle as a description of recurring market forms and crowd behavior. Elliott Wave International’s introduction presents the framework and its nested structures. Its claims about predictability describe the theory’s viewpoint; a label on a chart does not directly measure investor emotions or establish a profitable forecast.
The word degree describes a wave’s relative place in a larger structure. A small five-wave sequence might be part of one larger wave. Degrees are not assigned mechanically to particular chart intervals, and the framework does not mean that every visible swing contains an identical five-up, three-down pattern.
A motive structure progresses in the direction of the next larger trend. An impulse is one motive form; diagonals are another and have different structural rules. Corrective structures interrupt the larger trend. Reverse the price directions for a bearish example rather than assuming motive waves always rise.
The Three Hard Rules of a Standard Impulse
The standard Elliott impulse definition uses five waves, numbered 1 through 5. Waves 1, 3, and 5 travel with the move; waves 2 and 4 retrace part of it. Test the count against these rules:
- Wave 2 must not fully retrace wave 1. In a bullish count, it must hold above wave 1’s origin. A 61.8% retracement is not the maximum allowed depth.
- Wave 3 must not be the shortest of waves 1, 3, and 5. It does not have to be the longest. Compare price distances using a consistent measurement convention.
- Wave 4 must not enter wave 1’s price territory in a standard impulse. Diagonals are separate forms with different rules; do not relabel a violation as a diagonal merely to save a preferred count.
Wave 3 is often described as forceful or extended, and wave 5 may show reduced momentum. Those are tendencies, not substitutes for the rules. A strong rally alone cannot tell you that it is wave 3 without identifying the surrounding structure.
A Simple Bullish Count
Consider an illustrative sequence: start at 100, wave 1 ends at 110, wave 2 at 104, wave 3 at 120, wave 4 at 113, and wave 5 at 125. Wave 2 holds above 100, wave 4 remains above wave 1’s high of 110, and the motive-wave distances are 10, 16, and 12. Wave 3 is not the shortest, so these outer points pass the three basic checks.
Passing those checks is not enough to prove the count. Its internal subdivisions and larger context also matter. More importantly, the final wave-5 point at 125 was not available when price was at 104. A backtest cannot use the completed sequence to pretend it knew the end of wave 2 in advance.
Corrective Waves Are More Than A–B–C
A–B–C is a useful introduction, especially for a zigzag, but it is not a universal description of every correction. The corrective-wave guide distinguishes several common families:
| Form | Common labeling and subdivision | Beginner distinction |
|---|---|---|
| Zigzag | A–B–C, typically 5–3–5 internally | A sharp correction; a five-wave A leg is not the whole correction. |
| Flat | A–B–C, typically 3–3–5 internally | A more sideways form; B can retrace much more than a fixed 50–61.8% assumption. |
| Triangle | A–B–C–D–E, with three-wave internal legs | Five corrective legs, not a standard five-wave impulse. |
| Combination | Often W–X–Y, with connecting waves | Links corrective structures together; do not force every swing into one simple ABC. |
Wave B does not always stop between 50% and 61.8% of wave A, and wave C does not have to reach 1.618 times A. The applicable structure matters. Learn one simple form first and leave an uncertain correction unlabeled rather than adding detail without evidence.
What Does Market Psychology Add?
Wave descriptions often associate early motive movement with skepticism, a later expansion with growing confidence, and the final push with enthusiasm or exhaustion. Countertrend movement may be described as doubt or consolidation. These are explanatory narratives within the theory, not observations of every participant’s motives.
Volume and momentum can provide additional context, but cannot establish a unique count. A claim that a famous analyst predicted a particular crisis does not validate the method without the full dated record, alternatives, misses, and trading assumptions. Evaluate the count and its outcomes directly.
How to Mark Waves Without Hindsight
Start with a clear section of standard price candles and mark the major swings before assigning numbers. A daily or weekly view may reduce visual clutter, but higher timeframes are not automatically more reliable. Choose a horizon that suits the question, then inspect smaller intervals only when they help evaluate subdivisions.
- Set the scope: record the symbol, feed, session, timezone, timeframe, and the last completed bar you are allowed to see.
- Mark pivots: state how highs and lows are recognized. If a pivot requires later bars, record its availability time as well as its plotted time.
- Check structure: apply the hard rules and inspect internal subdivisions at a consistent degree.
- Keep alternatives: retain a primary and an alternative count with the price level or event that would invalidate each.
- Freeze the record: save the analysis before revealing later bars. Relabeling can be sensible, but it must not rewrite the historical decision.
The alternation guideline suggests that waves 2 and 4 may differ in depth, duration, or form—for example, a sharp second wave and a sideways fourth wave. It is a guideline rather than a mandatory law. Likewise, a wave-5 momentum divergence is a condition to investigate, not proof that a reversal is imminent.
Using Fibonacci with Elliott Waves
Fibonacci retracements and projections help describe candidate price relationships. They do not confirm that a wave has ended. Mark the anchors and the formula, because “161.8% of wave 1” is ambiguous unless you specify where the length is projected from.
If wave 1 runs from 100 to 110, its length is 10. A 61.8% retracement from the high is 110 − 0.618 × 10 = 103.82. If wave 2 ends at 104, projecting 1.618 times wave 1 from that point gives 104 + 1.618 × 10 = 120.18. These are two different measurements, not guaranteed turning points.
For a possible ABC decline, suppose A falls from 125 to 115 and B rebounds to 121. A C leg equal to A projects to 111; a C leg 1.618 times A projects to 104.82. Record both as scenarios if they are part of the method, rather than choosing whichever target fits after the move.
The 38.2%, 50%, 61.8%, and 161.8% levels are common analytical references. The 50% retracement is a convention rather than a Fibonacci ratio. Wave 2 is not capped at 61.8%, wave 4 is not required to retrace exactly 38.2%, and a favorable projection cannot override an invalid impulse count.
Wave Analysis in Native LuxAlgo Charts
Use Quant Charts as the workspace for the analysis. Native drawing tools include Lines, Fibonacci, Patterns, and text tools. Anchor the candidate swings and invalidation levels in time and price, and manage the annotations in the Object tree.
A weekly, daily, and four-hour arrangement is one possible starting point, not a required hierarchy. The final high, low, or close of an unfinished larger bar is unavailable to an earlier entry. Several aligned panels also reuse the same price history; they are not independent confirmations.
LuxAlgo’s Elliott Wave Library Indicator
The Elliott Wave library indicator constructs candidate impulse and corrective labels from ZigZag pivots and draws Fibonacci retracement references. The page offers Open on Quant Charts; you can also find library studies through the native indicator picker.
Its settings include upper and lower pivot sources and ZigZag length. Changing them changes which swings qualify. Current documentation distinguishes invalidated motive counts with dotted lines and corrective counts with dashed lines. Treat evolving or invalidated labels as part of the information, rather than hiding them to make a historical chart look cleaner.
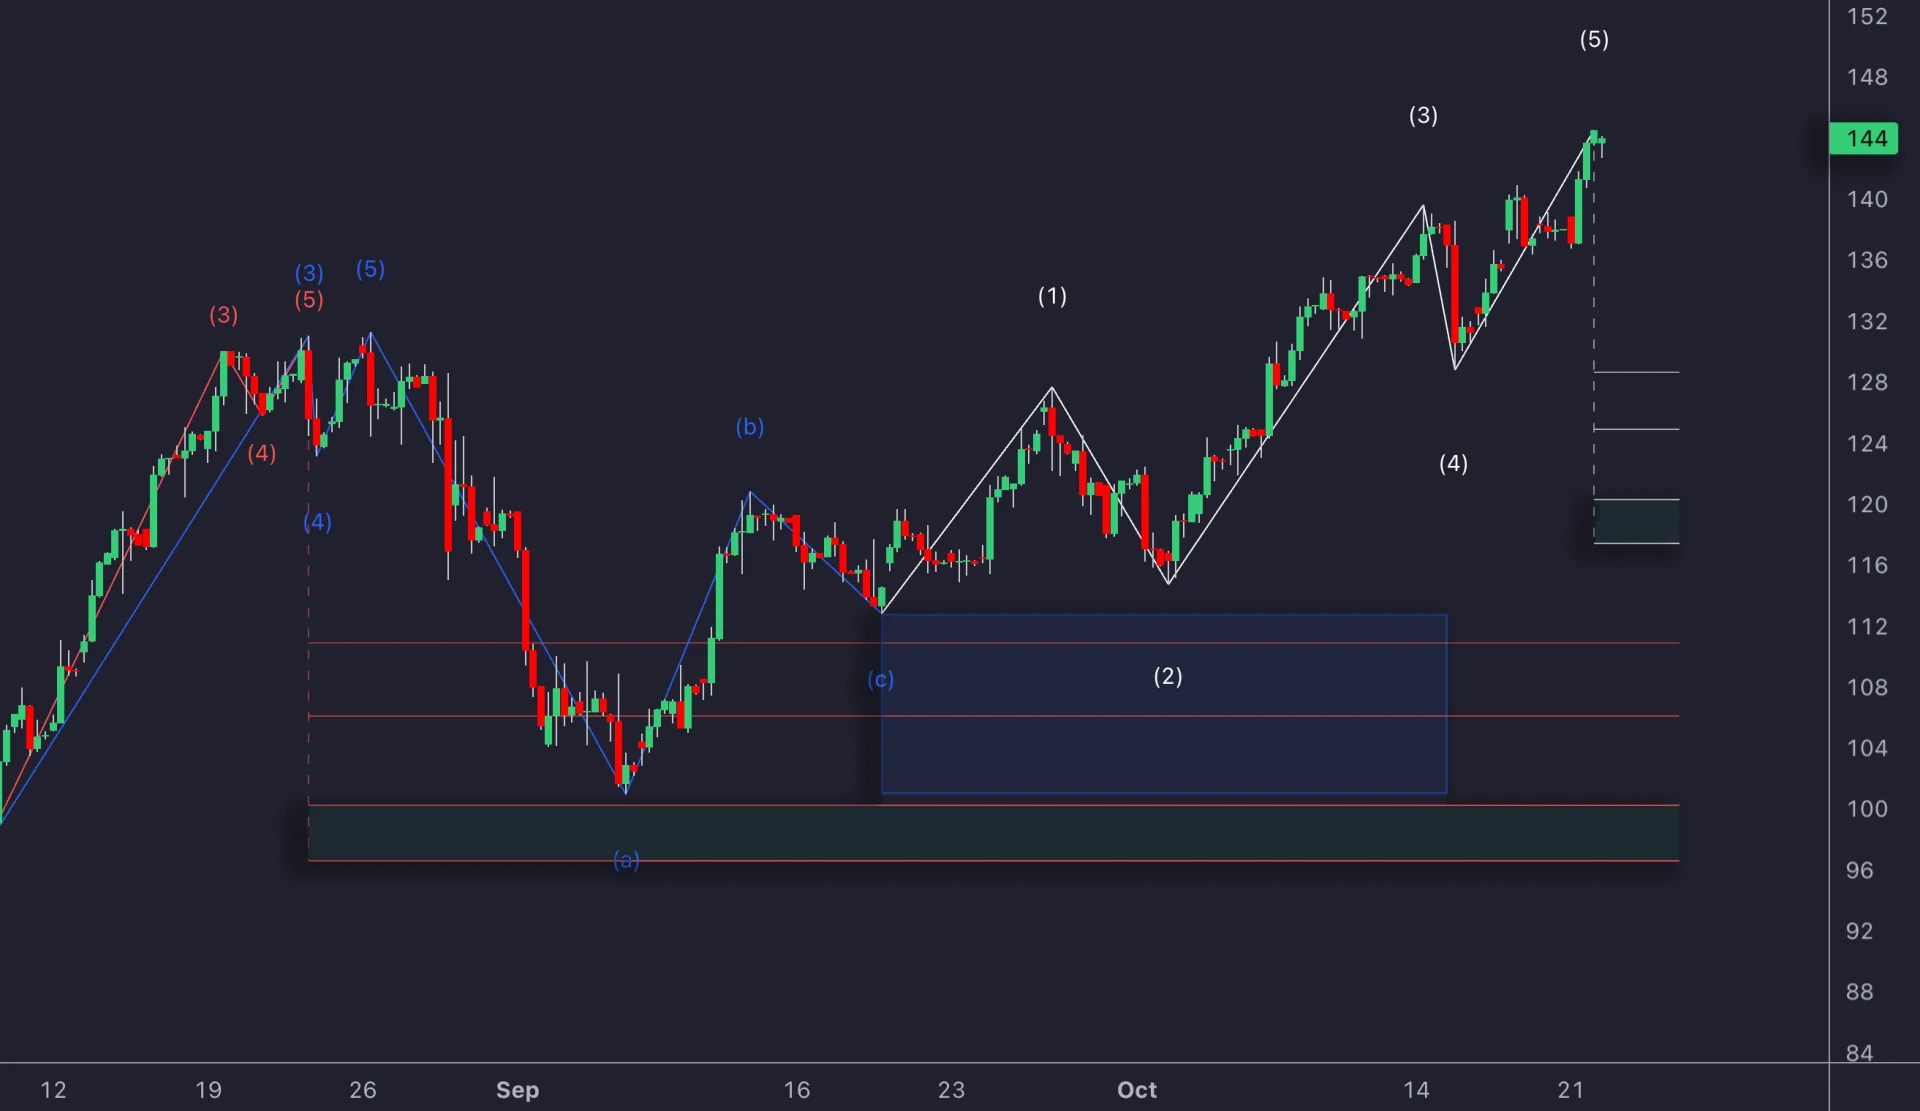
An automatic count saves labeling work but does not remove ambiguity or future-data risk. Inspect the current code and pivot timing before testing entries. Do not assume that a label drawn at a prior high was available on that bar, or that the study covers every possible Elliott structure.
Comparing Other Charting Tools
MotiveWave also offers dedicated wave-analysis tools. Its current Elliott Wave documentation distinguishes static Auto Wave and Auto Analyze outputs from a dynamic Auto Elliott Wave study that can revise counts as new data arrives. Check the edition and workflow you need rather than assuming every paid tool is automatic or every free tool is manual.
TradingView and MetaTrader are other charting environments to consider for manual study or simulated practice, depending on the configured tools and account. Compare drawing controls, replay or simulation support, data access, and exportability. Price alone does not establish analysis quality; confirm current licensing and feature availability before choosing software.
Turn a Wave Scenario into a Trading Rule
The apparent end of wave 2 or wave 4 is only obvious after enough later movement occurs. A testable entry needs an observable trigger, such as a completed break above a defined reaction high after the candidate correction. That trigger can enter later and at a different price than the chart’s ideal turning point.
Separate count invalidation from a trade stop. A stop below a candidate wave-2 low may be closer than the origin of wave 1. Hitting it can stop the trade even while an alternative valid count remains possible. For wave 4, define the selected low and the standard impulse’s overlap boundary separately.
A Worked Risk Example
Suppose a candidate bullish setup produces an actual entry at 105, a planned stop at 103.50, and a target at 109.50. Planned price risk is 1.50 per unit and potential gross reward is 4.50, or 3R. A 150 price-risk budget permits 100 units before costs and execution allowances.
With 10 in total costs and exact planned fills, the modeled stop loss is 160 and target profit is 440, giving a net reward-to-loss ratio of 2.75. A gap or worse stop fill increases the loss. A favorable Fibonacci level or a wave-3 label does not justify a fixed risk increase to 1.5% of the account.
Partial exits also change the payoff. Taking half at 2R and half at 3R produces 2.5R gross if both fill; it is not the same as holding the entire position to 3R. Specify the partial-exit and trailing-stop rules in advance rather than assuming every wave 3 will extend.
Test Explicit Wave Rules with Quant
Ask Quant, our coding agent to implement the exact pivot rule, allowed pattern, invalidation, entry timing, stop, target, sizing, and time exit. State whether invalidated or revised counts can create another signal and whether only one trade is allowed per pattern.
Inspect the generated code and run manually in the native strategy workflow. Check that later-confirmed pivots and completed waves are not used at earlier timestamps. Include costs, inspect individual trades, and evaluate a later period that did not guide the settings.
For discretionary analysis, keep dated screenshots of the initial count, alternatives, and changes. A strategy based on a hindsight-only count is not reproducible evidence. Record failed patterns and missed fills as well as targets that were reached.
Common Beginner Mistakes and a Practice Routine
| Mistake | Practical correction |
|---|---|
| Forcing a preferred count | Apply the hard rules and preserve an alternative; leave unclear structures unresolved. |
| Treating guidelines as laws | Use Fibonacci, alternation, volume, and momentum as conditions to evaluate, not proof. |
| Assuming a pivot was known immediately | Separate the bar being labeled from the bar when confirmation became available. |
| Changing risk by wave label alone | Size around the defined stop, costs, execution risk, and total exposure. |
| Retuning after every outcome | Keep a fixed rule version and a later evaluation period. |
Volume may expand during a motive move and contract during a correction, but this is not a hard wave rule. OBV accumulates signed bar volume; VWAP is a volume-weighted average price from a chosen anchor or session. They measure different things and neither validates a count by itself. Check the volume source, especially when using forex tick activity or a single crypto venue.
Choose one liquid instrument and one simple structure for practice. Mark a count using only the information available at a chosen cutoff, record the invalidation and any alternate scenario, then reveal later bars. Review the record on a regular schedule. A fixed 15-minute analysis limit or a quota of two or three assets is optional organization, not a formula for accuracy.
Simulation can help you learn the workflow without committing trading capital, but simulated fills and historical results have limitations. The objective is a clear, falsifiable process rather than making every chart fit the theory.
Elliott Wave Beginner Video
The retained Elliott Wave Options tutorial, Elliott Wave Theory for Beginners | ULTIMATE In-Depth Guide!, introduces wave terminology and chart examples. Treat its historical counts as educational interpretations and apply the rule-versus-guideline and timing distinctions above.
Frequently Asked Questions
What are the principles of Elliott Wave Theory?
The framework labels motive and corrective structures that nest within larger structures. A standard impulse has five waves, while corrections include zigzags, flats, triangles, and combinations. Counts are interpretations with defined rejection criteria, not guaranteed forecasts.
How do you read Elliott waves?
Mark significant swings, choose a consistent degree, test the impulse rules, and inspect subdivisions. Record when pivots became knowable and keep an alternative count. Do not identify an entry using later information from a completed pattern.
What are the three rules of a standard impulse?
Wave 2 must not fully retrace wave 1, wave 3 must not be the shortest of waves 1, 3, and 5, and wave 4 must not overlap wave 1’s price territory. Diagonals are distinct forms with different structural rules.
What does Elliott Wave 1–2–3–4–5 mean?
It labels a five-wave motive sequence. In a bullish example, waves 1, 3, and 5 advance while 2 and 4 retrace; reverse the directions for a bearish sequence. The labels alone do not specify entry timing or position size.
Are all Elliott corrections three waves?
No. A simple zigzag uses A–B–C with a 5–3–5 internal structure, a flat commonly uses 3–3–5, a triangle has five corrective legs, and combinations link several corrective forms. The basic 5–3 illustration is not a complete taxonomy.
Read next