ETFs Demystified: Benefit Your Portfolio
An exchange-traded fund, or ETF, is a pooled investment that trades on a stock exchange like a share while holding a portfolio like a fund. The US Securities and Exchange Commission's investor education office defines it as a fund registered under the Investment Company Act of 1940 that pools investors' money into stocks, bonds or other assets, with each share representing a proportionate slice of the portfolio and the income it earns. That structure is why ETFs have become the default building block of many portfolios: broad exposure in one ticker, intraday pricing, low minimums and, for many funds, fewer taxable distributions than a comparable mutual fund. This guide explains how an ETF works and how it differs from a mutual fund, what the fees and tax mechanics actually are according to the SEC, the main fund types and the risks specific to index tracking, how to read an ETF's price against its net asset value, and where Quant Charts, LuxAlgo's charting and AI platform, fits: a Watchlist that holds an ETF list with price, sector and allocation views, Library concepts for relative strength and correlation that turn a list of funds into a comparison, and Quant, the coding agent, to backtest a rule such as a trend filter on a broad-market fund before you rely on it.
Key points:
- Price and value are two numbers. An ETF trades at a market price all day; its net asset value is computed once a day, and the two can differ by a premium or a discount.
- Fees are indirect and compound. Management fees come out of fund assets; the SEC's own illustration shows a 0.25 point fee difference costing thousands over twenty years.
- Tax efficiency has a mechanism. In-kind creation and redemption is why many ETFs distribute fewer capital gains, and the advantage disappears inside a tax-advantaged account.
- The name tells you little. Some ETFs track a single stock, some products called ETFs are not registered funds at all, and the prospectus is the only reliable description.
How an ETF Works
The SEC's ETF overview on Investor.gov draws the lines precisely. An ETF must register as an open-end investment company or a unit investment trust, which puts it under the same disclosure regime as a mutual fund: a prospectus, shareholder reports and portfolio holdings filed with the SEC and available free on EDGAR. Its portfolio is usually run by an SEC-registered adviser. What differs is the plumbing. Retail investors do not buy shares from the fund or redeem them to it; they trade shares on a national exchange with other investors, at whatever the market price is when the market is open. The fund's own share creation and redemption happens in the background between the fund and large financial institutions, typically as in-kind exchanges of shares for baskets of the underlying securities, and that in-kind mechanism is what the SEC credits for the tax behaviour discussed below.
The overview lists the reasons investors choose ETFs: professional management, diversification across companies and sectors, a low minimum since a single share is often an affordable amount, liquidity at the market price throughout the day, and a tax advantage from in-kind transactions. It also adds two cautions worth keeping. Some ETFs are less diverse than others and may even track the performance of a single stock, so the label does not guarantee a spread of risk. And the page covers only ETFs registered under the 1940 Act; exchange-traded commodity trusts and exchange-traded notes are different products with different protections, even when they use the same three letters in their names. The SEC's characteristics bulletin, updated in April 2025, makes the same point from the other side: you cannot always tell from a fund's name whether it is a mutual fund, an ETF or something else, and the investment strategy section of the prospectus is where to check.
ETF Versus Mutual Fund
The characteristics bulletin is the clearest official comparison, and it is more balanced than most marketing. The similarities are substantial: both are SEC-registered pooled investments, both are usually professionally managed, both can be diversified or narrow, both are liquid, both can follow a passive index strategy or an active one, and both charge fees whether or not they perform. The differences come down to three mechanics.
| Mechanic | Mutual fund | ETF | What it means for you |
|---|---|---|---|
| Buying and selling | From and to the fund itself, or through an intermediary; shares are redeemable; multiple share classes with different fee structures | Only in market transactions on an exchange; the fund does not deal directly with retail investors | You need a brokerage account for an ETF; a broker or adviser can help with either |
| Pricing | At the net asset value per share, usually calculated at the end of the business day; you do not know the exact price when you place the order | At the prevailing market price throughout the day, which may be above or below NAV | ETFs give you a known price at the moment of the trade, at the cost of a possible premium or discount |
| Fees | Management fees deducted from assets, plus fees charged directly for buying, selling, exchanging or account maintenance | Management fees deducted from assets; generally no direct fund fees on purchase or sale, but broker commissions and other transaction costs may apply | Total cost of ownership is the number to compare, not the headline expense ratio alone |
| Taxes in a taxable account | Capital gains distributions are taxable to holders | Distributions are also taxable, but in-kind exchanges typically mean fewer of them | No tax difference at all inside a 401(k) or IRA |
The pricing row deserves emphasis because it is the source of both the ETF's appeal and its main trap for a new investor. An ETF's net asset value is its assets minus liabilities divided by shares outstanding, calculated once a business day. Its market price is whatever buyers and sellers agree during the session. The bulletin says the market price generally stays close to the end-of-day NAV but may vary significantly, and that an investor may therefore pay more or receive less than the underlying value. For large, heavily traded funds the gap is usually small; for thin or exotic funds, and for any fund during a disorderly market, it can be material, which is why limit orders and a glance at the bid-ask spread belong in the routine.
What Fees Really Cost
The SEC's glossary defines the expense ratio as the percentage of a fund's average net assets used each year to pay operating expenses, including management fees, distribution or service fees and acquired fund fees, and points to the prospectus fee table as the place it is disclosed. Because those costs are deducted from fund assets, you never see a bill, which is exactly why they are easy to ignore. The SEC's fees page supplies the illustration that makes the point without any cherry-picked fund data.
| Annual fee | Value after 20 years | Cost of the fee versus 0.25% |
|---|---|---|
| 0.25% | About $208,000 | Baseline |
| 0.50% | About $198,000 | About $10,000 |
| 1.00% | About $179,000 | About $29,000 |
The scenario is a $100,000 investment growing 4 percent a year before fees for twenty years. Three quarters of a point of annual fee, the gap between the cheapest and dearest lines, removes roughly $29,000 of the ending value. Two more cost lines sit outside the expense ratio. Brokerage commissions, where your broker charges them, apply to every ETF purchase and sale. And the bid-ask spread is a cost paid on every trade whether or not anyone calls it a fee; the more often you trade, the more of your return it takes. The SEC's question list is the right habit: ask what it costs to buy, own and sell the fund, and how much it must gain before you break even.
Types of ETFs and Index Risk
The SEC groups ETFs into stock funds, bond or income funds, target date funds that hold a mix of other funds and shift toward bonds as their date approaches, and money market ETFs holding short-term debt and cash equivalents. Within each, the fund either tracks an index passively or is actively managed, and the overview notes that passive management usually means less trading, lower realised capital gains and lower fees, while an active fund's result depends heavily on the manager's skill. Two warnings from the same pages are easy to miss. A target date fund that invests in other funds may carry a double layer of fees. And index funds carry their own risks, set out on the SEC's index funds page: lack of flexibility to react to declines in index constituents, tracking error when a fund holds only a sample of the index, and underperformance of the index itself because of fees, trading costs and that tracking error. An index fund is designed to match its benchmark before fees, which means it is designed to trail it slightly after them.
Reading an ETF Before You Buy
The SEC's advice reduces to four questions: what will it cost to buy, own and sell; what specific risks does this fund carry; how is the index constructed, if there is one; and how does the strategy fit your goals. The documents that answer them are the prospectus, the most recent shareholder report and the quarterly holdings, all free from the fund or on EDGAR. The practical additions for a trader are the ones the bulletin implies rather than states: check the fund's average volume and typical spread before sizing a position, compare its price to its published NAV or indicative value to see how it has traded relative to its holdings, and use a limit order so a wide spread or a volatile open does not set your price for you. And decide in advance whether the fund is a core holding to be rebalanced or a tactical position to be traded, because the two call for different tools.
Where Quant Charts Fits
Quant Charts does not hold prospectuses, expense ratios or NAV data, and it is not a brokerage; the fund documents come from the issuer and the SEC, and the trade happens at your broker. What it holds is the place to keep, compare and test the funds you are considering. The Watchlist Advanced view puts an ETF list in a table with price, change, volume, market cap, sector and 52-week range, a summary row with breadth and the day's best and worst names, your own Sections for grouping core holdings apart from tactical ones, and an Allocation panel that draws a donut by asset class, with ETFs as their own class, plus a sector-exposure view for equities. The docs are candid about one limit: sector, market cap and financials come from public company data and are available for stocks, while ETFs are grouped as their own bucket because the data reports a fund's issuer rather than its holdings. Holdings-level exposure still comes from the fund's own disclosures.

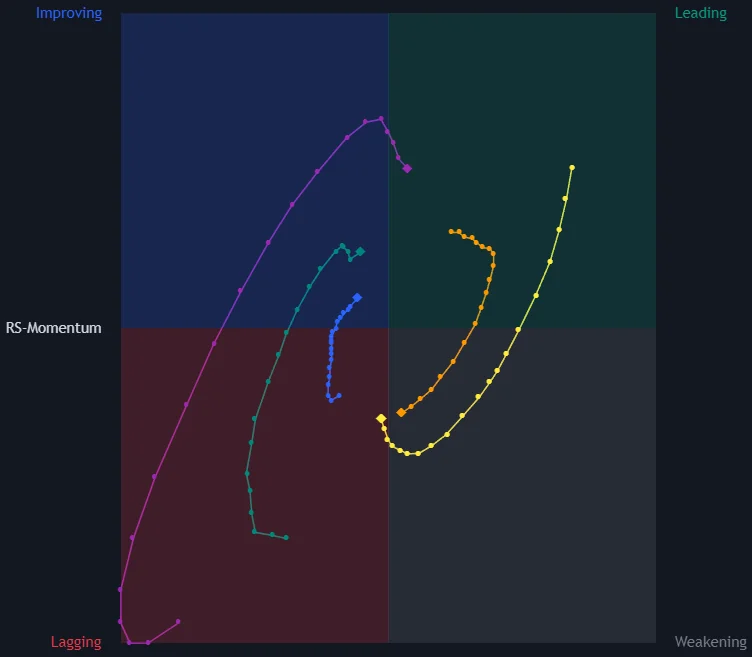
The Library supplies the comparisons a list of funds invites. The relative strength comparative entry explains the RS line, a fund's price divided by a benchmark such as a broad-market ETF, which rises when the fund outperforms even in a falling market, and the ratio charts entry covers the same tool for any pair, such as stocks against bonds or one sector against another. The Relative Strength Scatter Plot indicator plots several sector or country ETFs on a four-quadrant graph of relative strength against momentum versus a benchmark, in the spirit of relative rotation graphs, which is the fastest way to see which parts of a diversified list are leading and which are fading. And the correlation entry is the one that matters most for diversification: it recommends rolling correlation of returns rather than prices, because two trending funds can look correlated when they are not, and it is the honest test of whether the bond fund in a portfolio is actually offsetting the stock fund in the periods that matter.
For a tactical position, Quant Charts is also where the rule gets tested. The most common ETF timing rule is a trend filter, and the Library's moving average crossovers and golden cross entries explain both the logic and the caveat: the 50-day over 200-day cross is a lagging, regime-level statement with a mixed record that varies by market and era, not a timing signal. Rather than take that on faith, describe the rule to Quant in plain language, for example hold the fund while its close is above the 200-day average and stay in cash otherwise, evaluated on daily bars. Quant writes the Pine Script as a strategy, you inspect it under Code and click Run, and the Backtest Summary reports net profit, trade count, win rate, maximum drawdown and profit factor across the chart's history, with commission and slippage set in the strategy Properties so the filter's trading costs are counted against it. The drawdown statistics and Sharpe ratio entries explain how to compare that result with simply holding the fund, which is the comparison a trend filter has to win. Two cautions from the docs apply: run the test on the exact fund and timeframe you will trade, because results from another market do not transfer, and use a standard chart type, since Heikin Ashi candles do not produce realistic backtests.
Where Each Tool Stops
The fund's documents and the SEC's resources tell you what an ETF holds, what it costs and how it is taxed; nothing on a chart replaces the prospectus and the shareholder report. Your broker executes the trade and sets the commission. Quant Charts holds the list, the comparisons and the test: Watchlist tables and allocation, Library concepts and indicators for relative strength and correlation, and Quant's strategies with the Backtest Summary. It does not report expense ratios or NAV, does not see a fund's holdings, and does not place orders. The LuxAlgo platform does not place orders for you; it is a charting platform.
Conclusion
ETFs earn their popularity on mechanics rather than magic: a registered fund's diversification and disclosure, an exchange-listed share's intraday price and low entry point, and an in-kind creation process that tends to hold down taxable distributions. The same mechanics carry the risks the SEC spells out, a market price that can drift from value, fees that compound quietly, index funds that trail their benchmarks by design, and names that promise more diversification than the holdings deliver. Read the prospectus, compare total cost rather than headline fee, and use limit orders. Then keep the funds you are weighing on a Quant Charts Watchlist, compare them with the Library's relative strength and correlation tools, and let Quant's Backtest Summary decide whether any timing rule beats simply holding the fund.
Key Takeaways
- An ETF is an SEC-registered fund whose shares trade on an exchange at a market price that can sit at a premium or discount to its once-a-day net asset value.
- Management fees are deducted from assets; the SEC's illustration shows a $100,000 investment ending about $29,000 lower over 20 years at a 1.00% fee than at 0.25%.
- In-kind creation and redemption is why many ETFs distribute fewer capital gains; the advantage does not exist inside tax-advantaged accounts.
- Index ETFs carry tracking error and trail their index after fees; some ETFs track a single stock, and some exchange-traded products are not registered funds.
- Quant Charts keeps the list and runs the comparison and the test: Watchlist allocation, Library relative strength and correlation, and Quant's costed Backtest Summary.
FAQs
What is an ETF?
An exchange-traded fund is an investment company registered with the SEC that pools investors' money into a portfolio of stocks, bonds or other assets, with shares that trade on a stock exchange at market prices throughout the day. Each share represents a proportionate ownership of the portfolio and its income. Exchange-traded commodity trusts and notes are different products despite similar names.
How is an ETF different from a mutual fund?
Mutual fund shares are bought from and redeemed to the fund at the end-of-day net asset value; ETF shares are traded between investors on an exchange at a market price that may be above or below NAV. ETFs generally charge no direct fund fees on purchase or sale, though broker commissions may apply, and their in-kind structure typically means fewer capital gains distributions.
How much do ETF fees matter?
A great deal over time. The SEC's illustration shows $100,000 growing 4 percent a year for 20 years ending at about $208,000 with a 0.25 percent annual fee, about $198,000 at 0.50 percent and about $179,000 at 1.00 percent. Add brokerage commissions and the bid-ask spread on every trade, and compare total cost rather than the headline expense ratio.
Are ETFs more tax-efficient?
Often, in a taxable account. Because many ETFs create and redeem shares through in-kind exchanges of securities rather than cash sales, they typically have fewer capital gains distributions than mutual funds. Distributions that do occur are still taxable, and the SEC notes there is no tax difference between an ETF and a mutual fund held inside a tax-advantaged account such as a 401(k) or IRA.
What risks do index ETFs carry?
The SEC lists three: lack of flexibility to react to declines in index constituents, tracking error when the fund holds only a sample of the index, and underperformance of the index because of fees, trading costs and tracking error. Any fund also carries the market risk of its holdings, and the market price can drift from net asset value, especially for thin funds or in stressed markets.
How does Quant Charts help with ETFs?
It keeps an ETF list in a Watchlist with price, sector and allocation views, offers Library concepts and indicators for relative strength, ratio charts and rolling correlation to compare funds, and lets Quant write a strategy, such as a 200-day trend filter, whose Backtest Summary reports net profit, trade count, win rate, max drawdown and profit factor with costs. It does not report NAV or expense ratios and does not place orders.
References
LuxAlgo Resources
- Quant Charts
- Watchlist Advanced view
- Quant: making strategies and the Backtest Summary
- Strategies: reading the backtest
- Library concept: relative strength comparative
- Library concept: ratio charts
- Library concept: relative rotation graphs
- Library concept: correlation
- Library concept: moving average crossovers
- Library concept: golden cross
- Library concept: drawdown statistics
- Library concept: Sharpe ratio
- Library: Relative Strength Scatter Plot
External Resources
Read next