Futures Contracts Explained: The Basics
A futures contract is an agreement to buy or sell a specific quantity of an asset at a price fixed today for delivery or settlement on a future date. The terms are standardized by the exchange that lists the contract, every trade is cleared through a clearing house, and positions are settled to market price every day. That structure lets a wheat farmer lock in a harvest price and lets a trader take a view on an index with a fraction of its value on deposit. This guide follows the CFTC's own explanation of how futures work: the contract terms, the participants, margin and daily settlement, the shape of the futures curve, and how Quant Charts charts CME futures and tests rules on them.
What a Futures Contract Is
The CFTC describes a commodity futures contract as an agreement to buy or sell a particular commodity at a future date, with the price and the amount fixed at the time of the agreement. Most contracts contemplate delivery of the commodity; some allow cash settlement instead; and most are liquidated before the delivery date by taking an offsetting position. With limited exceptions, futures and options on futures must be traded through an exchange by persons and firms registered with the CFTC.
Exchanges set the standardized terms. The CFTC lists the contract size, the delivery months, the last trading day, the delivery locations and the acceptable grades of the commodity, with fixed premiums or discounts for other grades. Standardization is what makes a futures contract liquid: many participants trade the same instrument, which is also why it hedges well but serves poorly as a bespoke merchandising agreement. A futures contract differs from a forward contract in that it can be offset; a forward sold to a different counterparty leaves the holder with two obligations, one long and one short.
| Term | What it fixes | Example from CME Group's E-mini S&P 500 specification |
|---|---|---|
| Contract unit | How much of the underlying one contract represents | $50 times the S&P 500 Index |
| Price quotation | The unit in which the price is stated | U.S. dollars and cents per index point |
| Minimum price fluctuation | The smallest price step, or tick, and its dollar value | 0.25 index points, worth $12.50 per contract |
| Listed contracts | Which expiry months trade | Quarterly contracts for March, June, September and December, listed for 21 consecutive quarters |
| Settlement method | Physical delivery or cash settlement at expiry | Set per product; the CFTC notes some contracts allow cash settlement in lieu of delivery |
The tick value is the number that turns a chart move into money. For the E-mini S&P 500, a move of one index point is four ticks, or $50 per contract. Exchanges also list smaller contracts on the same underlying so that the dollar value of a point can be scaled to the account.
Hedgers, Speculators and the Clearing House
The CFTC divides participants into two groups. Most are hedgers, commercial or institutional producers and consumers of the commodity who trade futures to protect the value of what they own or must buy. The rest are speculators who attempt to profit from price changes and, in doing so, supply the liquidity hedgers need.
The CFTC's example is a Kansas wheat farmer. Planting a crop makes the farmer effectively long wheat; selling futures at the current price of the December contract locks in the sale price. At harvest the farmer does not deliver to a distant exchange location but buys back the contracts, offsetting the position, and sells the wheat locally. If the price fell, the gain on the short futures offsets the lower cash price; if it rose, the futures loss is offset by a better cash sale. The delivery provision exists to force convergence between the futures price and the cash price at expiry, not because most participants intend to deliver.
Every trade on an exchange is cleared through a clearing house that becomes the buyer to every seller and the seller to every buyer. Because both sides of a position face the same clearing house, buying a contract and later selling it extinguishes the position rather than leaving two contracts with two counterparties. This is the mechanism that removes counterparty risk from exchange-traded futures.
Margin and Daily Settlement
Futures traders do not pay the full value of a contract. They post margin, which the CFTC describes as a performance bond rather than a down payment, typically between two and ten percent of the contract's value. The exchange or clearing house sets the initial margin required to open a position; positions are then marked to market every day, with gains credited to and losses debited from the margin account.
| Term | Meaning |
|---|---|
| Initial margin | The deposit required to open a position, set by the exchange or clearing house |
| Mark to market | Daily settlement of each position's gain or loss to the margin account |
| Maintenance margin | The minimum balance, set at or below initial margin, that the account must hold |
| Variation margin | The additional deposit required when the balance falls below maintenance, restoring it to the initial level |
| Futures commission merchant (FCM) | The registered firm that carries the account; it may require more margin than the exchange minimum |
The CFTC's illustration: with initial and maintenance margin of $650 per wheat contract, a farmer who sells 10 contracts deposits at least $6,500 through an FCM. Each day the position is marked to market; a fall in the futures price credits the account, a rise debits it, and any day the balance falls below $6,500 the farmer must post variation margin to restore it. The same arithmetic applies to a speculator, which is why the CFTC warns that losses can exceed the initial deposit: the daily debits continue for as long as the position is open and the market moves against it.
The Futures Curve: Contango and Backwardation
Because several expiry months trade at once, a futures market has a curve rather than a single price. When later-dated contracts trade above nearer ones, the curve is in contango; when they trade below, it is in backwardation. Storage, financing and insurance costs push a physical commodity's curve toward contango; tight immediate supply pulls it toward backwardation. Convergence means each contract's price meets the cash price as it approaches expiry, so a position held across expiries experiences the curve's slope as a cost or a gain when it is rolled from one month to the next. The shape of the curve is therefore part of the position, not just of the price chart.
Regulation, Registration and Risk Warnings
Futures on agricultural commodities have traded in the United States for more than 150 years and have been under federal regulation since the 1920s; the CFTC itself was created in 1974. Firms and individuals who handle customer funds or give trading advice must register with the National Futures Association, the self-regulatory organization approved by the CFTC, and the NFA's BASIC database lets anyone check a firm's or individual's registration and disciplinary history for free.
The CFTC requires firms to disclose market risks and past performance to prospective customers, to keep customer funds in accounts separate from the firm's own, and to adjust customer accounts to each day's market value. It also states plainly that speculating in futures and options is a volatile, complex and risky venture that is rarely suitable for individual investors, that many individuals lose all of their money, and that they can be required to pay more than they invested. Before opening an account it recommends knowing how much you can afford to lose beyond the initial deposit, understanding every obligation of the contract, and reading the risk disclosure documents the broker must provide.
Where Quant Charts Fits
LuxAlgo does not carry futures accounts, set margin or place orders; those functions belong to the FCM and the clearing house. What Quant Charts adds is the chart and the test bench: CME futures data, tools that run on candles, and a way to see what a rule would have done in dollar terms before a contract's tick value turns it into real money.
Chart CME futures. Quant Charts sources CME futures on the Premium, Ultimate and Ultra plans as candle data, alongside crypto and US equities on every plan. Open Symbol Search and use the Futures tab to find the contract. Because futures arrive as candles rather than order-flow footprints, footprint-based tools warn rather than draw, while TPO, VWAP and the Visible Range Volume Profile run on every market.
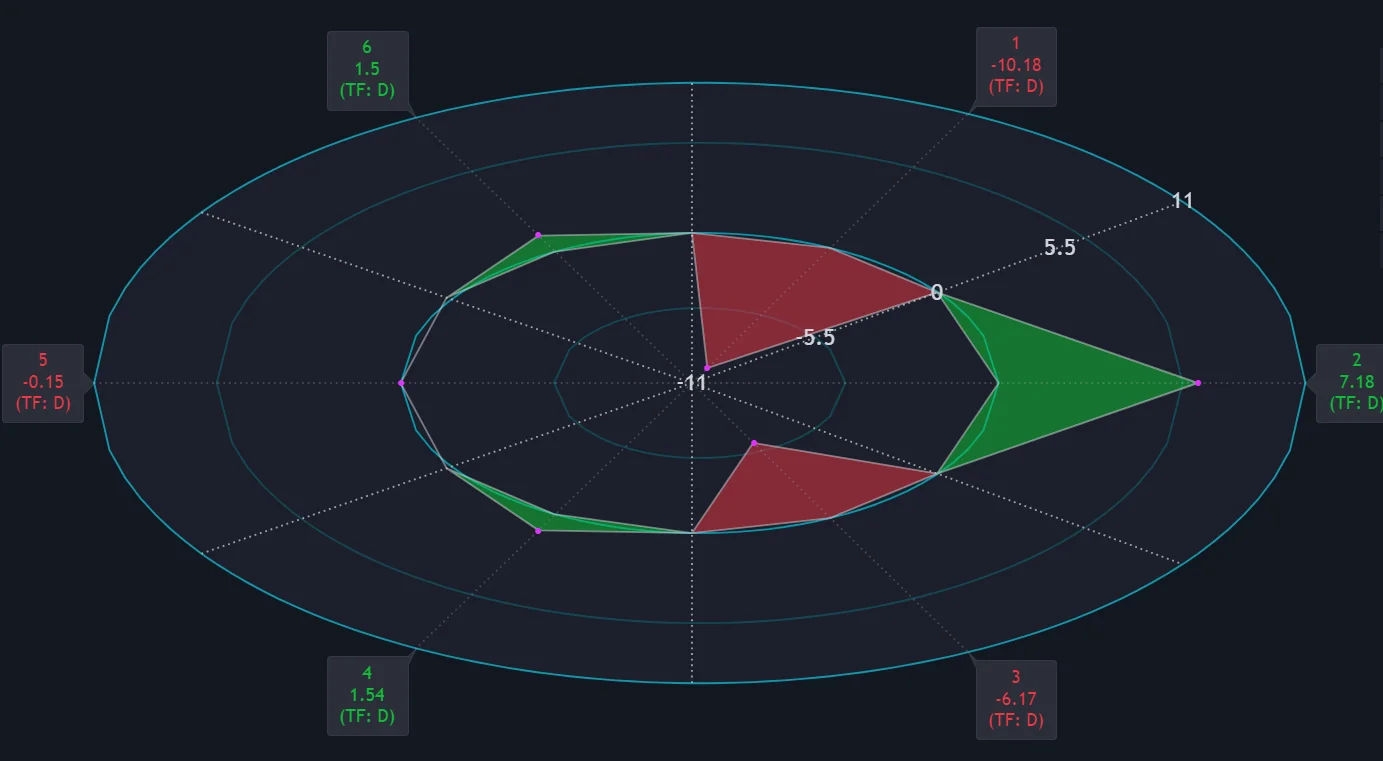
Read participation with open interest. The Library's open interest entry explains the futures-specific measure: the number of contracts open, rising only when a new buyer and a new seller both enter and falling when both close. Paired with price direction it separates fresh money from position squaring: price up with open interest up suggests new longs, price up with open interest down suggests short covering. The Open Interest Chart indicator plots the percentage change in open interest for up to six futures tickers at once, including CFTC Commitments of Traders series, colored green when money enters a market and red when it leaves.
Size from the tick value, not the notional. A futures position is sized in contracts, and the loss at the stop is the stop distance in ticks multiplied by the tick value and the contract count. The Library's sizing bases entry works through exactly this case, and fixed fractional sizing converts a chosen fraction of the account into a contract count once the stop is known. Margin decides whether the exchange lets you hold the position; the tick arithmetic decides whether you should.
Backtest in contract terms. Describe a rule to Quant, our coding agent, in plain language, for example a long entry on a close above the prior session's high with a stop below the session's low, on the front-month E-mini S&P 500 chart. Quant writes the Pine Script; open Code to inspect it, then click Run. The Backtest Summary reports net profit, trade count, win rate, max drawdown and profit factor. In the strategy's Properties set commission and slippage in ticks, keep the order size in contracts and use the margin setting to reflect the leverage the position carries, then compare the max drawdown with the margin you would actually post. The Library's drawdown statistics entry explains how to read that figure, and the Journal keeps the record of each contract traded.
The video below shows how a chart layout is arranged in Quant Charts, including the panels used for futures.
Where Each Tool Stops
- The exchange and clearing house set contract terms, initial and maintenance margin, daily settlement prices and delivery rules; they guarantee performance.
- The FCM carries the account, collects margin, may require more than the exchange minimum and issues variation margin calls.
- The CFTC and NFA regulate the markets and register the professionals; BASIC is where registration is checked.
- Quant Charts charts CME futures on paid plans, runs candle-based tools and Quant backtests, and keeps a journal. It does not hold margin, model exchange margin schedules or place orders.
- The Library explains open interest, sizing bases, fixed fractional sizing and drawdown statistics and provides the indicators that implement them.
Conclusion
A futures contract standardizes what, how much, when and where, so that thousands of participants can trade one instrument and a clearing house can stand between every buyer and seller. Hedgers use it to fix prices they must live with; speculators supply the other side. Margin is a performance bond of a few percent of the contract's value, settled daily, which is why gains and losses arrive every day and can exceed the deposit. The curve across expiries adds a roll cost or gain to any position held over time, and the CFTC's warnings about the suitability of speculation are worth taking literally. Quant Charts supplies the chart, the open-interest read, the sizing arithmetic and the backtest; the FCM and the clearing house decide what the account can hold.
Key Takeaways
- A futures contract fixes price and quantity now for a future date; most positions are offset before delivery, and some contracts settle in cash.
- Exchanges standardize contract size, months, last trading day, delivery points and grades; the E-mini S&P 500 is $50 times the index with a $12.50 tick.
- The clearing house is counterparty to every trade; offsetting a position extinguishes it.
- Margin is a performance bond of roughly two to ten percent of contract value, marked to market daily, with variation margin due when the balance falls below maintenance.
- Later-dated contracts above nearer ones is contango, below is backwardation; convergence at expiry turns the curve's slope into a roll cost or gain.
- Futures professionals register with the NFA; the CFTC warns that speculation is rarely suitable for individuals and losses can exceed the deposit.
- Quant Charts charts CME futures on paid plans, reads open interest, sizes by tick value and backtests rules through Quant; it does not hold margin or place orders.
FAQs
What is a futures contract?
An agreement to buy or sell a set quantity of a commodity or financial instrument at a price fixed today for a future date, traded on an exchange under standardized terms and cleared through a clearing house. Most contracts are offset before delivery; some settle in cash.
How does margin work in futures?
Margin is a performance bond, typically two to ten percent of the contract's value according to the CFTC, not a down payment. The exchange sets initial margin, positions are marked to market daily, and if the account falls below maintenance margin the trader must post variation margin. Losses can exceed the initial deposit.
What does the clearing house do?
It becomes the buyer to every seller and the seller to every buyer on the exchange, guaranteeing performance and removing counterparty risk. Because both sides face the clearing house, buying and later selling the same contract extinguishes the position.
What are contango and backwardation?
Contango is a futures curve in which later-dated contracts trade above nearer ones, common when storage and financing costs are significant. Backwardation is the reverse, often a sign of tight near-term supply. Because each contract converges to the cash price at expiry, the curve's slope becomes a roll cost or gain for positions held across months.
Who regulates futures trading in the US?
The Commodity Futures Trading Commission, created in 1974, regulates the markets, and firms and individuals who handle customer funds or give advice must register with the National Futures Association. The NFA's BASIC database lets you check registration and disciplinary history for free.
Can I chart and backtest futures in Quant Charts?
Yes. CME futures are available as candle data on the Premium, Ultimate and Ultra plans. Candle-based tools such as TPO, VWAP and the Visible Range Volume Profile run on them, the Open Interest Chart indicator tracks participation, and Quant can backtest a rule with commission, slippage and margin settings. Quant Charts does not hold margin or place orders.
References
LuxAlgo Resources
- Open Interest concept and Open Interest Chart indicator (LuxAlgo Library)
- Sizing Bases, Fixed Fractional and Drawdown Statistics (LuxAlgo Library)
- Quant Charts market data (LuxAlgo Docs)
- Making strategies with Quant, Reading a strategy backtest and Journal (LuxAlgo Docs)
External Resources
Read next