Gap Patterns: Candlestick Signal Breakdown
Gap patterns show a discontinuity in price, but their meaning depends on how the gap is defined and where it appears. A gap between the previous close and the next open can occur even when the two candles’ ranges overlap. A full-range gap requires the second candle’s low to exceed the first candle’s high, or its high to fall below the first candle’s low.
Common, breakaway, runaway and exhaustion gaps describe the surrounding market context. They help organize possible continuation and reversal scenarios; they do not reliably name the next move at the instant the market opens. Use LuxAlgo’s charting and AI platform to inspect that context on Quant Charts and develop explicit research rules with Quant, our coding agent.
Key Insights
- Breakaway gaps move beyond a defined consolidation area.
- Runaway gaps occur within an existing trend; “measuring gap” is an interpretation, not a fixed target formula.
- Exhaustion gaps become recognizable through failed continuation and subsequent reversal.
- Common gaps occur within congestion and may fill relatively quickly, but a fill is never owed.
- Volume, session settings and the precise fill rule belong in every gap study.
4 Main Types of Gaps
Common Gaps
Common or area gaps form within an established trading range. They often attract less sustained follow-through than a breakout from a major boundary. Relatively low activity may accompany them, but volume alone does not classify the pattern. A thinly traded instrument can repeatedly print gaps without offering an attractive trading opportunity.
A later retracement may close a common gap. Define whether closure means touching the previous close, reaching the far edge of a full-range gap, or closing beyond that edge. These are different events and should not share one unexplained fill statistic.
Breakaway Gaps
A breakaway gap carries price beyond a congestion boundary or chart-pattern level. Mark that boundary before the gap appears. Higher participation and sustained trading beyond the level can support a continuation hypothesis, while an immediate return into the old range challenges it. Neither high volume nor a large opening jump guarantees a new trend.
For a hypothetical EUR/USD move from 1.0713 to 1.0744, the close-to-open change is 0.0031, or 31 pips using a 0.0001 pip convention—about 0.29%. If price later reaches 1.1175, the rise from 1.0744 is about 4.01%, before costs. That later move is not the gap size or a return that every trader could capture. To classify the original gap as breakaway, the prior range and subsequent behavior must also be examined.
Runaway Gaps
Runaway or continuation gaps develop within a trend already in progress. Traders watch whether the gap holds and the sequence of higher highs or lower lows continues. Calling one a measuring gap reflects the idea that it may occur near the middle of a move; it does not establish how much trend remains.
A late trend gap can initially resemble a runaway gap and later prove to be exhaustion. Any strategy that needs to distinguish them must specify what can be known at the entry time.
Exhaustion Gaps
Exhaustion gaps occur near the end of an advance or decline and are followed by weakening continuation or reversal. They may involve a large jump and unusually high, climactic activity. Declining volume is not a defining requirement: the important question is whether price sustains the move after the gap.
There is no universal 72% reversal accuracy attached to the name. Such a percentage would require a documented market, sample, pattern definition, confirmation rule and outcome horizon. Treat exhaustion as a contextual hypothesis until the specified reversal evidence appears.
| Gap type | Location | Evidence to examine | Main trap |
|---|---|---|---|
| Common | Inside congestion. | Limited follow-through and subsequent retracement. | Assuming every gap must fill promptly. |
| Breakaway | Beyond a prior range boundary. | Acceptance outside the range and comparable volume. | Drawing the boundary after seeing the breakout. |
| Runaway | Within an established trend. | Continued movement under a stated trend rule. | Assuming the gap is exactly halfway through the move. |
| Exhaustion | Late in a move. | Failure to continue and later reversal evidence. | Using hindsight to identify exhaustion at the open. |
The StockCharts guide to gaps and gap analysis provides the conventional classification and examples. The categories describe price context; they are not interchangeable with indicator labels such as Opening Gap or Fair Value Gap.
Gap-Related Candlestick Signals
Bullish Gap Patterns
An upward breakaway gap can accompany a move above resistance, while an upward runaway gap develops during an existing advance. A later strong close may provide additional confirmation under a defined rule. A bearish reversal after an upward gap is also possible, particularly if price returns below the breakout level.
A bullish engulfing candle describes the relationship between candle bodies. It does not by itself establish a full-range gap, whose definition includes the wicks. Keep the candle formation, gap measurement and trend context as separate observations.
Bearish Gap Patterns
A downward breakaway gap can move beneath support, and a downward runaway gap can extend a decline. A downward exhaustion gap may precede a rally once selling fails to continue. Therefore, “gap down” describes price direction, not a standing instruction to short.
For either direction, record the pre-gap level, the completed signal candle and the later confirmation event. If the entry depends on a close, do not enter the historical test at an earlier intrabar price. A later confirmation may avoid some failed setups while worsening entry distance or missing others.
Gap Trading Methods
Gap Fill Analysis
Gap-fill trading anticipates a retracement toward a pre-gap reference. Trend-following gap trading instead anticipates continuation away from it. Choose the scenario and its invalidation before entry rather than changing the explanation after price moves.
| Method | Example condition to define | Invalidation or limitation |
|---|---|---|
| Fill attempt | A completed candle re-enters the gap and a later trigger aims for the prior close. | Price may resume the gap direction before filling. |
| Breakaway continuation | A gap beyond a previously marked range followed by a defined hold or breakout. | Returning into the old range may invalidate the setup. |
| Retest entry | Price revisits a specified edge and forms the required response. | The retest may never occur, or the edge may fail. |
| Exhaustion reversal | A late-move gap loses follow-through and breaks a defined reversal level. | The exhaustion label is not available before its confirming evidence. |
Set a time horizon for fills—such as the same session or the next five sessions—and report partial and complete retracements separately. Include gaps still open at the end of the sample rather than quietly dropping them. A high fill percentage does not prove a profitable strategy once stop distance, timing and costs are included.
Using Technical Indicators
The 20-day and 50-day EMAs can supply an explicit trend condition, such as price above both on the preceding completed day. RSI can describe momentum, while volume can be compared with a prior-session baseline. These settings are research choices; adding more agreeing indicators does not automatically increase accuracy.
For intraday work, the opening period often has different volume from midday. Compare equivalent times or clearly state the alternative baseline. Keep the venue consistent: Quant Charts data coverage explains that U.S. equity volume is from Cboe EDGX rather than the consolidated market. A different feed can produce different volume comparisons and chart extremes.
Managing Risk in Gap Trading
Choose a stop from the trade premise, not from a fixed label. A continuation trade may invalidate beyond the gap’s far edge or a structural swing; a fill attempt may invalidate beyond the post-gap extreme. The midpoint is a reference level, not a universally suitable stop.
Position size equals the risk budget divided by planned loss per unit, rounded down for the instrument’s trading increments. For a hypothetical long at $52 with a $49.50 stop, risk is $2.50 per share. A $125 budget allows 50 shares before costs. A $57 target offers $5 per share, or 2R. A stop filled at $48 instead would lose $200 on those shares before fees, illustrating why planned risk is not a guaranteed loss cap.
Before earnings or major announcements, decide whether to hold, reduce or close exposure according to the strategy. Spreads, trading halts, liquidity, short-borrow costs and overnight repricing can affect execution. A smaller position helps control exposure but cannot remove these risks.
Tools and Examples for Gap Trading
Gap Trading Case Studies
Consider an illustrative Apple-style sequence: a bullish engulfing candle appears, then price gaps higher. Check the actual candle ranges before classifying the gap. If momentum later stalls and price reverses, an exhaustion interpretation becomes possible; if a subsequent gap supports a renewed trend, evaluate that as a new setup. These labels describe separate stages, not evidence that one candle predicts the entire sequence.
In an illustrative UBER-style response to competitive news, price gaps down toward a premarket reference. One plan waits for a bounce and a defined failure before considering a short, rather than selling automatically into the first support area. The bounce could instead develop into a full recovery. This is an execution scenario, not a verified account of a specific historical trade.
Using LuxAlgo Tools for Gap Analysis
Start with the gap definition. The LuxAlgo Imbalance Detector separates Opening Gaps, Fair Value Gaps and Volume Imbalances. Its opening-gap condition compares adjacent candle extremes, while an FVG compares the current extreme with the extreme two bars earlier. Neither label automatically identifies a common, breakaway, runaway or exhaustion context.
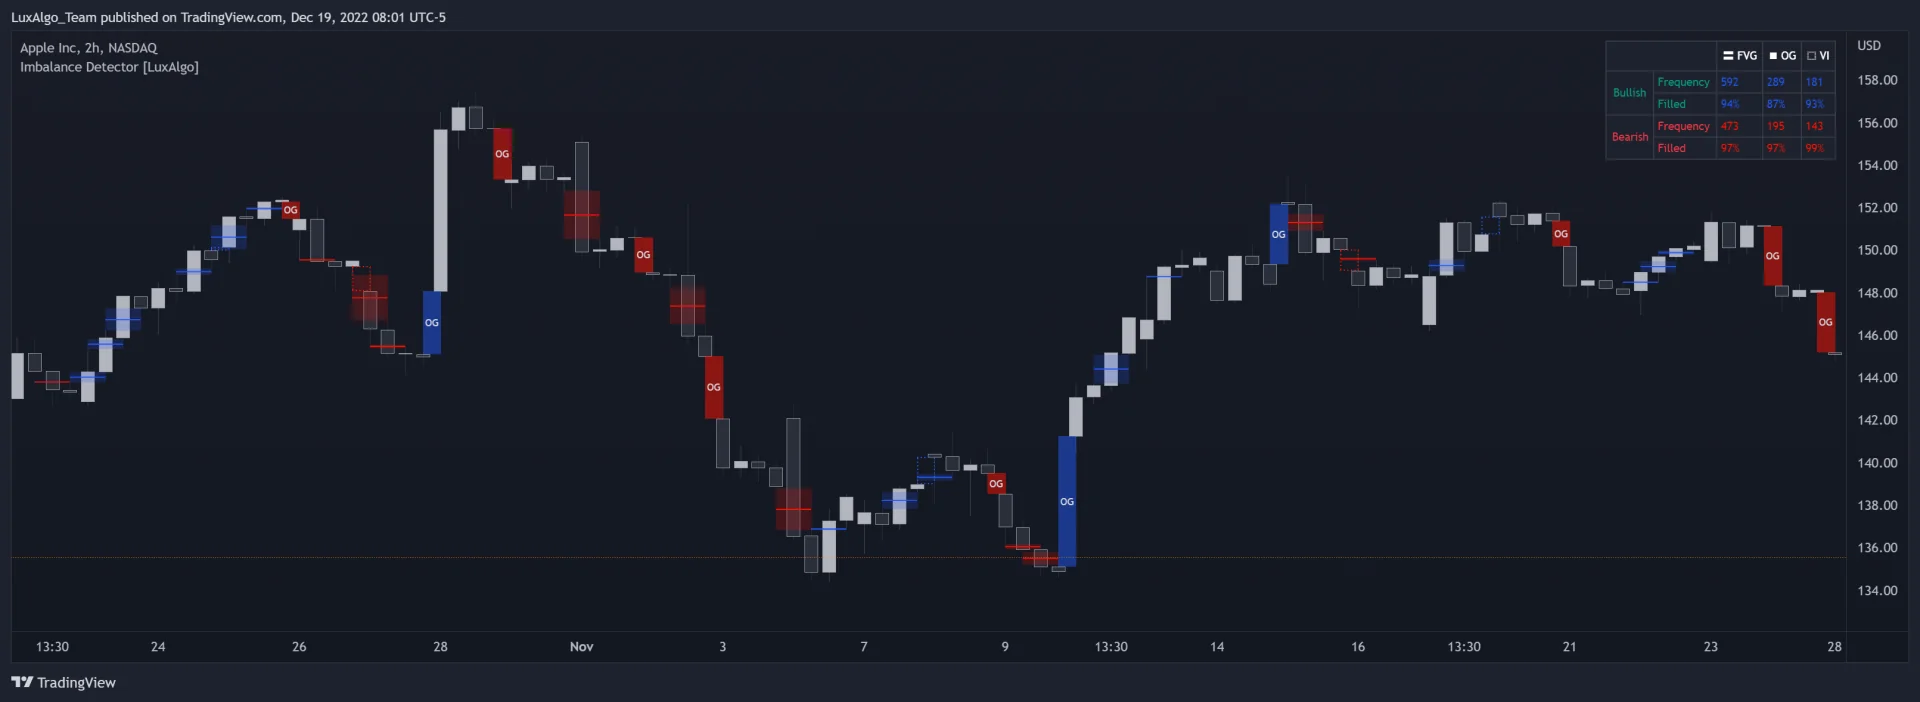
The Library provides an Open on Quant Charts workflow. The original LuxAlgo publication documents minimum-width filters, zone extension, alerts and a dashboard of occurrence and fill statistics. Those statistics are not trade win rates. Check the selected implementation and settings rather than assuming every platform presents identical controls.
FVG detection uses a three-candle relationship; it does not prove that no trading occurred inside the middle candle or identify the participants responsible. A tool’s volatility threshold and mitigation method affect which zones remain visible: Close, Wick and Average mitigation rules differ, while None keeps mitigated areas.
These tools can reduce manual marking, but detecting a zone is not the same as finding a high-probability trade. Combine the selected gap rule with separately defined trend, entry and risk conditions.
Researching Gap Patterns with Quant
Use Quant Charts to compare the gap with a broader view while preserving the same symbol, venue and session. The supplied layout demonstration illustrates organizing multiple chart views; the views should answer a specific question rather than add unrelated indicators.
Ask Quant, our coding agent, for a study with auditable measurements:
For the selected symbol and regular-session daily candles, calculate each opening change from the prior close in percent. Separately flag full-range gaps using adjacent highs and lows. Report direction, size, whether the prior close is touched within five sessions, and whether the far edge of a full-range gap is touched within five sessions. Keep the two fill definitions separate and do not infer trade fills or gap categories from future prices.
Inspect the generated code and run it manually, following Making Strategies with Quant. Verify selected examples and unfinished observation windows. If adding a breakaway filter, define the prior range from bars available before the signal. If adding exhaustion confirmation, record when that evidence first becomes available.
A strategy requires additional entry, stop, target, sizing, overlap, slippage and cost rules. Evaluate unseen data and neighboring settings. When one bar touches both stop and target, use appropriate intrabar evidence or a stated conservative convention rather than assuming a profitable order sequence.
Market-Specific Gap Strategies
| Market | Context to examine | Practical caution |
|---|---|---|
| Stocks | Earnings, corporate actions, regular and extended sessions. | There is no universal 1–5% average gap size; thin stocks can have difficult fills. |
| Forex | Weekend reopening, broker feed and major announcements. | Do not assume a universal 0.3–1% gap range or centralized exchange volume. |
| Futures | Session breaks, contract rolls and exchange conditions. | A roll adjustment or session convention can create a chart discontinuity. |
| Crypto | Venue, continuous trading and data quality. | A gap on one venue or futures session does not establish a gap across all markets. |
Small-cap stocks may show large jumps, but large movement does not make them the best opportunity. Liquidity and execution can dominate the outcome. Compare like-for-like instruments and session definitions before drawing conclusions from gap frequencies.
Conclusion
Gap Pattern Overview
Gap size and direction are measurable; common, breakaway, runaway and exhaustion classifications also require context. Volume can inform that context, but neither a spike nor a quiet session guarantees the next move. A gap-fill rate describes an event under a definition, not a trading edge by itself.
Guidelines for Trading Gaps
- Record the gap definition, session, prior levels and confirmation time.
- Choose a continuation or fill hypothesis with explicit invalidation.
- Size from the actual entry and stop, allowing for execution costs and slippage.
- Review failed, unfilled and missed setups as well as favorable examples.
- Use LuxAlgo tools to make the process repeatable, then test assumptions before risking capital.
How to Trade the Three Gaps Pattern
Frequently Asked Questions
What are the four main gap types?
Common, breakaway, runaway and exhaustion. They describe the gap’s relationship to congestion and trend, rather than four different opening-price formulas.
Does every gap eventually fill?
No fill or deadline is guaranteed. Define the reference price and observation horizon, and include gaps still open at the end of the sample.
Is an opening-price gap the same as a full-range gap?
No. The open may differ from the prior close while the candles’ ranges overlap. A full-range gap requires separation of adjacent highs and lows.
Can exhaustion be identified immediately at the open?
A gap late in a trend is only a candidate. The exhaustion interpretation requires subsequent failure to continue or reversal evidence under a stated rule.
Do indicator fill statistics measure profitable trades?
No. They count fills under the indicator’s definitions. A trading result also depends on entry, stop, target, sizing and execution costs.
How can Quant help analyze gaps?
Specify the gap and fill definitions, session and observation horizon. Inspect the generated code and run it manually before adding strategy execution and risk assumptions.
References
LuxAlgo Resources
- LuxAlgo Quant
- Making Strategies with Quant
- Quant Charts Data and Market Coverage
- Imbalance Detector
- Imbalance Detector: Original LuxAlgo Publication
External Resources
Read next