Guide to Using LuxAlgo for Liquidity Zones
Liquidity-zone analysis starts by identifying what the chart actually measures. A zone inferred from repeated highs or lows is a hypothesis about where orders may concentrate. Executed volume shows activity that already occurred. Neither one is a complete view of resting orders, hidden liquidity or traders’ intentions.
LuxAlgo provides different tools for these jobs. Begin on a Quant Chart with chart context and Orderflow data, then define a testable rule. If you add the Library’s liquidity tools, follow each tool’s specific settings and confirmation timing. Combining tools can add context, but does not automatically make a zone reliable or a trade profitable.
Distinguish Liquidity Estimates from Executed Activity
In trading discussions, “liquidity zone” can refer to several different observations: a cluster of similar swing highs, a price region with heavy historical trading, or displayed orders in an order book. These should not be treated as interchangeable. A level associated with past activity can break, and a suspected concentration of stops is not a verified count of orders.
| Observation | What it supports | What it cannot prove |
|---|---|---|
| Similar swing highs or lows | A chart reference for a possible sweep, rejection or breakout | The number, size or owner of orders waiting there |
| Historical volume at price | Where executed activity was concentrated over the selected sample | That comparable resting liquidity remains available now |
| Aggressor-side footprint volume | Where buying or selling executed within the available data | The full order book, hidden orders or participant identity |
| Library order-block zone | A rule-based price area with associated historical metrics | That institutions currently hold unfilled orders in the zone |
Price is sometimes described as being drawn toward liquidity, but “magnet” language is not a rule that requires a revisit. Make the expected interaction explicit and define what would disprove it. A missed target or a level that never gets revisited is part of the evidence, not an exception to remove from the sample.
Start with LuxAlgo’s Native Charts
Choose the instrument, provider, timeframe and session before marking levels. Check data coverage for the fields your method requires. Volume from one venue or feed is not necessarily market-wide volume, and an unsupported order-flow field should not be replaced with an assumed zero.
Use one view to establish context and another to examine the proposed interaction. For example, an hourly reference and a 15-minute entry rule can be a research design. They are not universal best settings. Record when each level became available, especially if it depends on a completed higher-timeframe candle or a confirmed swing.
Read Footprints as Traded Volume
On a supported symbol, native Footprint charts show volume at price split by aggressor side. The documented data consists of pre-aggregated one-minute buy/sell volume-at-price slices, re-bucketed to the chart timeframe. It describes executed activity, not a live depth-of-market book or a raw tick-by-tick order history.
Switch the chart style to Footprint and use its Chart settings tab, or add a Footprint overlay through Indicators → Orderflow to retain the candle view. Start with a readable Bid × Ask display and note the row-size setting. Automatic row merging as you zoom changes the displayed aggregation, and the documentation says imbalance flags are recomputed on the merged rows.
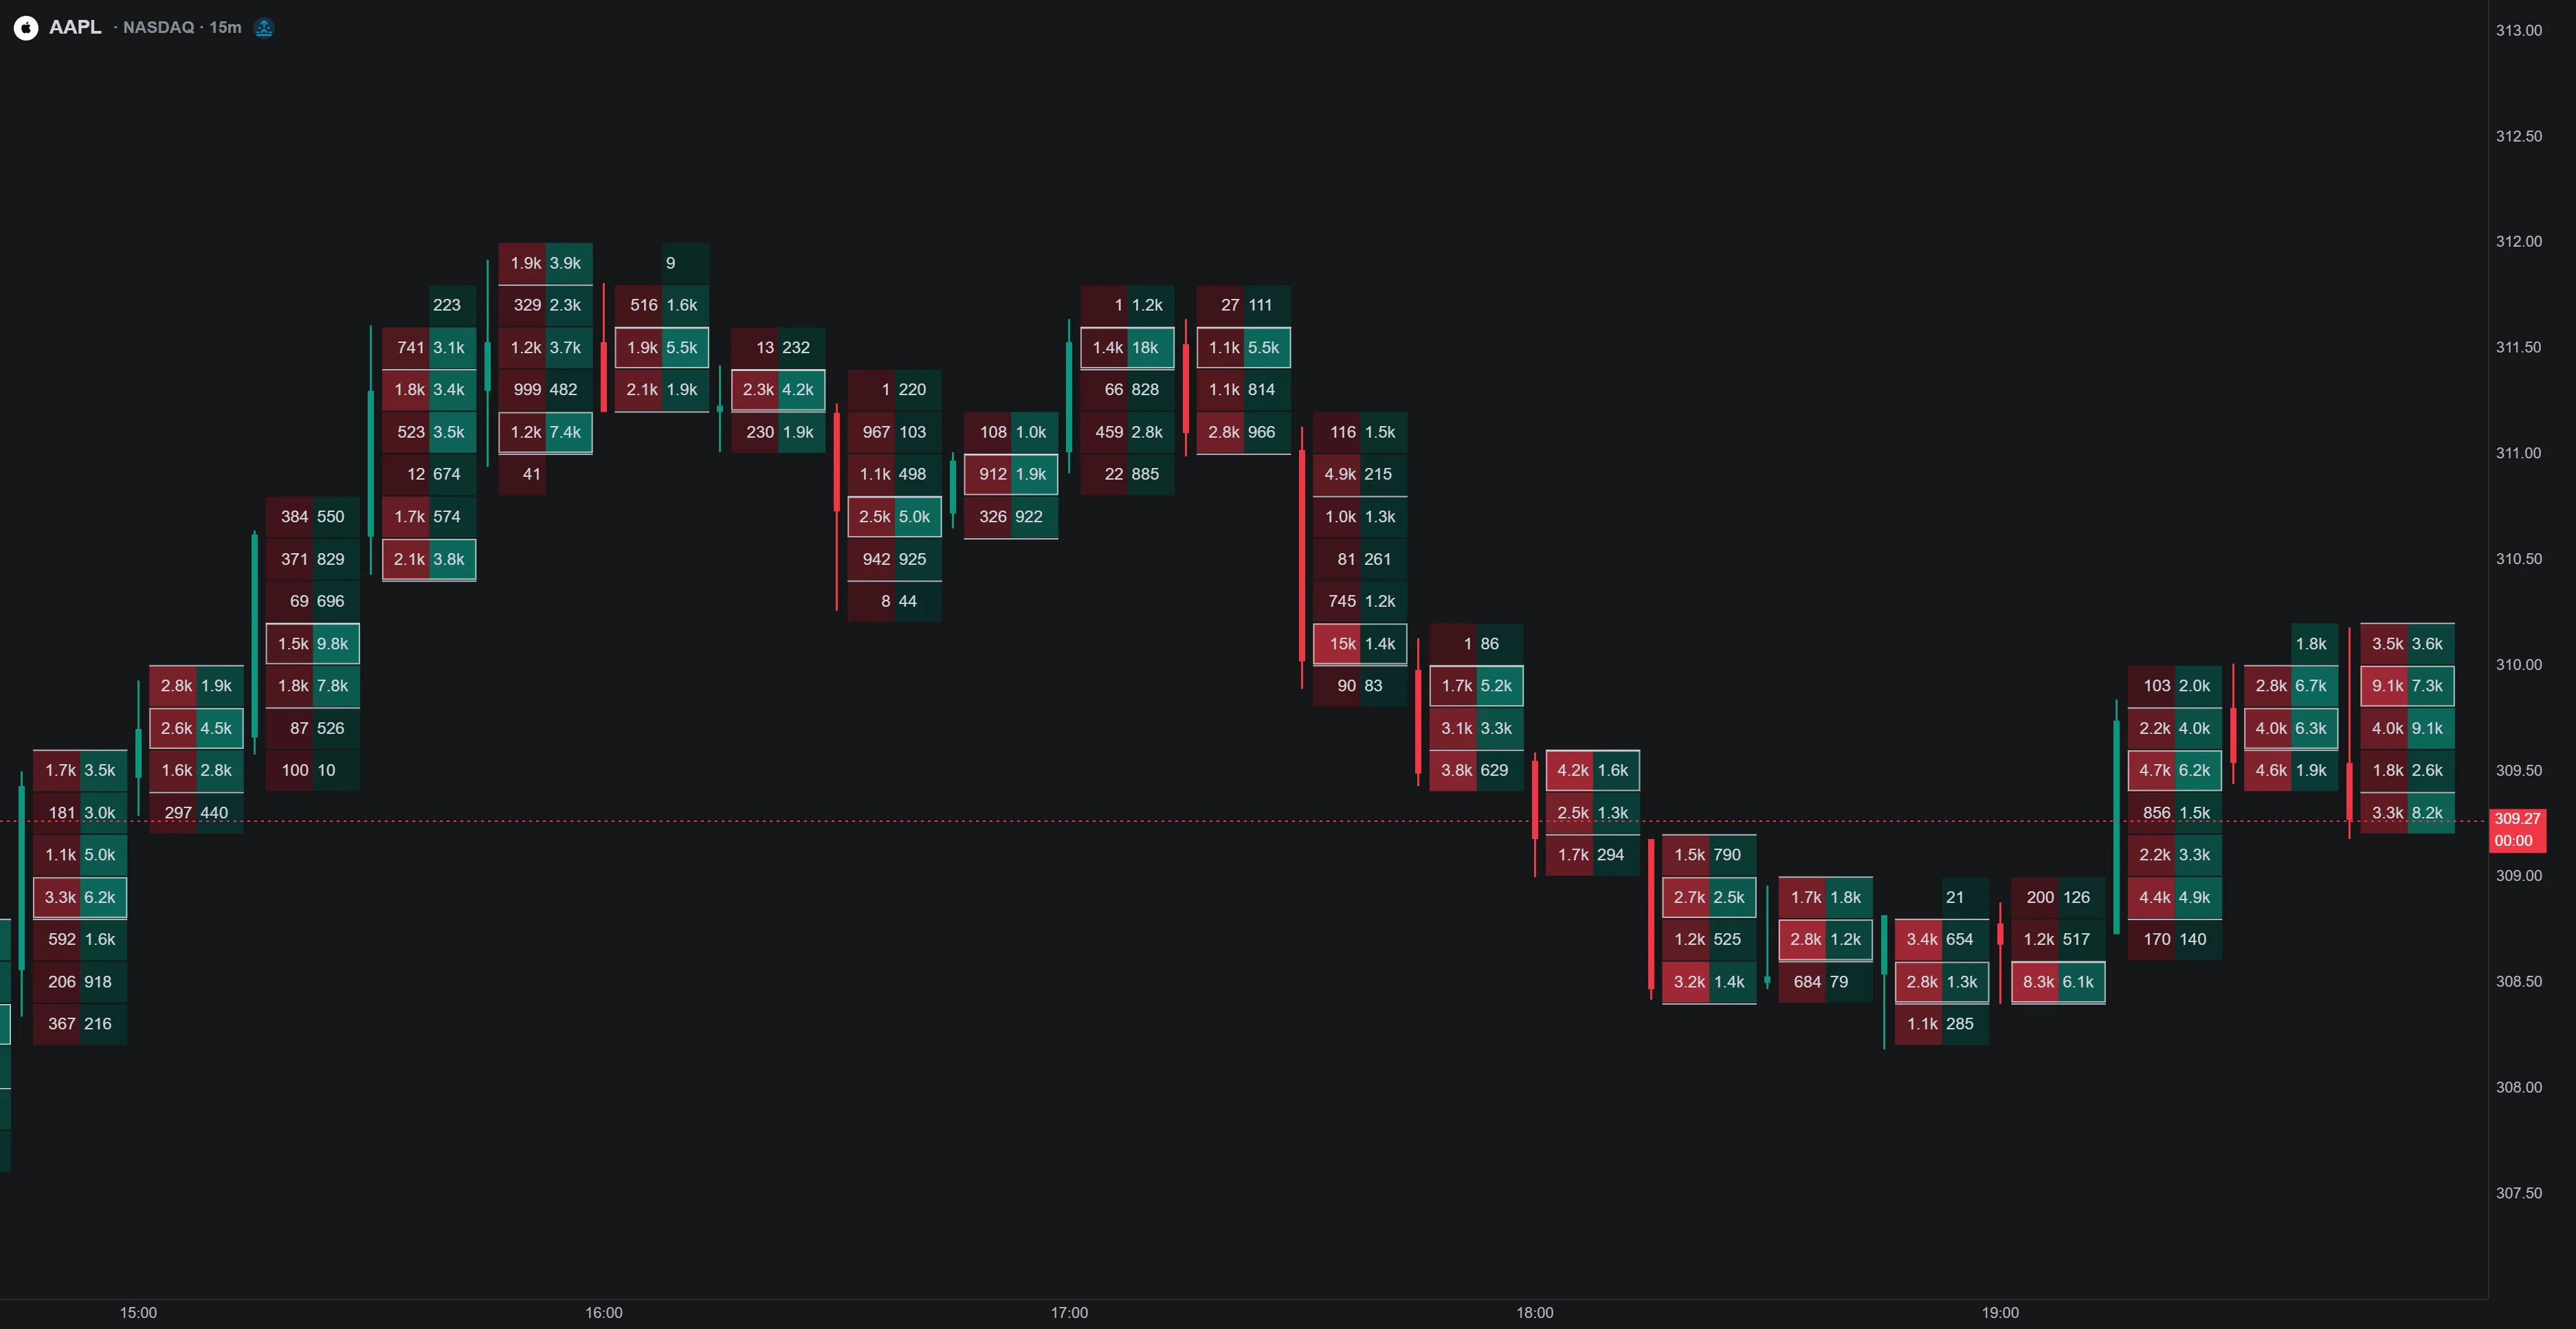
An imbalance compares activity across diagonal price levels under a defined ratio threshold. A large positive delta can coexist with falling price, and a burst of volume can accompany either a failed move or a successful breakout. Combine the observed response with the prewritten rule instead of turning “high volume” into an unconditional entry instruction.
Keep the session and aggregation fixed during a comparison. A visible-range profile changes its sample when the visible window changes; a chart that looks different after zooming is not necessarily showing a change in the underlying market. Save the settings and date range used for research.
Use the Library’s Liquidity Tools on a Quant Chart
The Library covers the same ground with separate liquidity tools: Trendline Liquidity, EQH/EQL Liquidity Zones and Liquidity Sweeps. Use each tool’s named controls rather than a generic “medium sensitivity” recommendation.
| Library tool | Documented behavior | Research implication |
|---|---|---|
| Trendline Liquidity | Qualifies a sloped line only at its minimum touch count, then shades the band beyond it | Do not assume the line was visible at every earlier point it covers |
| EQH/EQL Liquidity Zones | Uses confirmed pivots; confirmation takes the configured Pivot Left/Right Length in bars | A historical swing location is earlier than the time it became usable |
| Liquidity Sweeps | Marks a wick through a level, or a break that fails on its retest, and boxes the Sweep Area | A marked sweep is a candidate event, not a guaranteed reversal |
EQH/EQL Liquidity Zones confirms a pivot only after its Pivot Left/Right Length has elapsed and merges equal levels under its Equality Threshold. A swing marked several bars back must not be used as if it was already confirmed at its original candle. Apply the same principle to Trendline Liquidity, whose lines qualify retrospectively.
Liquidity Sweeps draws a wick-only sweep with a dotted line and a break-and-retest sweep with a dashed line. Save the precise condition and candle timing; an intrabar observation can differ from the completed candle.
Interpret Order Block Volume Carefully
The Library’s Order Block Detector anchors each block to a confirmed volume pivot, so Volume Pivot Length sets the detection lookback. Mitigation can use Wick or Close, so a block disappearing under one configuration may remain under another.
A block anchored to a volume peak records where executed volume concentrated; it is not the probability of a winning trade. Detection requires volume data. Color, opacity or a larger number alone cannot identify a particular institution or establish how many unfilled orders remain.
When a block comes from a higher timeframe, its placement on a lower-timeframe chart can differ from the source chart, potentially making a mitigated block appear unmitigated. Check the source chart and when the information was available rather than assuming perfect synchronization.
Define a Zone Interaction Before Planning a Trade
Separate a rejection hypothesis from a continuation hypothesis. For a possible rejection, define the excursion beyond a known level, the required return inside it and when entry becomes eligible. For continuation, define the close beyond the zone, any retest requirement and the failure condition. Do not switch between these interpretations after seeing which one won.
A hypothetical long rejection plan might use a previously confirmed low at 100, a dip to 99.50 and a completed return above 100. If a later entry fills at 100.20, a planned stop at 99.40 implies 0.80 of price risk per unit. A target at 101.80 offers 1.60 per unit, or 2:1 before costs. Those numbers illustrate a specified rule, not a recommendation or a promise that the stop will fill at its trigger.
With a planned risk allowance of 160 in the quote currency and a linear instrument worth one currency unit per price unit, 160 ÷ 0.80 gives 200 units before costs. Contract multipliers, currency conversion, minimum size, fees and slippage can change the calculation. A wider stop requires reconsidering size; it does not authorize a larger total risk by itself.
An opposing zone can be a candidate target only if it existed when the trade was planned. If you scale out, specify the fraction and price for each exit and evaluate the weighted payoff. Taking half at 1R and half at 2R yields 1.5R gross if both targets fill, not 2R. Include cases where the second portion loses or never reaches its target.
Use Additional Tools to Answer a Specific Question
Volume context, a momentum measure or a divergence can help describe a setup, but several indicators built from the same candles may repeat the same information. An oscillator divergence is not a direct measure of liquidity, and a money-flow calculation is not a full view of actual orders. Avoid referring to unrelated tools as interchangeable “Volume Flow” confirmation.
For each proposed filter, compare the same baseline with and without it. Record whether it reduces losing trades, removes winners, changes exposure or mainly cuts the sample size. “More confirmation” is useful only if the defined test supports the intended improvement after costs.
Across timeframes, assign a separate purpose to each view and respect completed-bar timing. A daily zone, a four-hour structure check and a shorter entry interval are one possible design, not evidence that false signals have been eliminated. Do not use the final daily range to justify a morning decision that could not yet know it.
Test the Rules with Quant
Ask Quant, our coding agent to express a supported version of the zone definition, event timing, entries, exits and risk rules. Inspect the generated code and run it manually. Label a custom approximation as such; the Library publishes each tool’s Pine Script® source, so Quant can start from the real logic.
Review strategy settings and individual trades to check confirmation delays, costs and ambiguous candles where both stop and target are touched. If the available engine or data cannot express the intended footprint or liquidity condition, record that limitation instead of implying that every visual feature can be backtested directly.
Keep development and later evaluation periods separate, record the variants tried, and review net results, drawdown, average outcomes and trade count. Test nearby settings and different market conditions without repeatedly redesigning the strategy around the evaluation sample. Historical testing reduces some uncertainty but does not certify readiness or guarantee future results.
Indicators, research results and alerts remain distinct from actual execution. A broker order needs its own confirmed handling and fills.
Frequently Asked Questions
Does a liquidity zone show actual waiting orders?
Not necessarily. A chart-derived zone is an inference, and historical volume shows completed activity. Neither provides a complete view of resting orders, hidden liquidity or participant identity.
Are equal highs and lows available immediately?
No. The documented feature uses confirmed swing points and waits the configured number of bars, so its historical placement is earlier than its availability for a decision.
Do native footprint charts show an order book?
No. They show executed volume at price split by aggressor side, built from pre-aggregated one-minute slices on supported symbols. They are not a live depth-of-market book.
What settings should I use for liquidity analysis?
Choose the specific feature, timeframe, session and signal-availability rules your hypothesis requires. There is no universal medium sensitivity or best timeframe; record and evaluate the chosen settings.
Can Quant backtest every visual liquidity feature exactly?
Do not assume that. Ask for supported rules, inspect the code and run it manually. Label approximations and verify data and execution limitations before interpreting the results.
Read next