Heikin Ashi Candles: Smooth Trend Detection
Heikin Ashi candles smooth price action by combining current OHLC data with values from the previous Heikin Ashi bar. Runs of similar candles can make a trend easier to follow, while shrinking bodies and opposing shadows can highlight a loss of momentum. The trade-off is lag and a transformed price series: the displayed open and close are not the market’s actual opening and closing prices.
Use LuxAlgo’s charting and AI platform to study both views. Quant Charts supports Heikin Ashi as a chart style, while Quant, our coding agent, can help turn your candle-reading rules into a strategy for review and testing. Keep the signal calculation separate from the real prices used to model entries, stops and exits.
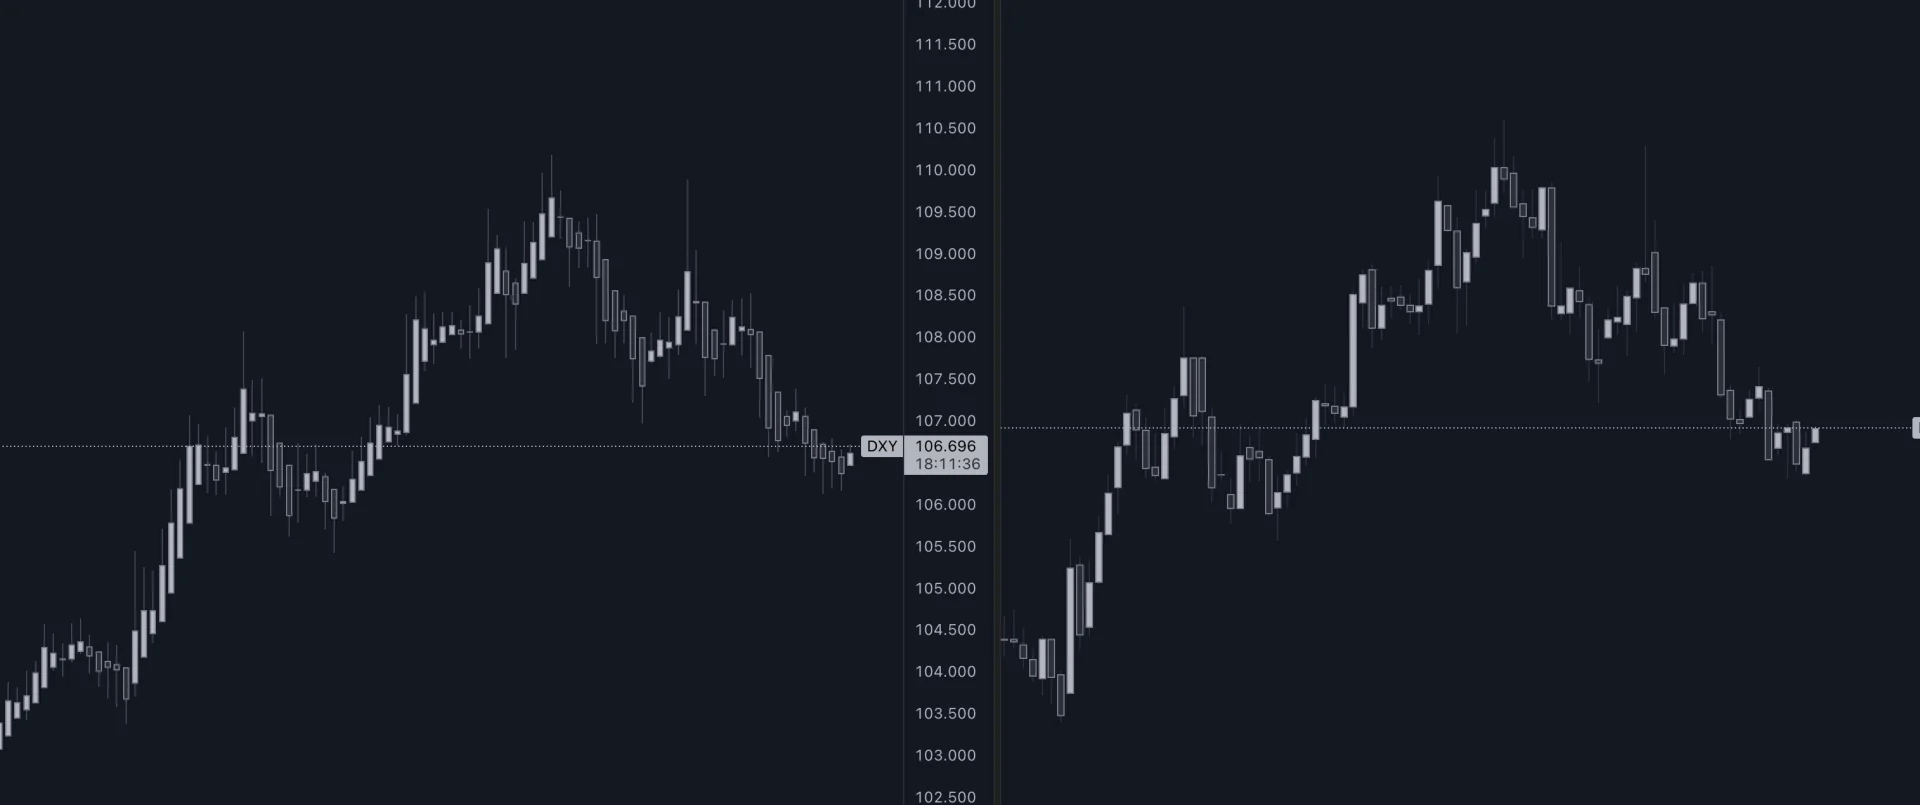
Heikin Ashi vs. Traditional Candlesticks
Traditional candlesticks show the open, high, low and close for each period in the selected data feed. Heikin Ashi retains the time intervals but transforms the values. Its close averages the current bar, and its open depends on the previous synthetic candle.
- Trend reading: Heikin Ashi often produces longer runs of one color, helping a trader stay focused on direction.
- Price detail: standard candles preserve actual OHLC levels and gaps. Heikin Ashi can obscure them and can extend a plotted high or low beyond the current real bar’s range.
- Timing: both charts can update while a bar forms, but the averaging in Heikin Ashi can delay a color change relative to raw price action.
- Execution: use actual market prices and the broker’s quotes. A smoother candle is not a price at which an order is guaranteed to fill.
Neither view is universally easier or more accurate. Heikin Ashi can simplify a trend-following decision, but it does not remove false signals in a range or turn volatility into lower financial risk.
Core Mechanics of Heikin Ashi
Price Calculation Method
Let O, H, L and C denote the current regular candle’s open, high, low and close. HA denotes the transformed series.
| Component | Calculation |
|---|---|
| HA close | (O + H + L + C) ÷ 4 |
| HA open | (Previous HA open + previous HA close) ÷ 2 |
| HA high | Maximum of H, current HA open and current HA close |
| HA low | Minimum of L, current HA open and current HA close |
| First-bar seed | A common starting HA open is (first O + first C) ÷ 2 |
The LuxAlgo Heikin Ashi guide describes this construction. Because the open is recursive, the starting seed and available history can affect early values. Use the same session, timeframe and history when comparing platforms.
For example, suppose a real bar has O = 100, H = 106, L = 99 and C = 105, while the previous HA open and close were 98 and 100. The new HA close is 102.50, the HA open is 99, the high is 106 and the low is 99. It is a bullish candle with no lower shadow, although the actual market closed at 105 rather than 102.50.
If the next real bar is O = 105, H = 107, L = 104 and C = 106, its HA close is 105.50 and HA open is 100.75. Its HA low becomes 100.75, below the real bar’s 104 low. That synthetic extension illustrates why a plotted HA level should not be treated as a traded price.
Reading Trend Signals
Color indicates the relationship between HA close and HA open, using the colors chosen in your chart settings. It does not directly compare the current actual close with the previous actual close.
| Visual pattern | Common interpretation | What to check |
|---|---|---|
| Bullish bodies with no lower shadows | Persistent upward movement in the smoothed series | Actual-price resistance, extension and the next confirmed bar |
| Bearish bodies with no upper shadows | Persistent downward movement in the smoothed series | Actual-price support and the risk of a sharp rebound |
| Smaller bodies with shadows on both sides | Reduced directional persistence or consolidation | Whether price is inside a range rather than beginning a reversal |
| A change of body color | A change in the relationship of the averaged open and close | Whether the bar is closed and the strategy requires further confirmation |
Large bodies can accompany a sustained move. Smaller bodies and longer opposing shadows can warn that its character is changing, but neither pattern establishes a reversal by itself. A flat bottom on a bullish HA candle usually supports the strong-trend interpretation; a flat top on a bearish candle is its mirror. Those shapes are not standalone reversal signals merely because they occur near a level.
Spotting Market Shifts
Watch for a transition from one-color runs into smaller, mixed candles. This can help identify a period to reassess exposure. It does not predict when a consolidation will break or which direction it will take. Define the range using regular prices, then wait for the breakout or reversal conditions your strategy actually requires.
The current candle can change color or grow a shadow before it closes. If your rule is based on closed candles, do not act on an unfinished bar and later backtest it as though its final appearance had been known.
For a visual walkthrough, see the Heikin Ashi candlesticks tutorial on YouTube. Read its examples alongside the formulas and actual-price execution checks in this guide.
Key Benefits and Limitations for Traders
Noise Reduction Features
Heikin Ashi can reduce the visual impact of small countertrend movements. A trader using a consistent trend rule may find it easier to hold through minor fluctuations rather than responding to every change in ordinary candle color.
The smoothing does not eliminate whipsaws. In a sideways market, colors can alternate without useful follow-through. In a fast reversal, a smooth-looking run can persist after actual price has already moved against the position. Treat visual simplicity as a way to organize decisions, not evidence that the strategy is more profitable.
Use Each Chart for a Specific Decision
A practical pairing gives Heikin Ashi the job of describing trend persistence and standard candles the job of showing actual prices, gaps, swings and execution levels. Keep the symbol, venue, session and timeframe aligned. A difference caused by extended-hours data or a different exchange can otherwise be mistaken for an effect of smoothing.
When reviewing a losing trade, ask whether the rule failed, the order was filled differently from the model, or the signal appeared only after the bar closed. Those questions are more useful than judging a chart by how clean its winning trends look.
Trading Strategy Implementation
Trade Entry and Exit Rules
A basic trend-following model might enter long after a completed bullish HA candle with no lower shadow and exit after the first completed bearish HA candle. A short model reverses those rules. Small bodies with shadows on both sides can act as a no-entry filter. These are examples to test, not established optimal settings.
Make the rules reproducible: require one qualifying candle or two, specify whether re-entry is allowed after a stop, and state when orders are submitted. A strategy that waits for the close cannot assume it entered earlier at the same bar’s synthetic open. The first opposite-color exit can also arrive late, so define an independent protective stop.
Integrated Analysis with Moving Averages
Moving averages provide another view of trend direction. Specify their input: an EMA of regular closes and an EMA of HA closes are different series. Applying two smoothing methods can add delay rather than two independent confirmations.
| Moving average setup | Possible role | Implementation detail |
|---|---|---|
| 9- and 21-period EMA | Shorter-term direction or crossover filter | Choose actual closes or HA closes explicitly; shorter settings can whipsaw |
| 50-period SMA | Intermediate trend context | Specify slope, price relationship or a crossover rather than simply saying confirmation |
| 100-period SMA | Optional directional filter | Treat it as a strategy choice, not a substitute for a stop or position sizing |
| 200-period SMA | Longer-term context | Two hundred intraday bars do not represent the same horizon as two hundred daily bars |
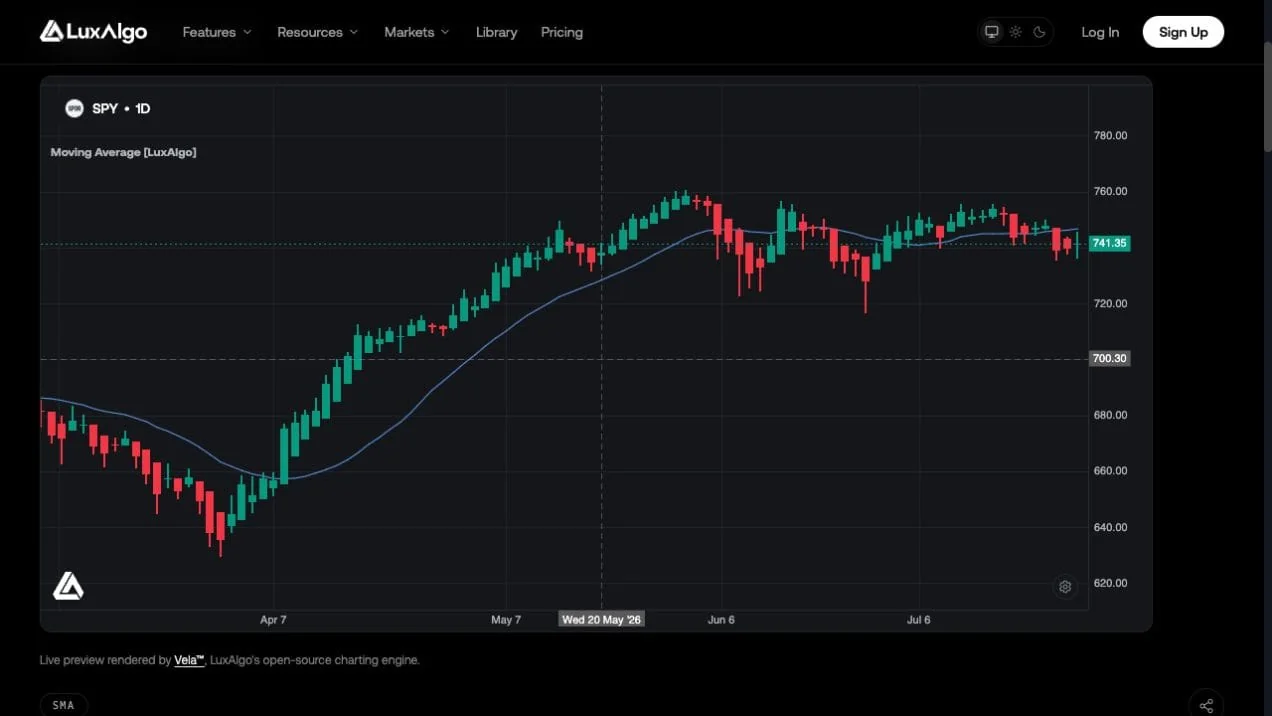
The LuxAlgo Moving Average indicator supports selectable average types, lengths and sources, with an optional second average. It can help make comparisons consistent. The numbers above are familiar starting points, not proof of which settings work best on your instrument.
Volume can show whether participation expanded during a move, but high volume alone does not confirm that it will continue. Check what the feed measures: exchange volume, venue-specific volume and forex tick volume are not interchangeable.
Support and resistance should be marked against actual price swings and relevant higher-timeframe levels. Compare the available distance to an obstacle with the planned stop distance. A bullish HA run directly under resistance does not remove that obstacle.
Risk Management Guidelines
Place the initial stop according to a defined invalidation, such as beyond a confirmed regular-price swing. If volatility makes that stop wider, reduce position size rather than moving the stop closer merely to keep the same number of shares. Account for spreads, fees, gaps and slippage.
For a hypothetical $20,000 account with a 0.5% risk budget, planned risk is $100. An actual-price entry at $105 and stop at $101 creates $4 of risk per share, allowing 25 shares before costs. A target at $113 offers $8 per share, or 2R. If a gap produces a fill at $99, the 25-share loss is $150 before costs.
Using the earlier example’s HA close of $102.50 as though it were the $105 executable entry would understate risk and inflate the apparent payoff. The same principle applies to HA highs and lows used as stop or limit prices.
Consider reducing exposure when conditions exceed those represented in the test. Record a maximum number of concurrent positions, a rule for correlated exposures and what happens after the protective stop triggers. A trend filter does not control the dollar loss by itself.
LuxAlgo Integration Guide
Read Heikin Ashi on Quant Charts
Open Quant Charts and choose Heikin Ashi from the chart-style control. The chart overview documentation covers chart types, symbol and interval controls, and layouts. Where your plan supports multiple charts, compare a Heikin Ashi view with regular candles on the same market and interval. On a single chart, switch styles while keeping the instrument and timeframe fixed.
In a multi-chart workspace, actions apply to the active cell. Confirm which chart is selected before adding a moving average or a script. Symbol, interval and crosshair synchronization can help align comparisons, but verify both cells’ settings rather than assuming everything is linked.
LuxAlgo Tools Overview
The Library’s market-structure tools and its momentum and money-flow tools open on a Quant Chart. They are not the native Heikin Ashi chart-style control.
If you combine a toolkit with an HA chart, verify its data source and documented behavior. Synthetic highs and lows can alter a structure-based interpretation. Momentum or money-flow readings add another analytical view, but a divergence is not a guaranteed reversal and a developing signal may change before confirmation.
The Multi-Chart Widget is another distinct option. Its mini charts support different symbols, intervals and styles, including Heikin Ashi. That indicator is not the same feature as Quant Charts’ workspace layouts. Choose the implementation and platform appropriate to the comparison you want to make.
Test Explicit Rules with Quant
Ask Quant, our coding agent, to help write the signal and risk logic. For example: calculate HA values from regular OHLC, enter after two completed bullish HA candles with no lower shadow when the actual close is above its 50-period SMA, and exit on a completed bearish HA candle or the protective stop. Specify the swing definition, size, costs and next-bar execution assumptions too.
Follow Making Strategies with Quant: inspect the generated code, then click Run yourself. Confirm that synthetic data drives only the intended signals and that simulated fills use regular prices. Changing the chart style alone is not proof that the backtest uses the correct execution series.
TradingView’s non-standard chart data documentation explains why HA prices cannot be assumed executable. Its strategy documentation also describes a standard-OHLC fill option for HA-chart tests; that is a TradingView setting, not a promise about every other backtest engine.
Inspect individual trades, including bars that cross a stop and a target, before relying on summary results. Use realistic commission and slippage, avoid future information in higher-timeframe requests, and test an untouched period. Quant can help revise the logic, but generated code and a profitable historical simulation do not guarantee correctness or future results.
A strategy alert fires on the conditions it was written for; do not assume it covers every custom Heikin Ashi rule. Verify the exact alert condition and whether it waits for bar closure.
Subscription Options
Choose a plan based on the workflow and data depth you need. The current LuxAlgo pricing comparison lists these chart and history limits:
| Plan | Charts per tab | Historical bars | Relevant use |
|---|---|---|---|
| Free | 1 | 5,000 | Explore one chart and switch between styles |
| Premium | 8 | 20,000 | Compare multiple views with more history |
| Ultimate | 12 | 30,000 | Larger layouts and deeper strategy review |
| Ultra | 16 | 50,000 | The largest listed layouts and history allowance |
Check the pricing page for current charges, billing intervals, credit allowances and market-data access. Promotions and annual equivalents can differ from monthly billing. Premium and above also include access to the TradingView flagship toolkits; those remain separate products from native chart controls. A paid plan adds capacity and features, not a demonstrated improvement in trading performance.
Summary
Heikin Ashi helps describe trend persistence through averaged candles. Long runs without opposing shadows can make direction easier to read, while shrinking bodies and mixed colors can prompt a reassessment. Its limitations follow from the same smoothing: delayed changes, obscured price detail and synthetic levels.
Use Quant Charts to compare the display with regular candles, add indicators with explicit inputs, and use Quant to help test precise rules. Keep actual-price execution and independent risk controls at the center of the process.
FAQs
What makes Heikin Ashi useful for spotting trends?
Its averaged values often create longer runs of same-colored candles, reducing visual noise. That can help describe trend persistence, but smoothing adds lag and can hide actual-price details. It does not guarantee fewer losing signals or better performance than regular candles.
Are Heikin Ashi prices actual market prices?
No. The open and close are calculated values, and the plotted high or low can also differ from the regular bar. Use actual market prices for orders and check that backtests do not assume fills at synthetic HA levels.
How can I combine Heikin Ashi with moving averages?
Specify the moving average type, period and source. Common starting points include 9- and 21-period EMAs or 50-, 100- and 200-period SMAs. An average of HA closes differs from an average of regular closes, and combining smoothing methods can add delay. Test the exact rule and timeframe.
Does a small Heikin Ashi candle signal a reversal?
A small body with shadows on both sides indicates reduced directional persistence in the smoothed series. It can appear during consolidation, a pause or a reversal. Wait for the specific confirmation rule in your strategy rather than treating the shape as a prediction.
Can I use Heikin Ashi in Quant Charts?
Yes. Heikin Ashi is available in the chart-style control. Where your plan permits multiple charts, compare it with regular candles on the same symbol and timeframe. Check the selected cell and indicator source before applying studies or scripts.
How does Quant help test a Heikin Ashi strategy?
Quant can help write rules that calculate HA signals from regular data and model entries, exits and risk. Inspect the generated code and run it manually. Verify actual-price fills, bar confirmation, costs, losing trades and results on an untouched period before drawing conclusions.
References
LuxAlgo Resources
- Heikin Ashi: Formula and Interpretation
- Quant Charts
- Chart Types, Layouts and Settings
- Moving Average
- Multi-Chart Widget
- LuxAlgo Quant
- Making Strategies with Quant
- LuxAlgo Pricing
External Resources
Read next