Hierarchical Risk Parity Rebalancing Methods

Hierarchical Risk Parity (HRP) is a portfolio allocation method that uses estimated asset relationships to organize weights. It groups assets, orders them by that hierarchy and recursively divides capital using estimated cluster variances. Rebalancing is a separate decision: when to refresh those estimates and how much of the resulting weight change to trade.
HRP can be useful when you want a risk-based alternative to a return-forecast-driven allocation. It does not eliminate estimation error, guarantee diversification or ensure equal risk contributions from every asset. Historical correlations and variances remain assumptions about an uncertain future.
How the HRP Allocation Process Works
PyPortfolioOpt’s HRP documentation attributes the method to Marcos López de Prado and provides an implementation that accepts historical returns or a covariance matrix. Its allocation avoids explicitly inverting the covariance matrix. That is a specific computational property, not proof that HRP always outperforms other methods.
1. Estimate Relationships and Build the Hierarchy
Start with aligned asset returns measured at a consistent frequency and in a common base currency. Choose the universe, historical window and treatment of missing observations before testing. Corporate actions, fund distributions and differences in market closing times can materially affect the relationships you estimate.
A common correlation distance is d(i,j) = √[(1 − ρ(i,j))/2], where ρ is the estimated correlation. More positively correlated assets have smaller distances under this definition. Hierarchical clustering builds a tree from those distances. PyPortfolioOpt uses single linkage by default and supports other linkage choices; changing that choice can change the resulting portfolio.
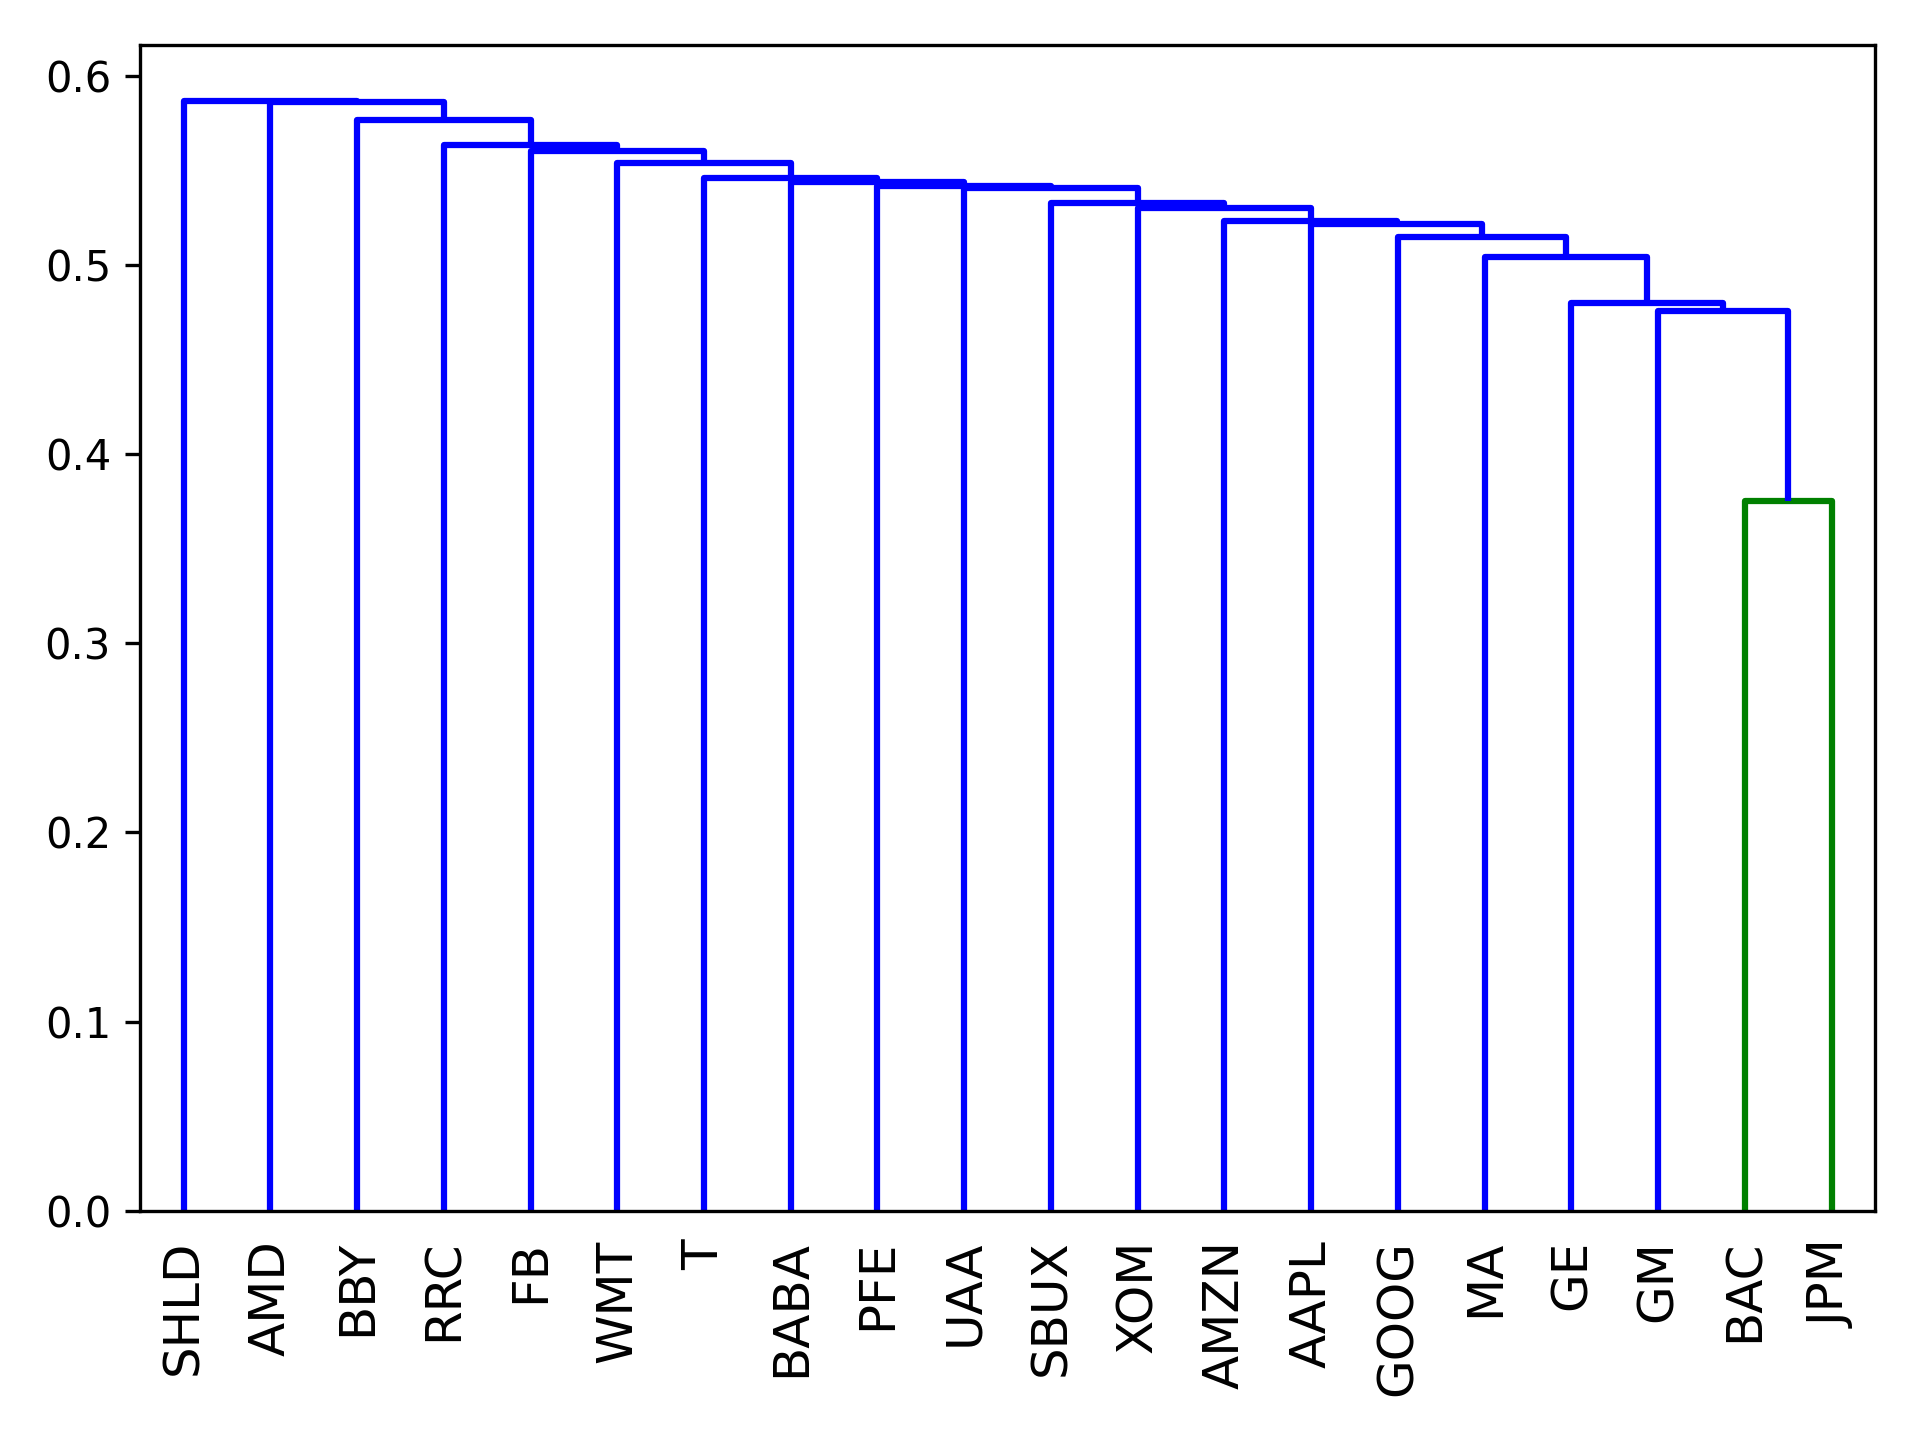
The original discussion mentioned AGNES and DIANA. These describe different clustering approaches, rather than two mandatory HRP steps. Record the actual algorithm and linkage method used so that another person can reproduce the ordering.
2. Reorder the Covariance Matrix
Use the tree’s leaf order to place related assets next to each other in the covariance matrix. This is often called seriation or quasi-diagonalization. It rearranges the same estimates; it does not erase cross-cluster covariance or make the matrix literally diagonal.
The ordering matters because the recursive allocation follows the ordered list. Inspect the tree and resulting exposures, especially when many assets are nearly identical or several distances are tied. A familiar-looking cluster is not evidence that its relationships will remain stable.
3. Allocate Recursively Using Cluster Variances
In the documented implementation, each ordered group is split in two. Within each subgroup, inverse-variance weights are used to estimate its variance. If those two variances are V₁ and V₂, the first group receives the fraction V₂/(V₁ + V₂) and the second receives V₁/(V₁ + V₂). The process repeats within the subgroups.
Illustrative split: suppose two subgroup variances, measured on the same scale, are 0.04 and 0.16. The fractions are 0.16/0.20 = 80% and 0.04/0.20 = 20%. Lower estimated variance receives more capital at this split. These are assumed inputs, not recommended weights or a forecast.
This inverse-variance split is not the same as equal risk contribution. Even if the two groups were uncorrelated, their weighted variance components would be 0.8² × 0.04 = 0.0256 and 0.2² × 0.16 = 0.0064. They are unequal. The name “risk parity” should not be read as a guarantee that every final holding contributes identical risk.
Choose a Rebalancing Rule Separately
HRP produces target weights for a particular data snapshot. It does not, by itself, specify a monthly schedule, a trading threshold or automatic order execution. Define those operational rules before comparing performance.
| Method | How it works | Tradeoff to evaluate |
|---|---|---|
| Calendar-based | Refresh estimates and rebalance on a fixed schedule, such as monthly or quarterly | Simple to reproduce; may trade small changes or wait through a large drift |
| Threshold-based | Check current weights against targets at defined review times; trade only when a specified band is breached | Can reduce small trades; needs an exact band and monitoring rule |
| Hybrid | Recalculate targets on a schedule and trade only material deviations | Separates model updates from execution, but adds parameters |
| Cash-flow-assisted | Use available contributions or withdrawals to move toward approved targets before selling holdings | May reduce sales; depends on the size and timing of cash flows |
For a band, distinguish percentage points from relative percentages. A move from a 20% target to a 25% holding is five percentage points of drift and a 25% relative increase. State whether a breach triggers a return to the full target or only to the band edge. Also specify whether the comparison uses a fixed target or newly recalculated HRP weights.
A possible research policy is to estimate targets after month-end using only data then available, compare them with the current holdings, and model trades at the next executable opportunity. That is an example to test, not a universal best schedule. Do not calculate weights with a closing price and assume you could already have traded at that same close.
A Simple Rebalance and Cost Example
Assume a $100,000 portfolio with no cash flows. The following targets are hypothetical outputs of an allocation process; the table illustrates execution arithmetic rather than deriving HRP weights from a return dataset.
| Holding | Current weight / value | Target weight / value | Planned change before costs |
|---|---|---|---|
| A | 60% / $60,000 | 50% / $50,000 | Sell $10,000 |
| B | 25% / $25,000 | 30% / $30,000 | Buy $5,000 |
| C | 15% / $15,000 | 20% / $20,000 | Buy $5,000 |
The sum of absolute weight changes is 20 percentage points, corresponding to $20,000 of gross traded value. Under the common one-way turnover convention, half that sum is 10%. State the convention whenever comparing turnover numbers.
If the assumed trading cost is 0.10% of each dollar bought or sold, estimated cost is $20,000 × 0.001 = $20. That leaves $99,980 before other effects, so the final order plan must allow for costs and available cash. Spreads, market impact, taxes, minimum trade sizes and price movement can change the result. A low-volatility backtest that ignores these frictions is incomplete.
What HRP Can and Cannot Improve
HRP offers a structured way to use relationships among assets and avoids one source of numerical difficulty associated with matrix inversion. It still depends on the return sample, covariance estimate, universe and clustering choices. A singular matrix may not prevent this allocation procedure, but zero variances, invalid correlations or poor data still need handling.
It does not automatically detect market changes as they happen. Clusters change when you refresh the estimates, and a historical window can react slowly or noisily. Shorter windows may respond faster while making weights less stable. Neither choice guarantees lower drawdowns.
Review capital concentration, estimated risk contributions and shared economic exposures separately. A low-volatility holding can receive a substantial weight, while several differently named assets can share the same underlying driver. Position or sector caps require an explicit constrained method or documented adjustment; applying caps after HRP changes the original allocation and requires re-evaluation.
Claims that HRP always has better risk-adjusted returns, lower drawdowns or greater robustness than alternatives are too broad. Results from a particular research sample or index design depend on its data, constraints, timing and costs. Evaluate the full implemented strategy rather than transferring a published ranking to your own portfolio.
Compare Methods on the Same Terms
| Method | Main allocation idea | Important distinction |
|---|---|---|
| Equal weight | Allocate the same capital fraction to each asset | Simple baseline; does not equalize risk |
| Inverse variance (IVP) | Weight each asset in proportion to one divided by its variance | Uses individual variances without using correlations in the weight formula |
| Equal risk contribution (ERC) | Seek equal contributions to a defined portfolio risk measure | Different objective from the recursive HRP split |
| Mean-variance allocation | Optimize an objective using estimated risk and, where relevant, expected returns | Minimum-variance versions need no expected-return forecast; constraints and estimates matter |
| HRP | Use hierarchical ordering and recursive variance-based splits | Depends on data and hierarchy; no universal performance ranking |
Modern Portfolio Theory is a broad framework, not one fixed competing portfolio. The Critical Line Algorithm (CLA) is an algorithm for solving mean-variance portfolio problems, rather than a separate promise of high or low robustness. Compare specific implementations with the same investable universe, rebalance dates, cost model and exposure constraints.
- Prevent hindsight: select the universe and estimate each allocation using information available at that date, including delisted assets where relevant.
- Use later evaluation periods: choose model settings without repeatedly tuning them to the same reported test period.
- Measure more than volatility: examine net return, drawdown, turnover, concentration and sensitivity to nearby settings.
- Stress the process: test missing data, correlated selloffs, liquidity constraints and rejected or partial orders.
- Keep a record: save the data cutoff, inputs, target weights, actual trades and the reason for each rebalance.
Where LuxAlgo Fits in the Research Workflow
Use LuxAlgo’s native charts to examine individual holdings or strategy hypotheses alongside your portfolio research. Check the symbol and provider coverage and keep the multi-asset return dataset used for HRP consistent. A collection of charts is not, by itself, an account-level portfolio optimizer.
For a supported chart-based hypothesis, ask Quant, our coding agent to help implement it, inspect the generated code and run it manually. Native strategy results should be interpreted within their symbol, timeframe and simulation settings. Do not treat a single-symbol test as a synchronized multi-asset HRP backtest.
Calculate portfolio weights and simulate portfolio-level cash, holdings and rebalances in a suitable implementation, such as the documented HRP library discussed above. Broker execution, account reconciliation and allocation constraints remain separate work. TradingView indicators or LuxAlgo’s separate TradingView toolkits do not establish that an end-to-end HRP workflow is available.
The workspace video shows how related chart research can be organized. Keep the portfolio allocation version and its assumptions in the research record as well; the video does not demonstrate automated portfolio execution.
Develop the Method Through Controlled Comparisons
Possible extensions include alternative linkage methods, covariance estimators and rebalance bands. Change one choice at a time, preserve the baseline and compare net results on later data. More adaptive clustering can also create more turnover or overfitting. HRP is a useful allocation framework to evaluate, not a substitute for portfolio objectives, execution controls or realistic loss scenarios.
Frequently Asked Questions
Does HRP guarantee equal risk from every asset?
No. Recursive HRP uses cluster variance estimates to divide capital. That is not the same as solving for equal risk contributions across all holdings.
How often should an HRP portfolio rebalance?
There is no universal schedule. Compare calendar, threshold and hybrid rules using the same data and realistic costs, and define when targets are refreshed.
Does HRP avoid estimation error?
No. It avoids explicit covariance-matrix inversion in the implementation discussed here, but still depends on estimated variances, correlations and clustering choices.
Is inverse-variance weighting the same as inverse-volatility weighting?
No. Variance is volatility squared. Weighting by one divided by variance generally gives a different allocation from weighting by one divided by volatility.
Can native LuxAlgo chart results verify a full HRP portfolio?
Not by themselves. Constituent chart research and a synchronized multi-asset simulation with holdings, cash, costs and rebalances are different evaluation tasks.
Read next