High-Frequency Trading vs. Retail Algorithmic Trading
High-frequency trading and retail algorithmic trading share one word and almost nothing else. High-frequency trading is a business run by a small number of proprietary firms that compete on latency, hold positions for seconds or less, and pay for exchange co-location, custom hardware and microwave links to do it. Retail algorithmic trading is an individual encoding a rule, testing it on historical bars and letting software execute it through a broker over minutes, hours or weeks. The comparison matters because the first is routinely used to sell the second: retail traders are told they can "trade like HFT" with a fast platform, when the research shows the speed race is closed to them and the durable edges lie elsewhere. This guide defines each, sets out the speed stack and what the best study of it measured, explains the regulation each side operates under, and shows where the two actually meet, on the chart, where Quant Charts exposes the order flow that fast firms generate and Quant, our coding agent, writes and backtests the slower rules retail traders can run.
Key points:
- Different businesses, not different speeds. HFT sells liquidity and arbitrages latency; retail algorithmic trading expresses a view over time. The gap is in economics, not just hardware.
- The race is measured and concentrated. Research on exchange message data found latency-arbitrage races lasting millionths of a second, with six firms on most of them.
- Retail pays for the race through the spread. Which is why costs, not speed, are the variable a retail system must manage.
- The meeting point is order flow. Footprints and volume delta show what fast participants did; slower rules can be built around them.
Video: Algorithmic Trading vs High-Frequency Trading
QuantInsti's explainer on how algorithmic trading and high-frequency trading differ in horizon, infrastructure and strategy. It is a useful primer before the detail below.
What Each Actually Is
| Dimension | High-frequency trading | Retail algorithmic trading |
|---|---|---|
| Who | A small number of proprietary trading firms, often also registered market makers | Individuals and small teams trading their own capital or a prop-firm account |
| Business | Market making, latency arbitrage, short-horizon statistical arbitrage | Trend, momentum, mean-reversion and event rules expressed over bars |
| Horizon | Milliseconds to minutes; positions rarely held overnight | Minutes to months |
| Data | Direct exchange feeds, full order-book depth, message-level data | Consolidated or vendor bar data; some order-flow aggregates |
| Infrastructure | Co-located servers, FPGA and custom hardware, microwave or shortwave links between venues | A computer or hosted server and a broker connection |
| Execution | Direct market access, own connectivity to each venue | Through a broker, which may route or internalise the order |
| Regulation | Registered firms subject to algorithmic-trading rules, market-access controls and market-making obligations | Customer of a regulated broker; account rules and the broker's controls |
| Edge | Speed and queue position, paid for in infrastructure | A tested rule, discipline and cost control |
The definitional line is horizon and infrastructure. Wikipedia's summary of the research literature lists highly sophisticated algorithms, co-location and very short-term investment horizons as the defining attributes of high-frequency trading; none of them describes a retail system, however fast its platform. The scale is also different in kind: in 2009, high-frequency firms were estimated at about two percent of US trading firms but around seventy-three percent of equity order volume, and by 2012 more than sixty percent of US futures volume.
The Speed Stack
High-frequency firms buy speed in layers. Co-location places their servers in the exchange's own data centre, so the distance a message travels is metres rather than kilometres. Custom hardware, including field-programmable gate arrays, handles market data and order logic without the delays of a general-purpose operating system. Between venues, firms replaced fibre with microwave and shortwave links because signals through air travel at close to the speed of light in a vacuum, while light in fibre is materially slower, so a microwave path between two exchanges arrives first. Our guides to latency standards in trading systems and high-frequency trading in 2026 cover the engineering; the point here is the cost structure. Each layer is a recurring expense that only pays if the firm wins enough races, and the study below shows how few firms do.
What the Research Measured
The clearest evidence is Aquilina, Budish and O'Neill's study for the UK Financial Conduct Authority and the Bank for International Settlements, which used exchange message data, including the failed orders that ordinary order-book data omit, to observe latency-arbitrage races directly in FTSE 100 stocks. Races happened roughly once a minute per symbol, the typical race lasted five to ten millionths of a second, and races accounted for about a fifth of trading volume. The top six firms were on one side or the other of more than four fifths of all race wins and losses. Each race was worth about half a tick; across the market that summed to roughly half a basis point of trading cost, and the authors estimated the stakes at around five billion dollars a year in global equities. For a retail trader the numbers settle the question: the race is real, it is won by six firms, and a broker connection measured in milliseconds is not a ticket to it.
Where Retail Meets HFT
Retail orders and high-frequency firms meet in two places. The first is the spread. A market order from a retail account is usually filled by a market maker, either on an exchange or through the broker's routing arrangements, and the market maker's spread is partly the price of the latency races it wins and loses; the study above put the latency-arbitrage component at about half a basis point and roughly a third of the effective spread. Retail traders cannot avoid paying it, but they can measure it: the Library's execution cost modeling entry sets out the accounting, and our guide to market makers explains the other side of the fill.
The second meeting place is the tape. Fast participants leave traces: per-side volume at each price, imbalances between bid and ask prints, absorption where aggressive selling fails to move price, and the metronomic slices of institutional execution algorithms. The Library's footprint concepts, cumulative volume delta, bid/ask imbalance, absorption and exhaustion and execution algo footprints entries describe how to read them. A retail trader is not competing with the fast firms in these reads; they are using what the fast firms did as information for a slower decision, which is the only version of "order flow trading" that is actually available at retail speed.
What HFT Costs Its Practitioners
The regulatory burden is the part of high-frequency trading that retail comparisons omit. In the European Union, MiFID II and its technical standard RTS 6 require firms engaged in algorithmic trading to test algorithms before deployment, run pre-trade controls such as price collars and maximum order sizes, monitor positions in real time, maintain kill functionality that cancels all orders at once, and self-assess annually; firms pursuing market-making strategies take on quoting obligations as well. In the United States, the market access rule in force since 2010 requires broker-dealers to apply pre-trade risk controls to every order, and its enforcement is not theoretical: regulators fined Knight Capital twelve million dollars in 2013 over the 2012 software malfunction that sent erroneous orders for most of an hour and cost the firm a pre-tax loss of around 440 million dollars. The 2010 flash crash, in which US indices fell and recovered within minutes as automated liquidity withdrew, is the other case behind these rules. A retail trader inherits the protective side of this regime through the broker's controls without carrying the compliance cost, which is one of the few respects in which the retail position is the easier one.
What Retail Algorithmic Trading Actually Is
Stripped of the HFT comparison, retail algorithmic trading is a rule, a test and an execution path. The rule is expressed on bars, minutes to days, using price, volume, indicators and increasingly the order-flow aggregates above. The test is a backtest with realistic costs, followed by out-of-sample and walk-forward checks; our guides to slippage and liquidity in backtesting and whether retail algo traders can compete set out the discipline. The execution path runs through a broker, which means latency is measured in milliseconds to seconds and cannot be improved enough to matter for the strategies that work at this horizon. The strategies that do work are the ones whose edge survives a slow fill: trend and momentum rules on hourly and daily bars, mean reversion around session anchors, event and regime filters, and position sizing that keeps any one trade small. What does not work is scalping against market makers on sub-minute bars, where the retail trader pays the spread the fast firms collect and competes on the one dimension they own; our scalping guide is candid about that boundary.
| Strategy family | How HFT firms run it | The retail version that survives a slow fill |
|---|---|---|
| Market making | Continuous two-sided quotes, inventory management, hedging across venues in microseconds | None; retail traders are the market maker's counterparty, not its competitor |
| Arbitrage | Latency arbitrage between venues and related instruments within a race | Slow statistical relationships: pairs and spreads held for days, tested with costs |
| Order-flow reading | Message-level order-book models reacting within the race | Footprints, delta and imbalance read on minute-plus bars as context for a slower rule |
| Trend and momentum | Rarely; holding periods are too short | The core of retail systematic trading on hourly to daily bars |
| Mean reversion | Microstructure reversals inside the spread | Reversion to VWAP, moving averages or ranges over hours to days |
Choosing, Honestly
For an individual the choice is not between two styles but between one style and a career change. High-frequency trading is a firm-level business with regulatory registration, venue connectivity and a payroll of engineers; the way an individual enters it is by joining such a firm. Retail algorithmic trading is available to anyone with a broker account and the discipline to test before trading. The useful comparison, then, is between doing retail algorithmic trading well and doing it badly, and the HFT literature gives the criteria: know what you pay in spread and slippage, do not compete on speed, treat the fast firms' activity as data rather than as an opponent to outrun, and keep the controls that regulation forces on the professionals, testing, limits and a way to stop everything, even though nobody forces them on you. Our comparisons of algorithmic and traditional trading and how institutions use algorithmic trading give the wider context, and algo trading and market liquidity covers the market-quality debate.
Where Quant Charts Fits
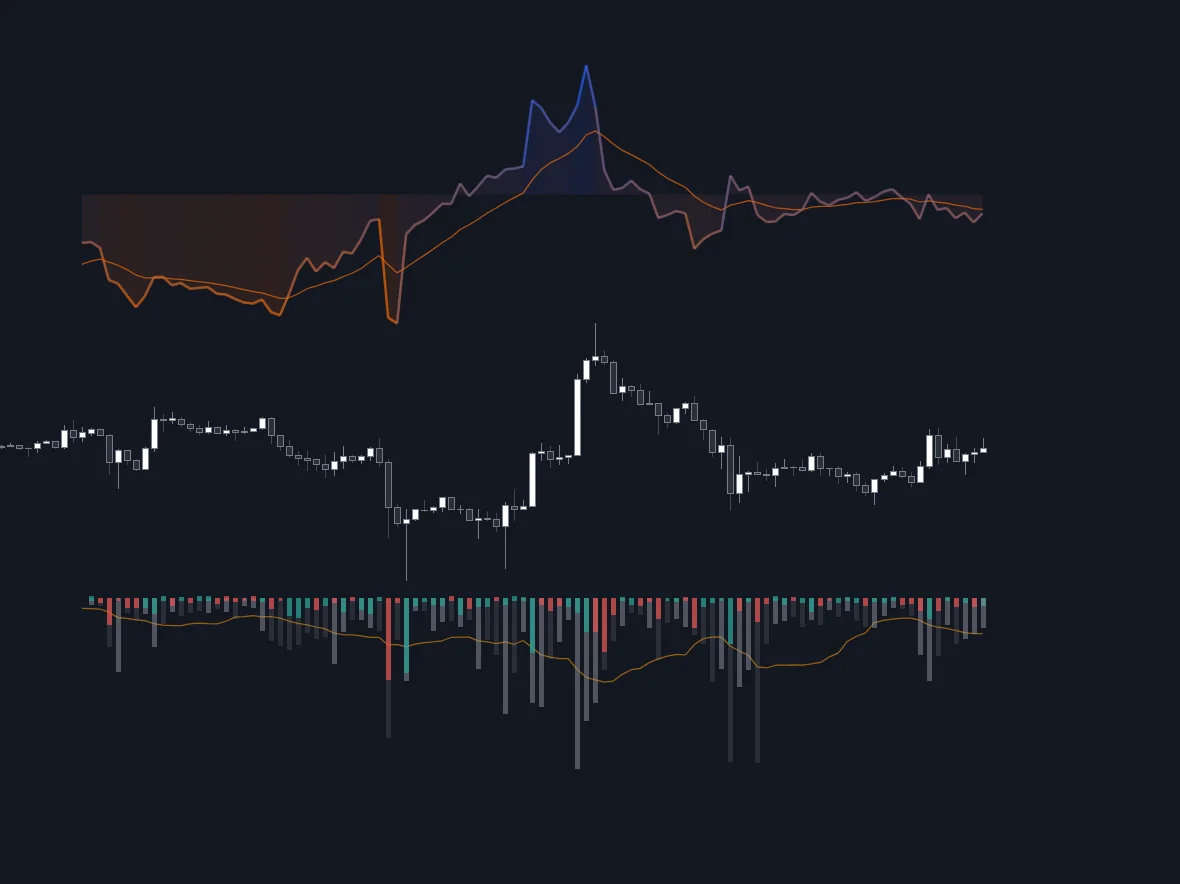
Quant Charts sits exactly at the meeting point described above. Its native Order Flow suite, footprints, volume delta, volume profiles, TPO, trade count and bar statistics, is built from pre-aggregated one-minute buy and sell volume at each price, re-bucketed to whatever timeframe the chart shows, for the footprint-capable crypto venues and US equities listed in the data documentation; the footprint documentation covers modes, imbalances and unfinished auctions. It is not a message-level feed and it is not for racing; it shows, at retail horizons, where aggression traded and whether it was absorbed. The charts use LuxAlgo market data from a single provider in front of several venues, with no exchange accounts or API keys to connect, and turning off Bar Animation in the chart settings gives the lowest latency between a trade printing and the bar reflecting it. From there, describe a rule to Quant, go long on a pullback to session VWAP only when cumulative delta has been rising for the session and the footprint shows absorption at the low, and Quant writes it in Pine Script on the active chart. Open Code to read the logic, click Run, and the Backtest Summary reports net profit, trade count, win rate, maximum drawdown and profit factor with commission and slippage set in the strategy properties, which is the cost test a retail system has to pass instead of a latency test. The Making Strategies with Quant guide shows the workflow, and the Library's Volume Delta Methods and Execution Cost Modeling indicators add the delta read and the cost model to any symbol.
The LuxAlgo platform does not place orders for you; it is a charting platform. Quant Charts is where rules are written and tested; execution, with its latency, stays with your broker.
Conclusion
High-frequency trading is a concentrated, capital-intensive, regulated business whose races last millionths of a second and are won by a handful of firms; retail algorithmic trading is a rule tested on bars and executed through a broker over minutes to months. The one is not a faster version of the other, and the research that measured the race shows why imitating it is futile. What retail traders can take from it is the cost of the spread they pay, the order flow the fast firms leave on the tape, and the control discipline regulators impose on professionals. Quant Charts puts the footprints and delta on the chart, Quant writes the slower rule, and the Backtest Summary judges it on costs rather than speed.
Key Takeaways
- Different businesses. HFT sells liquidity and wins races; retail algorithmic trading expresses a tested view over time.
- The race is measured. Five to ten microseconds per race, a fifth of volume, six firms on most of it, about half a tick each.
- Retail pays through the spread, so cost modelling, not latency, is the retail variable that matters.
- Order flow is the meeting point. Footprints, delta and imbalances show what fast participants did; use them as context for slower rules.
- On Quant Charts: native footprints and delta for supported venues, Quant writes the rule, the Backtest Summary reports it with costs; no LuxAlgo tool places orders.
FAQs
What is the difference between high-frequency trading and algorithmic trading?
Algorithmic trading is any rule-based automated trading. High-frequency trading is a subset run by specialist firms that compete on latency, hold positions for seconds or less and rely on co-location, custom hardware and direct market access. Retail algorithmic trading uses rules on bars, holds for minutes to months and executes through a broker.
Can a retail trader do high-frequency trading?
Not in the meaningful sense. Research on exchange message data found latency-arbitrage races lasting five to ten millionths of a second, with six firms on most of them; a retail order reaches a venue through a broker in milliseconds at best. High-frequency trading is a firm-level business with regulatory registration and venue connectivity, entered by joining such a firm rather than by buying a faster platform.
How much of the market is high-frequency trading?
Estimates vary by market and year. Wikipedia's summary of the research cites high-frequency firms at about two percent of US trading firms but around seventy-three percent of equity order volume in 2009, and more than sixty percent of US futures volume in 2012. The BIS and FCA study of FTSE 100 stocks found latency-arbitrage races alone accounting for about a fifth of volume.
Does high-frequency trading hurt retail traders?
Retail traders pay for it through the spread: the FCA and BIS study estimated latency arbitrage at roughly half a basis point of trading cost and about a third of the effective spread. Market makers also supply the liquidity retail orders consume, so the relationship is a cost rather than a predator-prey contest. The practical response is to measure and minimise spread and slippage, not to try to trade faster.
What strategies work for retail algorithmic traders?
Ones whose edge survives a slow fill: trend and momentum rules on hourly to daily bars, mean reversion around anchors such as VWAP, slow statistical relationships held for days, and event or regime filters, all with risk-based position sizing and costs charged in the backtest. Sub-minute scalping against market makers competes on the one dimension the fast firms own.
How does Quant Charts relate to high-frequency trading?
It does not race; it shows the aftermath. The native Order Flow suite renders footprints, volume delta and profiles from pre-aggregated per-price buy and sell volume for supported venues, so retail traders can read what fast participants did as context. Quant writes a slower rule around that read in Pine Script; Code shows the logic, Run produces the Backtest Summary with commission and slippage. No LuxAlgo tool places orders.
References
LuxAlgo Resources
- Quant Charts
- LuxAlgo Quant
- Making Strategies with Quant
- Quant Charts Data Documentation
- Footprint Documentation
- Charts Overview Documentation
- Volume Delta Methods (Chart) Indicator
- Execution Cost Modeling Indicator
- Footprint Concepts
- Cumulative Volume Delta Concept
- Bid/Ask Imbalance Concept
- Absorption and Exhaustion Concept
- Execution Algo Footprints Concept
- Execution Cost Modeling Concept
- Latency Standards in Trading Systems
- The Millisecond Manifesto: High-Frequency Trading in 2026
- Market Makers 101: Liquidity and Influence
- Scalping 101: High-Frequency Trading Tips
- Can Retail Algo Traders Compete with Wall Street?
- Backtesting Limitations: Slippage and Liquidity Explained
- Institutional Insights: How Pros Use Algo Trading
- Algorithmic Trading vs Traditional Trading: Key Differences
- Algo Trading and Market Liquidity: Friend or Foe?
External Resources
- Wikipedia — High-Frequency Trading
- Aquilina, Budish and O'Neill — Quantifying the High-Frequency Trading "Arms Race" (BIS Working Paper 955)
- FCA Occasional Paper 50 — Quantifying the High-Frequency Trading "Arms Race" (PDF)
- Wikipedia — Colocation Centre
- Wikipedia — Market Maker
- Wikipedia — Payment for Order Flow
- EUR-Lex — Commission Delegated Regulation (EU) 2017/589 (MiFID II RTS 6)
- EUR-Lex — Directive 2014/65/EU (MiFID II)
- Wikipedia — 2010 Flash Crash
- Wikipedia — Knight Capital Group
Read next