High Quality Investment Strategies: Three Filters

A three-filter approach to stock selection asks three questions in order: is the business financially strong, is it growing at a price that leaves room for error, and how does it rank against its peers when the answers are combined into one score? The idea is not new. Fundsmith, the fund manager founded by Terry Smith, summarizes its own process as "buy good companies, don't overpay, do nothing," and versions of the same discipline appear across quality investing. What this guide adds is the mechanics: where each number comes from in a company's financial statements, as the SEC describes them, how to turn several ratios into one comparable score, and how to run the screen and test the result in Quant Charts. It sets no magic thresholds, because the right cutoff depends on the sector, the cycle and the investor, and is something to test rather than to inherit.
Where the Numbers Come From
Every ratio in a quality screen is built from one of the statements a public company files. The SEC's Beginners' Guide to Financial Statements describes four: the balance sheet shows what a company owns and owes at a point in time; the income statement shows how much it earned and spent over a period; the cash flow statement shows the cash that moved between the company and the outside world over the same period; and the statement of shareholders' equity shows changes in the owners' interest. The annual 10-K and quarterly 10-Q contain all four, plus footnotes and management's discussion, and Investor.gov's guide to researching investments explains how to find them on EDGAR.
Two habits from the SEC guide protect a screen from bad inputs. Read the footnotes, which disclose the accounting policies that require management's most subjective judgments, along with taxes, pensions and stock options. And read the Management's Discussion and Analysis, where management explains the results in its own words. A figure pulled from a data table without those two checks can be built on a one-time gain or a change in accounting method.
Filter One: Financial Strength
The first filter asks whether the company can survive a bad year without diluting shareholders or defaulting. The inputs come from the balance sheet, which the SEC guide describes as assets on one side and liabilities plus shareholders' equity on the other, with assets listed by how quickly they convert to cash and liabilities by when they fall due.
- Leverage. Total liabilities, or interest-bearing debt, relative to shareholders' equity. The SEC guide defines shareholders' equity as what would be left if the company sold all its assets and paid off all its liabilities. The more of the balance sheet that belongs to lenders, the less cushion the owners have.
- Interest coverage. Operating profit divided by interest expense. The SEC guide describes the income statement as a set of stairs: gross revenue, less costs of sales for gross profit, less operating expenses and depreciation for operating profit, then interest income and expense, then tax. Coverage measures how many times the operating step covers the interest step.
- Liquidity. Current assets, which the SEC guide defines as those a company expects to convert to cash within one year, against current liabilities, which are due within the year. A version that excludes inventory is stricter.
- Return on capital. Operating profit relative to the capital employed to earn it, which is the test of whether the business creates value at all. Return on equity uses net income over shareholders' equity instead, and is flattered by leverage, so the two are read together.
Each of these needs a comparison, and the fair comparison is the company's own history and its sector. A utility and a software company carry different normal leverage, so a single cutoff applied across sectors rewards one and punishes the other for structure rather than quality.
Filter Two: Growth at a Fair Price
The second filter asks whether the business is growing and whether the market already charges for that growth. The growth inputs come from the income and cash flow statements.
- Revenue growth. The top line of the income statement, compared year over year. Growth stocks, in Investor.gov's definition, are those whose earnings grow faster than the market average.
- Earnings per share. The SEC guide defines EPS as net income divided by shares outstanding, the amount each share would receive if all earnings were distributed. Because it is per share, buybacks raise it and issuance lowers it, so EPS growth is read alongside revenue growth.
- Cash generation. The SEC guide notes that an income statement says whether a company made a profit while the cash flow statement says whether it generated cash. Cash from operating activities less capital spending from investing activities is the free cash flow that pays dividends, buybacks and debt.
- Margins. Gross profit and operating profit as a share of revenue, taken from the income statement stairs. Rising margins on rising revenue is the signature of pricing power or scale.
The price side is the price-to-earnings ratio, which Investor.gov defines as the share price divided by earnings per share and describes as a way of gauging whether the price is high or low compared with the company's past or with other companies. Investor.gov's definition of a value stock is one with a low P/E, and it notes that a low P/E can mean the market has soured on the company. Dividing P/E by the earnings growth rate relates the two, but the result is only as good as the growth estimate. A stock can pass the growth test and fail the price test, and the discipline of the second filter is refusing to pay any price for the first.
Filter Three: One Score From Many Ratios
The third filter turns the ratios into a single ranking so that candidates can be compared. Raw ratios are not comparable: a debt ratio of 0.4 and a revenue growth of 12 percent live on different scales. The Library's z-score entry describes the standard fix. A z-score expresses how far a value sits from the average of its group, measured in standard deviations, so a reading of 0 is average and +2 is two standard deviations above. Applied across a peer group, each ratio becomes a unitless score, and scores can be averaged.
The procedure has four steps. Define the peer group, usually a sector or industry, so that the average being measured against is meaningful. Compute the z-score of each ratio across the group, flipping the sign for ratios where lower is better, such as leverage and P/E. Weight the categories, for example financial strength, growth and valuation, and average the weighted scores. Rank. The weights are a choice, not a fact: an investor who cares most about survival weights strength higher; one hunting for growth weights it lower. The Library's z-score entry also carries a warning that applies here: the intuition that most values fall within two standard deviations assumes a normal distribution, and financial ratios have outliers, so extreme scores deserve a look at the underlying statement rather than automatic acceptance.
| Filter | Question | Statement | Ratios | Direction |
|---|---|---|---|---|
| Financial strength | Can it survive a bad year? | Balance sheet; interest line of the income statement | Debt to equity, interest coverage, current ratio, return on capital | Lower leverage, higher coverage and returns |
| Growth | Is the business getting bigger and more profitable? | Income statement; cash flow statement | Revenue growth, EPS growth, free cash flow, margins | Higher and consistent |
| Valuation | Is the growth already priced in? | Market price against the income statement | P/E, P/E relative to growth, price to free cash flow | Lower relative to peers and own history |
| Score | How does it rank? | All of the above | Z-scores by peer group, weighted and averaged | Highest composite, then read the footnotes |
From Screen to Portfolio
A ranked list is not a portfolio. Three rules from the Library connect the two.
- Size by risk, not by conviction. The fixed fractional entry describes risking the same fraction of equity on each position, with size back-solved from the distance to the point at which the thesis is wrong. A high composite score does not earn a larger fraction; it earns a place on the list.
- Judge the result by drawdown as well as return. The drawdown statistics entry explains that a 50 percent drawdown needs a 100 percent gain to recover, and that duration breaks investors as often as depth. A quality screen is supposed to produce shallower drawdowns than the market; the record should be checked against that claim.
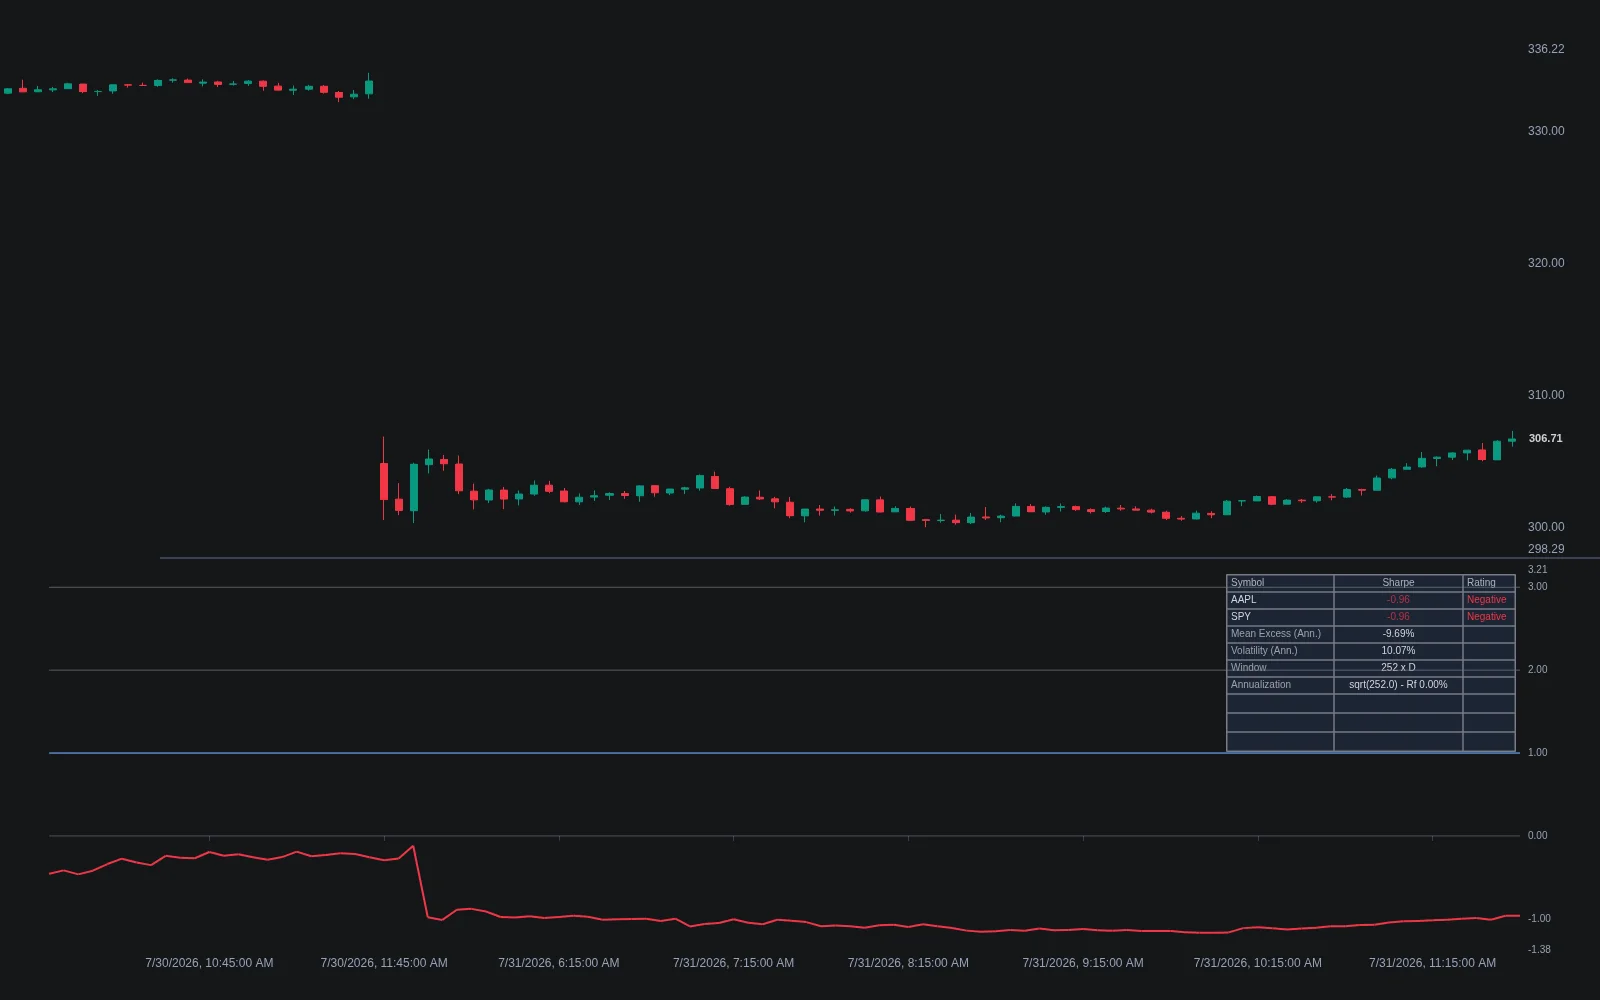
- State returns on a comparable basis. The CAGR entry gives the compound annual growth rate as the standard annualized figure, and the Sharpe ratio and Sortino ratio entries divide excess return by total or downside volatility. Together they answer whether the screen earned its return efficiently or simply took more risk.
The third leg of the Fundsmith mantra, do nothing, is the hardest to test and the easiest to skip. A screen re-run every quarter will produce a slightly different list every quarter. Turnover has costs, and the value of a quality filter comes from holding the businesses that keep passing it, not from trading the margin of the list.
Where Quant Charts Fits
The Financials tab is the screen. Put the candidate universe on a watchlist in Quant Charts and open the Advanced view. The Financials tab shows revenue, net income, EPS, P/E, dividend per share, yield and beta for each stock, with year-over-year growth where it exists. Column headers sort, and the filter on a header narrows by a numeric threshold or a checklist, so filter one and filter two can be applied as column filters. Group by sector keeps the peer comparison honest, and Sections let you keep the survivors in a group of your own that saves with the list. Company fundamentals are available for stocks on every plan; ETFs are grouped separately because the data reports the issuer, not the holdings.
Quant tests what the screen implies. A fundamental screen chooses what to hold; a price rule decides when. Describe the rule to Quant, our coding agent, in plain language, for example buying a screened stock when it closes above its 200-day average and selling when it closes below, and Quant writes the Pine Script. Open Code to inspect it, then click Run. The Backtest Summary reports net profit, trade count, win rate, max drawdown and profit factor, and the docs are explicit that a metric with few trades behind it is noise and that a 30 percent win rate with large winners can beat a 70 percent win rate with large losers. Commission and slippage belong in the strategy's Properties. Run the same rule across the list and compare max drawdown with a buy-and-hold of the same names, which is the do-nothing leg tested rather than assumed.
The video below shows how indicators are added from the picker in Quant Charts.
The Journal keeps the score honest. Every plan includes the Journal, which turns broker fills or imported trades into round trips and reports results by symbol, side and hold time over any date range. Tagging positions by the filter that admitted them shows, a year later, whether the strength filter or the valuation filter did the work. No LuxAlgo tool places orders; the Journal records trades made elsewhere.
FAQs
What are the three filters in a quality investment strategy?
Financial strength, read from the balance sheet and interest coverage; growth at a fair price, read from the income and cash flow statements against the P/E ratio; and a composite score that ranks candidates against their peers. A company must pass the first two before it is scored.
Where does the three-step idea come from?
Fundsmith, the fund manager founded by Terry Smith, describes its process as buying good companies, not overpaying and then doing nothing. This article borrows that structure but does not attribute any numeric thresholds to the firm; cutoffs are for the investor to set and test.
How is earnings per share calculated?
The SEC's Beginners' Guide to Financial Statements defines EPS as net income divided by the number of shares outstanding, the amount each share would receive if all net income for the period were distributed.
What does the P/E ratio tell you?
Investor.gov defines it as share price divided by earnings per share, a gauge of whether the price is high or low relative to the company's past or to other companies. A low P/E defines a value stock and can also mean the market has lost confidence in the business.
Why use z-scores to combine ratios?
Ratios live on different scales. A z-score restates each one as the number of standard deviations from the peer-group average, so leverage, growth and valuation can be averaged into one comparable score. Outliers still deserve a look at the underlying statements.
How does Quant Charts help apply the filters?
The watchlist Advanced view shows revenue, net income, EPS, P/E, dividend, yield and beta with sortable, filterable columns and sector grouping. Quant can then backtest an entry rule on the survivors and report win rate, max drawdown and profit factor, and the Journal tracks the live result.
References
LuxAlgo Resources
- Z-score, CAGR, Sharpe Ratio, Sortino Ratio, Drawdown Statistics and Fixed Fractional concepts (LuxAlgo Library)
- Sharpe Ratio indicator (LuxAlgo Library)
- Watchlist Advanced view (LuxAlgo Docs)
- Making strategies with Quant, Reading a strategy backtest and Journal (LuxAlgo Docs)
External Resources
- Beginners' Guide to Financial Statements (SEC)
- Stocks and Price-earnings (P/E) Ratio (Investor.gov)
- Researching Investments (Investor.gov)
- Fundsmith (Owner's Manual and investment approach)
This article is educational and is not a recommendation to buy or sell any security. Thresholds and weights are illustrative choices for the reader to test, not rules.
Read next