Historical vs Implied Volatility Skew: Key Differences

The useful comparison is today’s implied-volatility skew versus the history of that same skew measure. Historical volatility, historical return skewness and historical option-skew observations are different quantities. Treating them as interchangeable can lead to incorrect comparisons and trading rules.
Implied-volatility skew describes how option-implied volatility varies across strikes or comparable deltas for a specified expiration. Its history records how that pricing relationship changed over time. Historical volatility instead measures the variability of past underlying returns; return skewness measures their asymmetry.
Four Measures That Need Different Data
| Measure | Data and meaning | What it does not establish |
|---|---|---|
| Historical volatility | Underlying returns over a chosen window; commonly an annualized standard deviation | The shape of an option-implied volatility curve |
| Historical return skewness | Asymmetry in a sample of underlying returns | The relative price of current option protection |
| Current implied-volatility skew | Option quotes at different strikes or deltas, with a specified expiration and pricing convention | A certain future direction or realized return distribution |
| Historical implied-volatility skew | Past observations of the same defined option-skew metric | A guarantee that the metric will return to its average |
The Options Industry Council distinguishes historical and implied volatility. That distinction concerns volatility levels. To analyze skew, you must also specify the relationship across options or the asymmetry statistic being measured.
How the Calculations Differ
Historical Volatility and Return Skewness
For a basic historical-volatility estimate, calculate returns at a consistent frequency, take their standard deviation over a stated window and apply a stated annualization convention. For example, a 1% daily standard deviation multiplied by √252 is approximately 15.9% annualized. The factor 252 is a trading-day convention, not a universal setting for every market or dataset.
A 20-day and a 60-day estimate can differ because they cover different observations. Choose the window and treatment of missing prices, distributions and corporate actions consistently. Historical volatility summarizes movement size; its value does not tell you whether the return distribution is left- or right-skewed.
Return skewness is a separate statistic describing asymmetry. A negative value indicates a longer or heavier left-side tendency under the chosen estimator, while a positive value indicates the opposite. Small samples and unusual observations can strongly affect it. Neither variance nor standard deviation is itself a skewness calculation.
Implied Volatility Across Options
Implied volatility is the model input that makes an option-pricing calculation match an observed option price, given the other inputs and assumptions. Use a model appropriate to the contract, including its exercise style and underlying. Black-Scholes is a familiar starting point, but it is not the only model used for every option.
For a skew curve, compare options from the same underlying and expiration at a consistent quote time. Plot implied volatility against strike, moneyness or delta. A term structure compares expirations instead; a volatility surface contains both dimensions. Mixing expirations while calling the difference “strike skew” confuses two effects.
Define the Skew Metric and Its Sign
CME Group explains a common risk-reversal measure: the difference between the implied volatilities of a call and put with the same absolute delta. Under a call IV minus put IV convention, relatively higher put IV produces a negative number. Some displays use the opposite subtraction, so always state the sign convention.
Hypothetical 25-delta example: call IV of 25% and put IV of 30% produce 25 − 30 = −5 volatility points. If the call stays at 25% while the put rises to 33%, the measure becomes −8 points. That is a three-volatility-point move, not a three-percent change in the option premium.
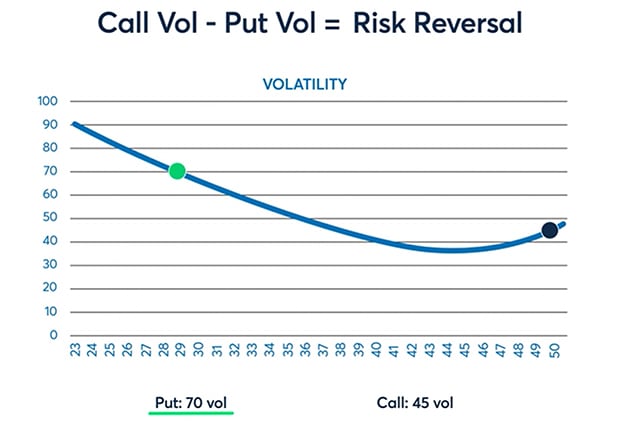
This comparison describes the relative implied-volatility pricing of the selected wings. It does not mean puts universally cost 3–5% more than calls. Raw premiums also depend on strike, expiration, intrinsic value and contract details, and equal absolute deltas generally correspond to different strikes.
A two-option risk reversal is one measure, not the entire curve. CME’s CVOL methodology uses broader information across the put and call sides. Keep that methodology distinct from a simple two-point quote when comparing current and historical values.
Compare Current Skew with Its Own History
Build the history from archived option observations or a reliable historical skew series. Underlying closing prices alone cannot reconstruct the option quotes that existed at each past timestamp. A rolling standard deviation of the stock is not a substitute for a historical risk-reversal series.
- Match the underlying and contract: avoid mixing products with different settlement, exercise or quotation conventions.
- Hold maturity treatment consistent: use a stated constant-maturity interpolation or a defined expiration-roll rule; do not silently compare a near-expiry quote with a much longer-dated one.
- Keep delta and sign conventions fixed: record how each wing is selected and how the subtraction is performed.
- Filter quote quality: inspect bid-ask spreads, stale observations and whether the selected prices represent executable interest.
- Use the same observation time: intraday event moves can make asynchronous quotes misleading.
There is no universal 30–60-day expiration range that guarantees liquidity or data accuracy. Check the actual contract and quote quality. Around earnings or other events, differences in maturity can also determine whether an option includes the event at all.
For example, today’s −8-point risk reversal might be compared with a prior sample median of −4 points under exactly the same definition. That makes the current value more negative than that sample median. It does not establish that the options are mispriced or that the underlying must fall. Supply, demand, hedging preferences and risk compensation are reflected in option prices alongside expectations.
Using Historical and Implied Information Together
Use historical underlying behavior to describe what occurred, and option data to describe how uncertainty was priced. Compare historical volatility with an appropriately matched IV level when studying volatility, and compare current skew with historical skew when studying relative wing pricing. Keep units and horizons aligned rather than subtracting unrelated measures.
A research record can pair each dated skew observation with subsequent underlying returns or a precisely modeled option strategy. Use only information available at entry, model all legs and costs, and evaluate later periods that did not determine the rules. A favorable historical association is not proof that a trade will work after spreads, fees and changing market conditions.
Strategy Questions and Their Risks
| Approach discussed in skew analysis | What to evaluate | Risk that remains |
|---|---|---|
| Relative-value option positions | Whether the selected strikes are attractive under an explicit pricing and hedging model | “Volatility arbitrage” does not automatically mean risk-free arbitrage |
| Ratio spreads using puts | The complete payoff, number of long and short contracts, and downside scenarios | Selling more puts than are covered by long puts can leave substantial downside exposure |
| Calendar spreads | Different expirations, event exposure and how each leg’s IV changes | This mainly involves term structure; assignment and expiry behavior also matter |
| Delta-hedged volatility positions | Hedge timing, transaction costs, gamma, vega and realized path | Initially near-zero delta does not make the position price-neutral at all later times |
Do not choose a strategy solely because the skew looks steep. Review the payoff, maximum loss where defined, margin, early assignment where applicable and the effect of a large move. Different option structures can respond very differently to the same skew change.
Volatility Skew Explained: Video
The retained tastylive video, uploaded August 25, 2017, introduces volatility-skew concepts. Treat its examples and platform views as historical education. Use the definitions above to distinguish strike skew, term structure and underlying historical statistics before applying a trade idea.
Use LuxAlgo for the Underlying Research
Start on LuxAlgo’s native charts to review the underlying’s price behavior and a defined historical-volatility hypothesis. Check the symbol and data provider so the research matches the instrument you intend to analyze. An underlying price chart does not supply an option chain or historical implied-volatility surface by itself.
For a supported chart calculation or strategy, ask Quant, our coding agent to help implement the rules, inspect the generated code and run it manually. Specify the return definition, lookback and annualization when measuring historical volatility. Review native strategy settings and individual trades rather than treating a historical result as a future forecast.
Use appropriate option data and an options-capable simulation for multi-leg skew strategies. A stock-based backtest, price projection or general sentiment indicator does not validate an option-skew trade. Keep the quote source, expiration and pricing assumptions with the results.
The video below demonstrates organizing related chart research in a LuxAlgo workspace. It does not calculate an option surface or execute an options strategy.
A Practical Comparison Checklist
Before interpreting a skew number, write down the measure, units, sign, delta or strike selection, expiration treatment and quote timestamp. Then compare it with a history constructed the same way. This turns a vague past-versus-future claim into a reproducible question that can be tested without confusing price variability with option pricing.
Frequently Asked Questions
Is historical volatility the same as historical volatility skew?
No. Historical volatility measures past return variability. Historical implied-volatility skew requires past option-skew observations, while return skewness is a separate measure of asymmetry.
What does a negative risk reversal mean?
Under the call-IV-minus-put-IV convention, it means the selected put has higher implied volatility than the selected call. Reverse the subtraction and the sign reverses.
Does steep downside skew predict a market fall?
Not with certainty. It describes relative option pricing and can reflect hedging demand and risk compensation as well as expectations.
Is the difference between expirations volatility skew?
It is usually described as volatility term structure. Strike skew compares strikes or deltas for a specified expiration; a full surface includes both dimensions.
Can historical stock prices recreate past implied skew?
Not by themselves. You need historical option quotes or a suitable archived skew series, plus consistent calculation and maturity conventions.
Read next