How AI Enhances Fixed Income Trading

Fixed income is the largest securities market most retail traders never touch directly. Bonds trade mainly through dealers rather than on a central exchange, prices for many issues are quoted rather than printed, and the instruments themselves, from Treasury bills to high-yield corporates, behave differently from stocks. That structure is exactly why institutions have applied machine learning to bond trading more aggressively than to equities: the hardest problems, pricing an issue that has not traded today, judging how much can be sold without moving the market, and reading central bank language, are problems of inference from sparse data. This guide explains what fixed income is, using the SEC's investor education material, FINRA and TreasuryDirect, what artificial intelligence actually does on institutional bond desks, what the LuxAlgo Library says about the models involved and how to validate them, and what an individual trader can do with bond exchange-traded funds and rate futures in Quant Charts, the LuxAlgo charting and AI platform. It replaces the accuracy percentages that circulate on this topic with what the sources support.
What Fixed Income Is
The SEC's Investor.gov defines a bond as a debt security: the buyer lends to the issuer, which may be a government, municipality or corporation, and the issuer promises a specified rate of interest during the bond's life and repayment of the principal, also called face or par value, at maturity. Investors buy bonds for a predictable income stream, typically paid every six months, for the return of principal if held to maturity, and to offset exposure to more volatile stock holdings. Investor.gov groups bonds by maturity as short term under three years, medium term four to ten years and long term over ten years, and by credit quality as investment grade or non-investment grade, the latter also called high-yield or speculative, which generally offer higher interest in return for higher default risk.
- Corporate bonds are issued by companies and split into investment-grade and high-yield by credit rating.
- Municipal bonds are issued by states, cities and other government entities; general obligation bonds are payable from general funds or taxes, revenue bonds from a specific project's revenues, and conduit bonds on behalf of private entities such as hospitals.
- US Treasuries carry the full faith and credit of the US government. TreasuryDirect lists the marketable securities: bills with terms from 4 to 52 weeks sold at a discount, notes of 2, 3, 5, 7 and 10 years paying interest every six months, bonds historically of 30 years and now also 20, floating rate notes with a two-year term whose interest follows the 13-week bill rate, Treasury Inflation-Protected Securities of 5, 10 and 30 years whose principal is adjusted by the Consumer Price Index, and STRIPS, which separate interest and principal payments into individually tradable pieces.
Investor.gov lists the risks that matter for everything that follows. Credit risk is the chance the issuer fails to pay. Interest rate risk is the effect of rate changes on a bond's value: rising rates make newly issued bonds more appealing, so an older bond with a lower coupon may have to be sold at a discount. Inflation risk erodes the purchasing power of fixed payments, liquidity risk is the chance of not finding a market for the bond when you want one, and call risk is the possibility that the issuer retires the bond early when rates fall. FINRA's bond guidance puts the central relationship in one sentence: when interest rates rise, bond prices tend to fall, and vice versa, and it notes that bond prices tend to be less volatile than stocks. FINRA also publishes fixed income data, including real-time information on corporate and agency bond trades, which is one of the few places where bond transaction prices are visible to the public.
Why Bond Markets Invite Machine Learning
Equities have a continuous public tape. Most bonds do not. A company may have dozens of outstanding issues, many of which do not trade on a given day, and a dealer asked for a price has to infer it from the issues that did trade, from the Treasury curve, from the issuer's other bonds and from comparable issuers. The Library's Feature Engineering entry describes the general version of this task: raw prices are a poor model input because they trend, drift and sit on a different scale for every symbol, so practical features are transformations that make observations comparable. In bond markets those transformations are the spread to a benchmark Treasury, the yield rather than the price, the time since the last trade and the size of the last trade, and the modelling problem is filling in a price surface that is mostly empty. That is a task for models that learn from comparable examples, which is what random forests, ensembles of decision trees trained on bootstrap resamples with random feature subsets, and neural networks, layered function approximators fitted by gradient descent, are built for.
What AI Does on Institutional Bond Desks
Described without vendor numbers, the applications fall into five groups. Each is a well-defined statistical task rather than a black box, and each carries the validation burden the Library documents.
- Pricing illiquid issues. A model estimates where an untraded bond would trade from the recent prints of similar bonds, the issuer's curve and the Treasury curve. The output is an evaluated price with an uncertainty band, and its quality is measured by how close it lands to the trades that later occur.
- Liquidity scoring. A model estimates how much of a bond can be bought or sold, at what cost, and how quickly, from how often it trades, dealer quotes and the bond's characteristics. This is the input to deciding whether a position is sizable and how to work an order.
- Dealer selection and request-for-quote automation. Because bonds trade by asking dealers for quotes, a model that predicts which dealers are likely to price a given bond competitively, and routes smaller trades automatically, is the fixed-income analogue of smart order routing in equities.
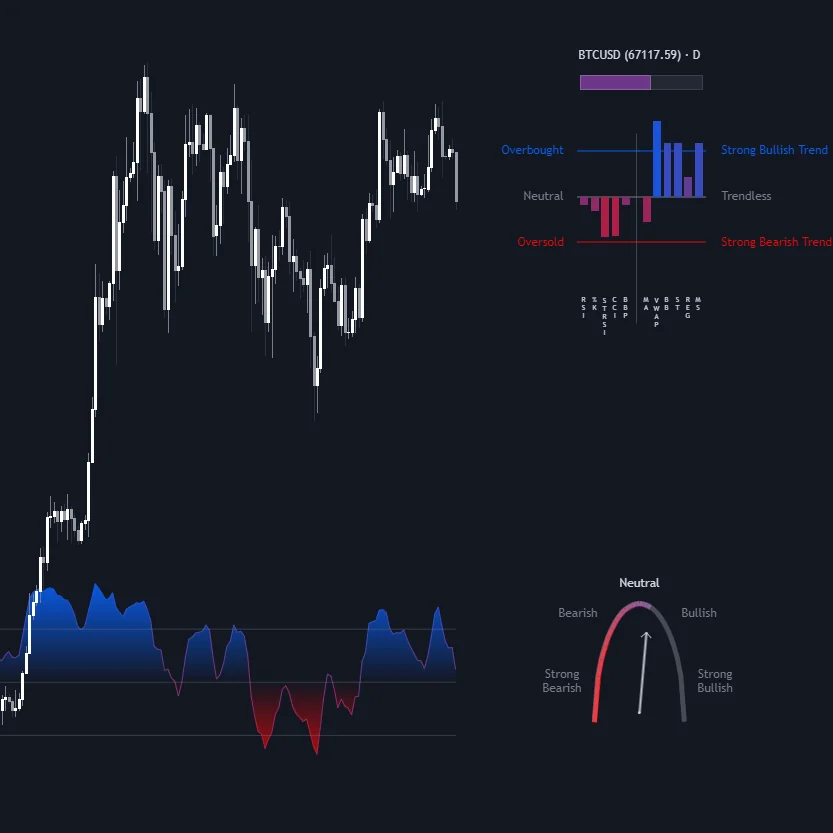
- Reading central bank language and news. Natural language processing turns Federal Open Market Committee statements, minutes, speeches and news into structured features. The Library's Market Sentiment Technicals indicator shows the same idea applied to price-based inputs: many signals normalised and averaged into one sentiment reading. Text-based sentiment is the same construction with words as the raw material.
- Regime and curve models. Models classify the rate environment, for example whether the curve is steepening because short yields are falling or because long yields are rising, and condition trading rules on the result. The Library's Yield Curve entry names the moves: a bull steepener when short yields fall faster, usually reflecting easing expectations, and a bear steepener when long yields rise faster, pointing to inflation or term-premium worry.
The Yield Curve Is Data, Not an Indicator
The yield curve is the reference every fixed income model works against, and the Library is precise about what it is. It is the line traced by government bond yields across maturities, from 3-month bills to 30-year bonds, upward-sloping in normal times because investors demand extra yield for locking money up longer, and inverted when short yields sit above long yields. Markets compress it into spreads: 2s10s is the 10-year yield minus the 2-year, and 3m10y, the 10-year minus the 3-month bill, underpins the New York Fed's recession-probability model. Inversions have preceded US recessions in recent decades, but the Library stresses that lead times have run from months to a couple of years and that equities have often kept rallying well after the first inversion, so the curve is regime information rather than an entry signal.
The entry also explains why no chart study can produce it. The curve needs simultaneous yields across many maturities sourced from Treasury market data such as the constant-maturity series on FRED; the price and volume of the symbol you trade contain none of that information. A platform can chart yield tickers and spread symbols directly, which is a data feed rather than a derived indicator, and bond-ETF ratio proxies, such as a long-duration fund against a short-duration fund, track the direction of the slope tolerably well without giving the true spread level or the zero line that defines inversion. Any AI model that claims to forecast the curve is therefore a model on external data, and its output should be judged the way the Library judges every forecast: out of sample.
The Validation Burden
The claims that circulate about AI in bond trading are almost always accuracy percentages with no test design attached. The Library's validation entries explain why such numbers mean little on their own. The in-sample / out-of-sample split is the minimum: a model tuned on one stretch of history must be scored on a stretch it never saw. Walk-forward analysis repeats that split as a rolling procedure, optimising on one window, applying the result unchanged to the next, and stitching the out-of-sample segments into one record, which matters in rates because the regime of 2020 to 2021 and the regime of 2022 to 2023 were nothing alike. And the probability of backtest overfitting, introduced by Bailey, Borwein, López de Prado and Zhu, asks how often the configuration that looked best in-sample fails to stay above median when scored on data it was not selected on. A vendor's accuracy figure that does not say which of these tests produced it is a marketing claim, which is why this article reports none.
AI Applications and the Evidence They Need
| Application | What the model estimates | How to judge it |
|---|---|---|
| Evaluated pricing | Where an untraded bond would trade | Error against subsequent actual trades, out of sample |
| Liquidity scoring | Tradeable size, cost and time to execute | Realised execution cost versus the score's prediction |
| Dealer selection | Which counterparties will quote competitively | Fill rates and spread paid versus a simple rotation |
| Text sentiment | Direction and strength of language in statements and news | Walk-forward relationship to later yield or spread moves |
| Curve regime | Steepening or flattening state and its driver | Stability of the label and out-of-sample usefulness as a filter |
What an Individual Trader Can Do
Almost none of the institutional machinery is available to a retail account, and cash bonds are not the natural instrument for an active trader anyway. The tradeable exposures are exchange-listed: bond and Treasury exchange-traded funds, which trade like stocks, and interest-rate futures. Quant Charts data covers Cboe EDGX US equities, including ETFs, and crypto on every plan, and paid plans add forex, commodities and CME futures, so a Treasury ETF or a corporate bond ETF is chartable on any plan and rate futures on paid plans. Quant Charts does not carry cash bond quotes and does not place orders.
- Watchlist. A watchlist of Treasury, investment-grade, high-yield and inflation-protected ETFs, with the Advanced view's Price, Financials and News tabs, Group by and Sections, is the retail version of a curve monitor. The Allocation breakdown buckets ETFs separately from stocks. Charting a long-duration fund against a short-duration fund gives the slope direction the Library describes, without the true spread level.
- Sentiment. Market Sentiment Technicals from the Library aggregates oscillator, trend and structure readings on the ETF itself, which is a price-based stand-in for the text-based sentiment institutions build.
- Quant. Quant, our coding agent, writes Pine Script from a plain-language description. Describe a rule such as buying a long-duration Treasury ETF when its 50-day average turns up while the ratio of long to short duration funds is rising, inspect the Code tab, and click Run. The Backtest Summary reports net profit, trade count, win rate, max drawdown and profit factor, and commission and slippage belong in the strategy Properties. Then run the same rule walk-forward across the 2020 to 2021 and 2022 to 2023 regimes separately, because a rule that survived one and not the other is the overfitting the Library warns about.
- Journal. On every plan, the Journal groups fills into round trips and breaks results down by symbol, side, day and hold time, so ETF trades taken on a rate view can be reviewed against what the curve actually did.

Limitations
- Different market. Institutional AI in fixed income solves dealer-market problems, pricing, liquidity and counterparty selection, that do not exist for an ETF trading on an exchange. The transferable lesson is the validation discipline, not the models.
- ETFs are not bonds. A bond fund has no maturity date and no promise to return principal, and Investor.gov notes that bond funds carry credit, interest rate and prepayment risk. Their prices also reflect fund flows and equity-market hours, not just the underlying bonds.
- The curve is external data. No indicator computed on an ETF's price reproduces Treasury yields. Proxies give direction, not level.
- Percentages without tests are claims. Any accuracy, savings or improvement figure attached to an AI system should name the out-of-sample method that produced it. None of the figures previously circulated on this topic did.
Conclusion
Artificial intelligence has changed institutional bond trading because bond markets are sparse, dealer-driven and text-heavy, which is where inference from comparable examples and structured language earns its keep: evaluated prices for untraded issues, liquidity scores, dealer selection, sentiment from central bank language, and curve regime labels. None of it is magic and all of it is testable, and the Library's split, walk-forward and overfitting-probability entries are the standard any claim should meet. For an individual trader the practical route is the exchange-listed one: a watchlist of bond ETFs, a duration ratio for curve direction, a sentiment aggregate on the fund itself, and rules written and tested with Quant across more than one rate regime before any of it is traded.
FAQs
What is fixed income trading?
Buying and selling debt securities such as Treasury bills, notes and bonds, municipal bonds and corporate bonds, or funds that hold them. Bonds pay a specified interest rate and return principal at maturity, and their prices move inversely to interest rates.
How is AI used in bond trading?
Mainly for pricing bonds that have not traded recently from comparable trades, scoring liquidity, choosing which dealers to ask for quotes, extracting sentiment from central bank statements and news, and classifying the yield-curve regime. Each is a statistical estimate that has to be validated out of sample.
Can a chart indicator show the yield curve?
No. The curve needs simultaneous Treasury yields across maturities, which are external data rather than anything computable from one symbol's price. Platforms chart yield and spread tickers directly, and ratios of long- to short-duration bond ETFs track the slope's direction but not its level.
Why does this article avoid AI accuracy percentages?
Because a percentage without a test design cannot be evaluated. The Library's in-sample / out-of-sample split, walk-forward analysis and probability of backtest overfitting are the tests that give such numbers meaning, and vendor figures rarely state which was used.
Can I trade or chart bonds in Quant Charts?
Quant Charts charts US equities including bond and Treasury ETFs and crypto on every plan, and CME futures, including interest-rate futures, on paid plans. It does not carry cash bond quotes and does not place orders.
How would I test a rate-driven ETF rule with Quant?
Describe the entry, filter and exit to Quant, inspect the generated Pine Script in the Code tab, click Run, and read the Backtest Summary. Then repeat the test on separate rate regimes, such as 2020 to 2021 and 2022 to 2023, to see whether the rule survives both.
References
LuxAlgo Resources
- Yield Curve
- Feature Engineering
- Random Forest
- Neural Networks
- In-sample / Out-of-sample Split
- Walk-forward Analysis
- Probability of Backtest Overfitting
- Market Sentiment Technicals indicator
- Quant Charts docs: Data
- Quant Charts docs: Watchlist Advanced view
- Quant Charts docs: Quant strategies
External Resources
- Investor.gov (SEC): Bonds
- Investor.gov (SEC): Bonds or Fixed Income Products
- Investor.gov (SEC): Bond Funds and Income Funds
- FINRA: Bonds
- TreasuryDirect: Treasury Marketable Securities
This article is for educational purposes only and is not financial advice. Bonds, bond funds and futures carry risk, and past performance of any model or rule does not guarantee future results.
Read next