How Indicator Overlays Work on TradingView
An indicator overlay is any study drawn on the price chart itself, sharing the price scale, rather than in a separate pane below it. Moving averages, Bollinger Bands, Supertrend, pivot levels and volume profiles are overlays; RSI, MACD and stochastics are oscillators that live in their own panes because their values are not prices. The distinction sounds cosmetic, but it decides how an indicator is read, how it is configured, and how many of them a chart can carry before it stops being legible. This guide explains what overlays are and what the main families do, using the LuxAlgo Library's documentation. It then shows how they are added and adjusted on TradingView. Finally it covers how the same work is done in Quant Charts, the LuxAlgo charting and AI platform.
Overlays and Oscillators
The working difference is scale. An overlay is computed in price units, so a 20-period moving average of a $150 stock is itself a value near $150 and sits naturally among the candles. An oscillator is computed in some other unit, such as RSI's 0 to 100 scale or MACD's price-difference scale, and would be meaningless plotted against price, so it gets a pane of its own. That is also why the Library's MACD entry notes that MACD values cannot be compared across instruments: they are price-scaled without being prices. Overlays answer questions about where price is relative to some reference. Oscillators answer questions about how fast or how far price has moved. Most complete chart setups use one or two of each, and the practical skill is choosing overlays that answer different questions rather than the same one twice.
The Main Overlay Families
The Library documents each of the standard overlays as its own concept. Grouped by what they measure, the families are these.
- Moving averages. The SMA is the arithmetic mean of the last N closes, which on a steadily trending series runs roughly half its window length behind price. The EMA weights recent bars more heavily with a smoothing factor of 2 divided by length plus 1, so it turns sooner at the cost of more noise. Their crossovers are among the oldest objective trend signals, and the Library's Moving Average Crossovers entry is direct about the cost: in a range the averages braid and whipsaw.
- Volatility bands. Bollinger Bands sit two standard deviations around a 20-period SMA and widen or tighten with dispersion; a band tag is information, not a signal. Keltner Channels use an EMA midline with bands a multiple, commonly 1.5 to 2, of average true range away, so their width follows realised range rather than standard deviation. Donchian Channels contain no averaging at all: the upper band is simply the highest high of the last N bars, the level price must exceed to print a new N-period high.
- Trailing stops. Supertrend builds bands a fixed multiple of ATR from the bar midpoint and ratchets them toward price until a close through the band flips the state. Wilder's Parabolic SAR plots one dot per bar that accelerates toward price as the trend extends. Both draw a single stop-and-reverse level on the chart.
- Levels. Pivot points project support and resistance from the prior period's high, low and close before the session opens. Anchored VWAP accumulates typical price times volume from a bar the trader chooses, such as an earnings release or a swing low, to show the average price paid since that event.
- Volume by price. A volume profile turns the volume pane sideways, binning traded volume by price level over a chosen window so that the levels where the most business was done stand out as a silhouette beside the candles.
| Family | What it plots | What it answers |
|---|---|---|
| Moving averages | Smoothed price | Where is price relative to its recent mean, and is the mean rising or falling? |
| Volatility bands | Envelope around an average | Is price stretched relative to its own recent dispersion or range? |
| Trailing stops | One ratcheting level | Which side of the trend is price on, and where would that read flip? |
| Levels | Horizontal or anchored references | Where did the market previously agree on value, and at what price did participants get in? |
| Volume by price | Histogram beside the candles | At which prices was the most volume actually transacted? |
Adding and Adjusting Overlays on TradingView
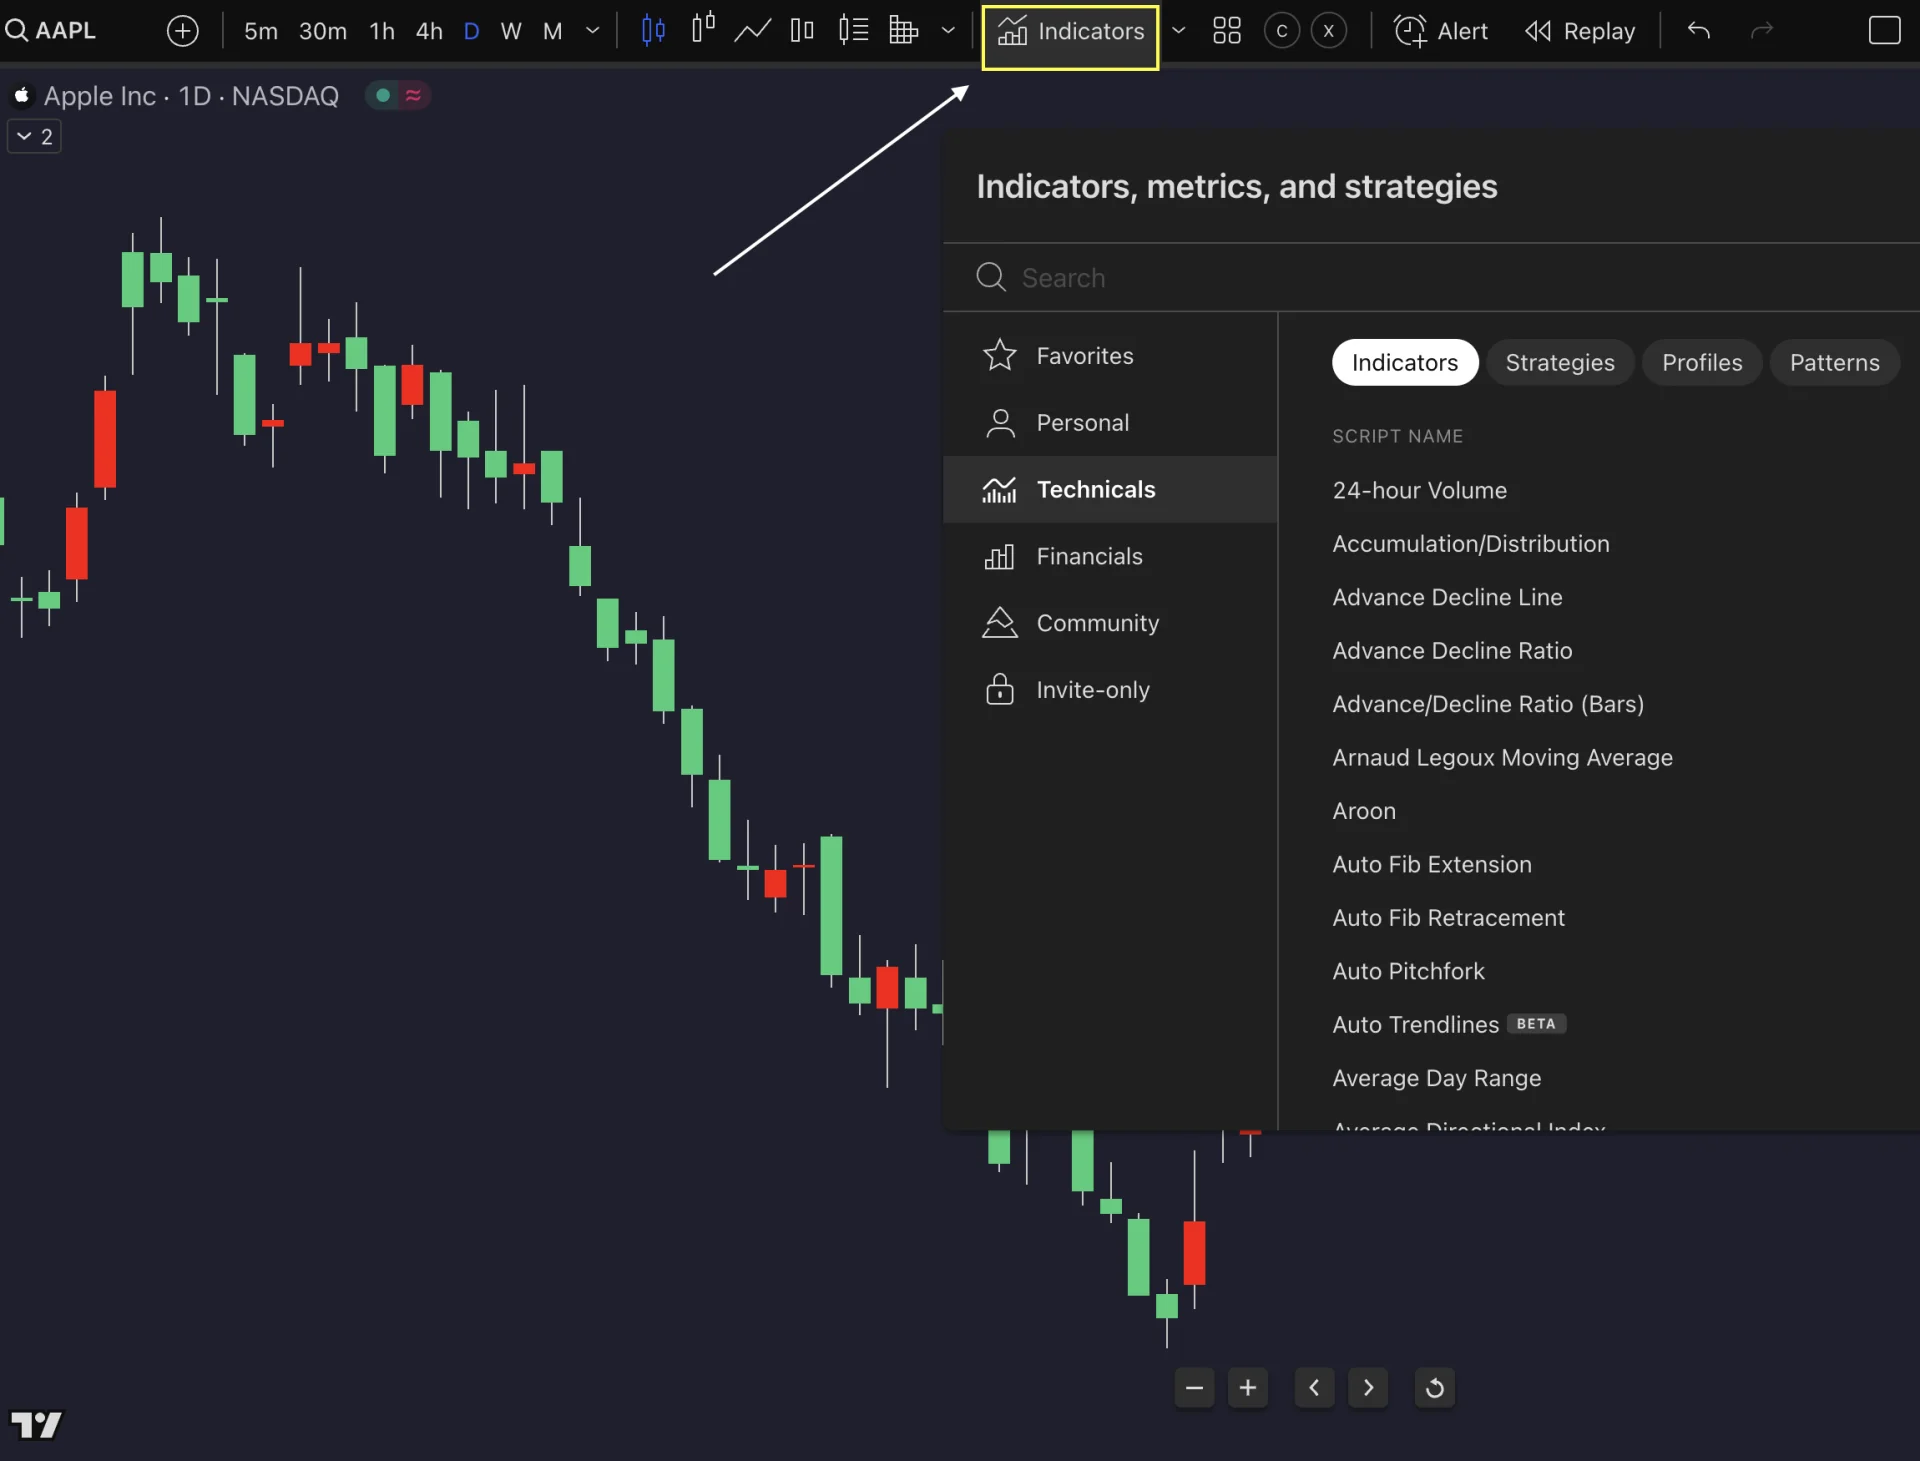
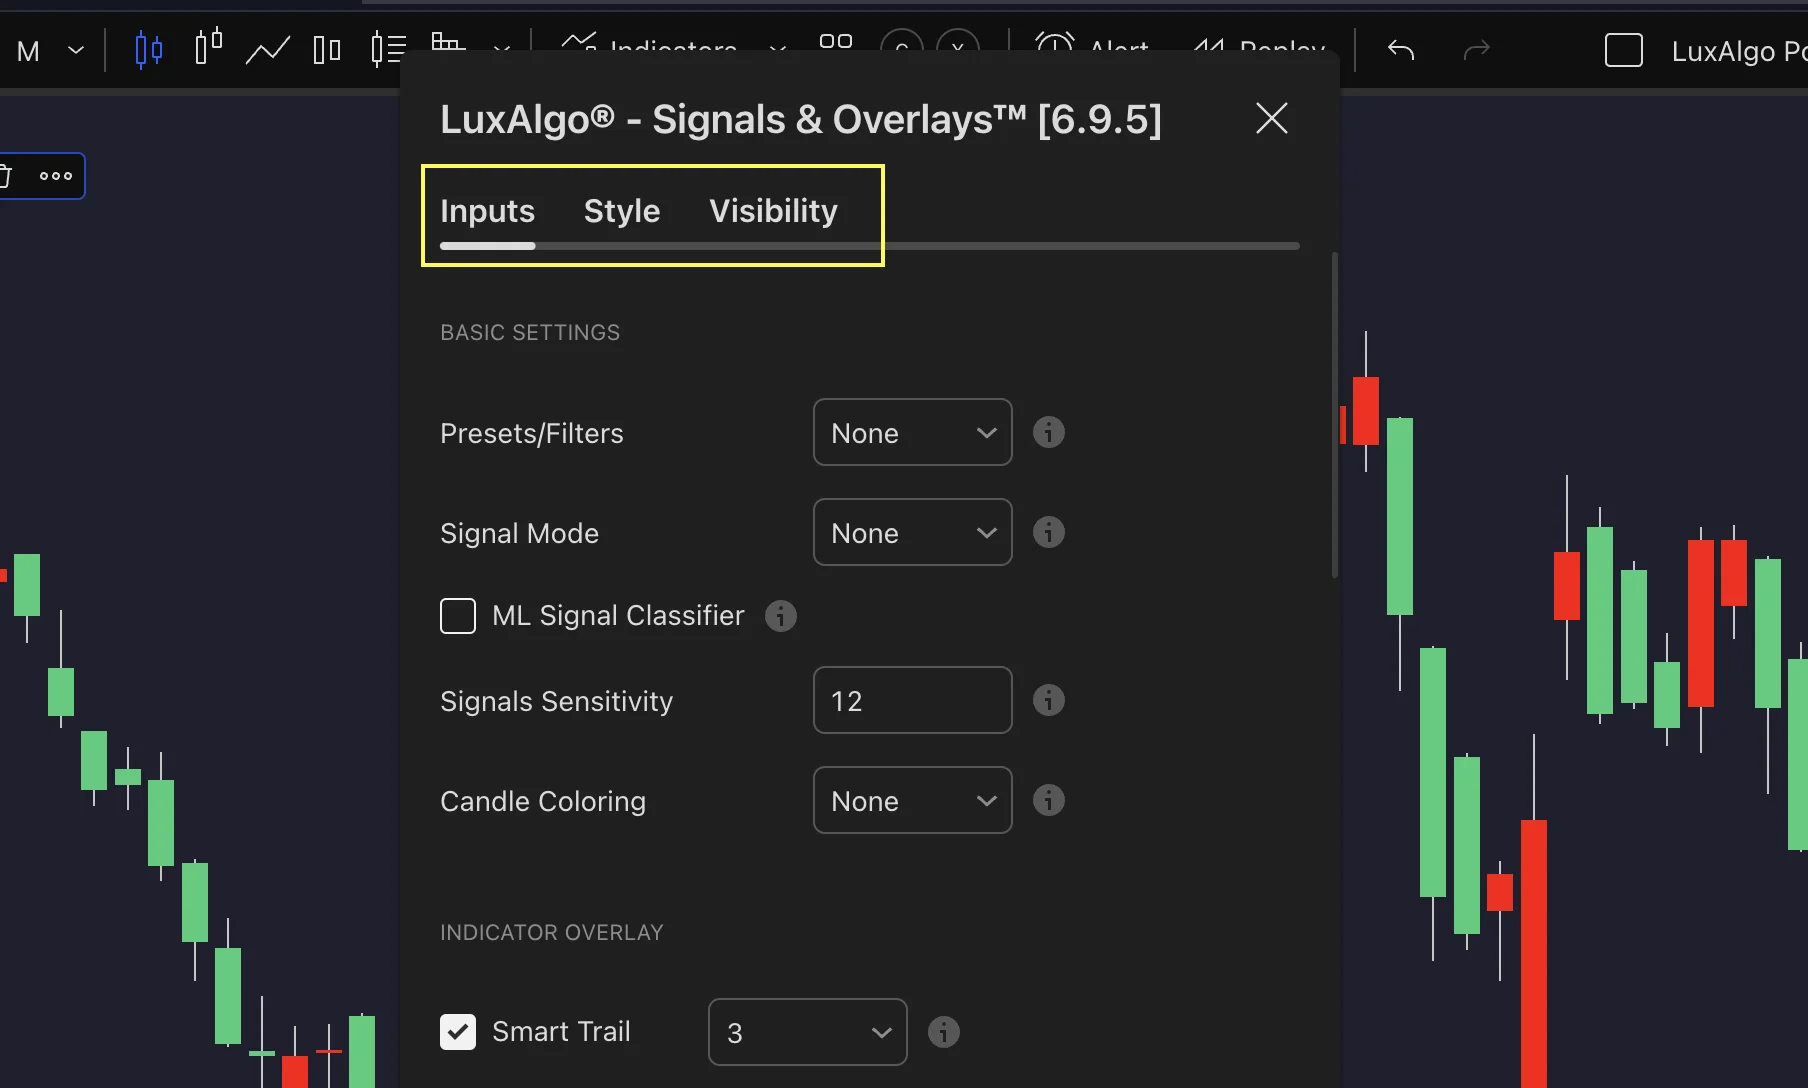
On TradingView, indicators are added from the Indicators dialog in the chart toolbar, where built-in studies and community scripts are searched by name. An overlay plots on the main price chart; an oscillator opens a new pane. Once an indicator is on the chart, its settings open from the gear on its legend entry or by double-clicking the plot, and they are organised into inputs, which change the calculation such as a length or a source, style, which changes colours, line widths and which plots are visible, and visibility, which restricts the study to chosen timeframes.
Whether a Pine Script study is an overlay or a pane indicator is set in its declaration. The indicator() function's overlay parameter is a boolean: true plots the study on the main chart, false, the default, gives it a separate pane. A minimal custom moving average therefore declares indicator("Custom SMA", overlay=true), reads a length input, computes the average with the built-in function and plots it. TradingView's Pine Script reference documents the parameter and the plotting functions; the exact syntax varies by Pine version, so consult the reference for the version your script declares.
The Same Work in Quant Charts
Quant Charts is LuxAlgo's own charting platform, and its indicator system is documented in the Indicators page of the Quant Charts docs. The mechanics are the same as any charting platform, with a few differences worth knowing.
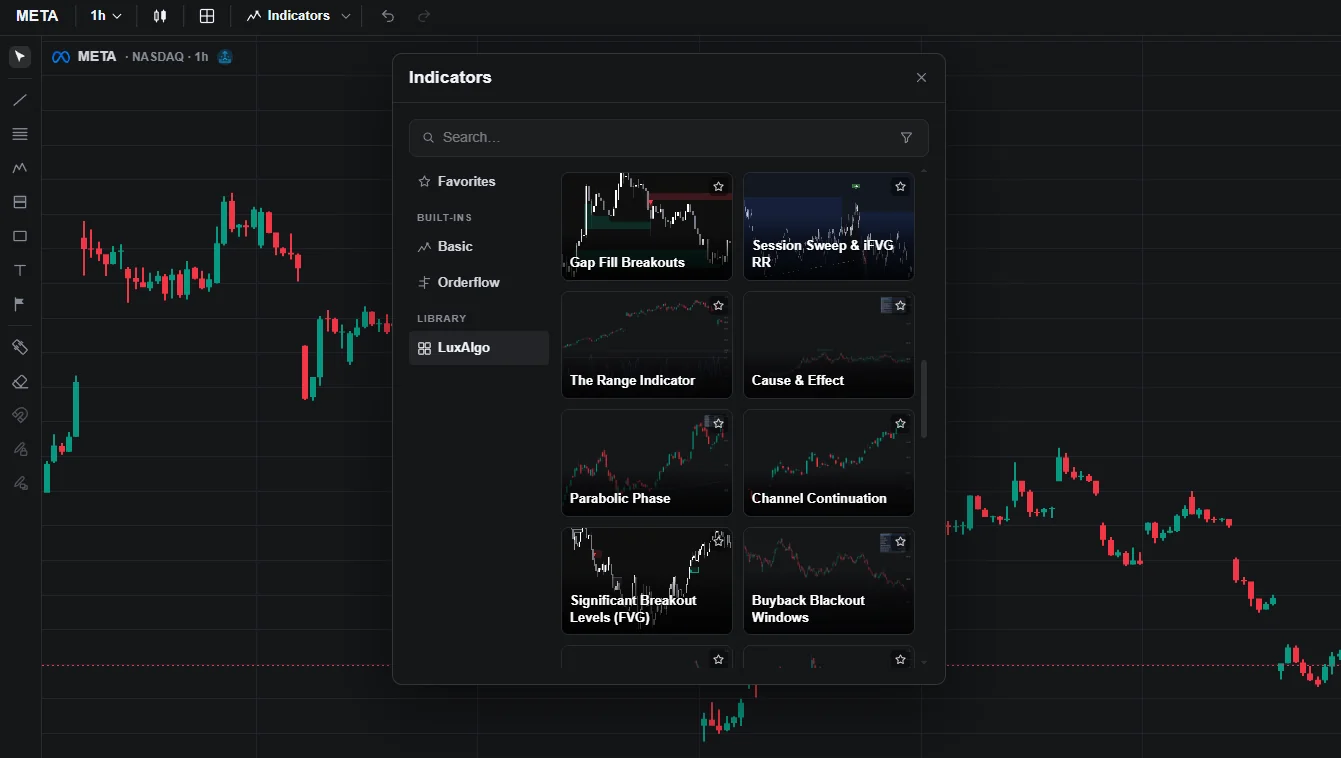
- One picker, four groups. Clicking Indicators in the chart topbar opens a picker grouped by source: Favorites, Basic studies such as RSI, MACD, Bollinger Bands and moving averages, Orderflow tools built on footprint data, and the LuxAlgo Library, which is native to the picker. Depending on the study it renders either as an overlay on the price candles or in its own pane below. A funnel on the search row filters the Library by concept.
- Favorites. Any indicator can be starred from the picker row, from its legend on the chart, or from the Code panel header, and starred studies appear in the Favorites tab and in a chevron next to Indicators that adds one back onto the chart without opening the menu. Favorites follow your account.
- Templates. An indicator template is a saved snapshot of everything on a chart with the exact settings each study had. Templates belong to the account rather than the workspace, loading one replaces the indicators on the chart rather than stacking, and in a multi-chart layout you choose whether to apply it to the selected chart or all charts.
- Configuring and untangling. Settings open from the gear on the legend or through the Object tree, which can also hide, lock, duplicate and reorder indicators. Duplicating is how to run the same overlay with two settings, and reordering decides what draws on top. The Data window shows the exact value of every plot under the crosshair, which is the fix when several overlays overlap and you cannot tell which line is which.
- Layouts and sync. The Layout control sets how many charts share the workspace, from a single chart to a 4 by 2 grid, and Sync can link symbol, interval and crosshair across cells. Indicators always apply to the active cell, so in a multi-chart layout click the cell you want before adding one.
- Plan limits. The Free plan allows 5 indicators per chart plus one Quant script and the volume pane, and one saved template; paid plans are unlimited. Charts per layout are 1 on Free, 8 on Premium, 12 on Ultimate and 16 on Ultra.
Custom Overlays with Quant
Quant, our coding agent, writes Pine Script from a plain-language description, so a custom overlay does not require writing the declaration by hand. The Making indicators page describes the flow: tell Quant what you want and where it should render, as an overlay on the price candles or in its own pane, along with any colours, line styles or conditions; Quant plots the result on the active chart and marks it in the legend; inspect the Code tab to read the generated Pine Script, then click Run. The docs recommend one change per message when iterating. Every Library indicator can also be customised on the spot the same way, by describing the change in plain language, and Quant can generate a study from a screenshot. A Quant script does not count toward the Free plan's 5-indicators-per-chart limit, and a script generated in a workspace is saved with it. To test an overlay-based rule rather than just draw it, describe the entry and exit, inspect the Code, click Run, and read the Backtest Summary: net profit, trade count, win rate, max drawdown and profit factor, with commission and slippage set in the strategy Properties.
Keeping Overlays Readable
The failure mode of overlays is redundancy rather than quantity. Three moving averages of different lengths, a Bollinger midline and a Keltner midline are five lines answering one question, and they will agree with each other in a trend and disagree noisily in a range for the reason the Library's crossover entry gives. A more informative chart pairs overlays from different families: one trend reference such as an EMA or Supertrend, one volatility envelope, and one set of levels such as anchored VWAP or a volume profile. Colour the primary reference solidly and the supporting overlays with transparency, save the arrangement as a template so it is one click to restore, and use the Data window rather than eyesight when two plots run close together. The Library's Higher-timeframe Trend Filter entry adds the one overlay-related caution that most affects results: a higher-timeframe value drawn on a lower-timeframe chart is only final when its bar closes, and reading the live bar repaints.
Limitations
- Overlays describe, they do not predict. Every overlay is a transformation of past prices or volume. A band tag, a crossover or a level touch is information about where price is, not a forecast of where it goes.
- Scale hides disagreement. Because overlays share the price scale, two studies can look aligned while their underlying calculations differ materially. The Data window, not the picture, settles what each one says.
- Platform details change. Menu names, plan limits and Pine syntax are documented by each platform and revised over time. The Quant Charts docs and TradingView's Pine reference are the current sources; this article summarises them as of its update.
- No overlay places trades. Quant Charts does not place orders. Overlays and Quant strategies inform and test decisions that the trader executes.
Conclusion
Overlays are the studies that live on the price scale, and that single fact explains how they work: they show where price stands relative to a reference, whether that reference is a smoothed mean, a volatility envelope, a ratcheting stop, a projected level or the distribution of traded volume. On TradingView they are added from the Indicators dialog and, for custom scripts, declared with the overlay parameter in Pine Script. In Quant Charts the same studies come from one picker that includes the LuxAlgo Library natively, are saved as templates, untangled with the Object tree and Data window, and can be written or modified by Quant from a plain-language description. Whichever platform, choose overlays that answer different questions, and confirm what each is saying with its value rather than its appearance.
FAQs
What is an indicator overlay?
A study drawn on the price chart and sharing its scale, such as a moving average, Bollinger Bands, Supertrend, pivot levels or a volume profile. Oscillators such as RSI and MACD use different units and are drawn in separate panes.
How do I add an overlay on TradingView?
Open the Indicators dialog from the chart toolbar, search the study by name and select it. Overlays plot on the main chart. Settings open from the gear on the legend and are grouped into inputs, style and visibility.
What does overlay=true mean in Pine Script?
It is the parameter in the indicator declaration that tells TradingView to draw the script on the main price chart. With the default of false the script gets its own pane. Consult the Pine Script reference for the version your script declares.
How many indicators can I add per chart in Quant Charts?
On the Free plan, 5 indicators per chart plus one Quant script and the volume pane, with one saved template. Premium, Ultimate and Ultra plans are unlimited, and charts per layout rise from 1 on Free to 8, 12 and 16.
Can Quant build a custom overlay for me?
Yes. Describe the study and say it should render as an overlay, and Quant writes the Pine Script, plots it on the active chart and shows the code in the Code tab for you to run or edit. Quant can also modify any Library indicator the same way.
References
LuxAlgo Resources
- SMA
- EMA
- Moving Average Crossovers
- Bollinger Bands
- Keltner Channels
- Donchian Channels
- Supertrend
- Parabolic SAR
- Pivot Points
- Anchored VWAP
- Volume Profile
- Higher-timeframe Trend Filter
- Quant Charts docs: Indicators
- Quant Charts docs: Charts overview and layouts
- Quant Charts docs: Making indicators with Quant
External Resources
- TradingView: Pine Script reference (indicator() and its overlay parameter)
- TradingView: Pine Script documentation
This article is for educational purposes only and is not financial advice. Platform features and limits are as documented at the time of writing and may change.
Read next