How Timeframes Impact Stochastic Oscillator Settings
A stochastic setting counts bars, so changing the chart timeframe changes the information behind the same numbers. A 14-bar lookback on a one-minute chart is not equivalent to a 14-bar lookback on an hourly chart. Neither automatically provides better signals.
Use LuxAlgo’s native charts and Quant, our coding agent, to inspect the difference and test a clearly defined strategy. Separate changes to the chart interval from changes to the indicator inputs so you can understand what affected the result.
Timeframe and Lookback Are Different Controls
The chart interval determines how prices are grouped into candles. The stochastic range lookback determines how many candles contribute to its high–low comparison. Additional smoothing affects the displayed %K and %D lines.
| Chart interval | Range lookback | Nominal observation window |
|---|---|---|
| 1 minute | 14 bars | 14 minutes |
| 5 minutes | 14 bars | 70 minutes |
| 1 hour | 14 bars | 14 hourly bars |
| 1 day | 14 bars | 14 daily bars |
These are nominal windows for full bars. Session breaks, missing bars and partial sessions affect elapsed clock time. Smoothing also extends the data dependence beyond the raw range calculation. Fourteen trading days, for example, are not necessarily fourteen calendar days.
Scaling the lookback to cover a similar elapsed period does not make two chart intervals equivalent. Aggregation changes the sequence of closes and the way smoothing operates. Signals can differ even when the overall high–low window looks similar.
Record the Inputs by Name
TradingView’s stochastic documentation distinguishes the range period, %K smoothing and %D period. Its documented calculation smooths the close’s position within the recent high–low range, then averages %K to produce %D.
Write those names alongside the values. A tuple such as 14,3,3 is less informative than explicitly recording all three inputs and the smoothing method. Different implementations can order their controls differently.
Shorter lookbacks and less smoothing can make an oscillator react more readily, but that does not necessarily reduce noise or improve net results. Defaults are useful baselines, not automatically incorrect settings. There is no universal 4:1 ratio or configuration that works best on every timeframe.
Example Settings to Test by Timeframe
The configurations below preserve practical starting points for comparison, not verified recommendations or best-performing settings. The columns explicitly name each input; confirm how your indicator implements smoothing before using them.
| Chart interval | Range lookback | %K smoothing | %D period | Comparison purpose |
|---|---|---|---|---|
| 1–5 minutes | 5 or 9 | 3 | 3 | Compare shorter lookbacks with a 14-bar baseline after costs |
| 15–30 minutes | 14 | 3 | 3 | Establish a baseline for intraday testing |
| 1–4 hours | 14 or 21 | 3 or 5 | 3 or 5 | Test lookback and smoothing separately |
| Daily | 14 or 21 | 3 or 5 | 3 or 5 | Compare slower decisions and their holding periods |
A 5-bar configuration is not inherently suitable for high volatility, nor is a 21-bar configuration inherently safer. More smoothing can suppress short fluctuations while delaying changes in the displayed oscillator. Let the written entry and exit rules, execution costs and separate evaluation period determine whether a candidate is useful.
Compare Timeframes with a Controlled Test
| Experiment | Keep fixed | Change |
|---|---|---|
| Chart-interval comparison | Named parameters and the written trading logic | The interval, while checking that the logic still has the intended meaning |
| Lookback comparison | Interval, smoothing, entries and exits | Range lookback |
| Smoothing comparison | Interval, lookback and trading rules | One smoothing input |
| Context-filter comparison | Base strategy and costs | A precisely defined higher-timeframe condition |
Compare trade count, average trade after costs, drawdown and individual entries, not just win rate. A faster chart may generate more opportunities but also more spread, commission and slippage costs. A slower chart can change stop distances and position size.
Do not change several settings and then attribute the outcome entirely to the timeframe. Keep a record of each trial and reserve another period for evaluating the selected rule.
Use Higher-Timeframe Information Without Looking Ahead
A daily context filter and an intraday trigger can form a coherent strategy if their timing is explicit. Use only the higher-timeframe information available at the decision time. The final value of a daily candle is not known during that session.
For example, a research rule could use the most recently completed daily stochastic reading as a filter for a completed 15-minute crossover. Specify the filter threshold, exact crossover, entry timing and exits before testing. A daily reading above 50 is an oscillator condition, not proof of an uptrend.
Decide how conflicting signals are handled. Higher-timeframe information is not automatically more correct; it describes a different aggregation. A strategy might skip conflicting setups or assign each timeframe a distinct role, but that policy must be defined before examining the results.
Build and Review the Comparison with Quant
- Specify the market, interval, stochastic implementation and named settings.
- Define the completed-bar trigger, entry timing, exits, position sizing and any higher-timeframe filter.
- Ask Quant to identify missing assumptions, then review the generated code and plotted events.
- Set realistic commission and slippage assumptions and inspect the simulated trades.
- Compare limited variants and evaluate the chosen rule on data not used to select it.
Quant helps implement and inspect a strategy; it does not automatically optimize every stochastic indicator as volatility changes. A historical backtest also does not guarantee robustness or deploy broker execution. Paper trading can help evaluate the workflow while still differing from live fills.
Multi-Length Stochastic Average Is a Separate Construction
The Multi-Length Stochastic Average averages stochastic calculations from length 4 through a selected maximum. Its pre- and post-smoothing controls change that output. It does not automatically choose the best chart timeframe or guarantee more accurate divergences.
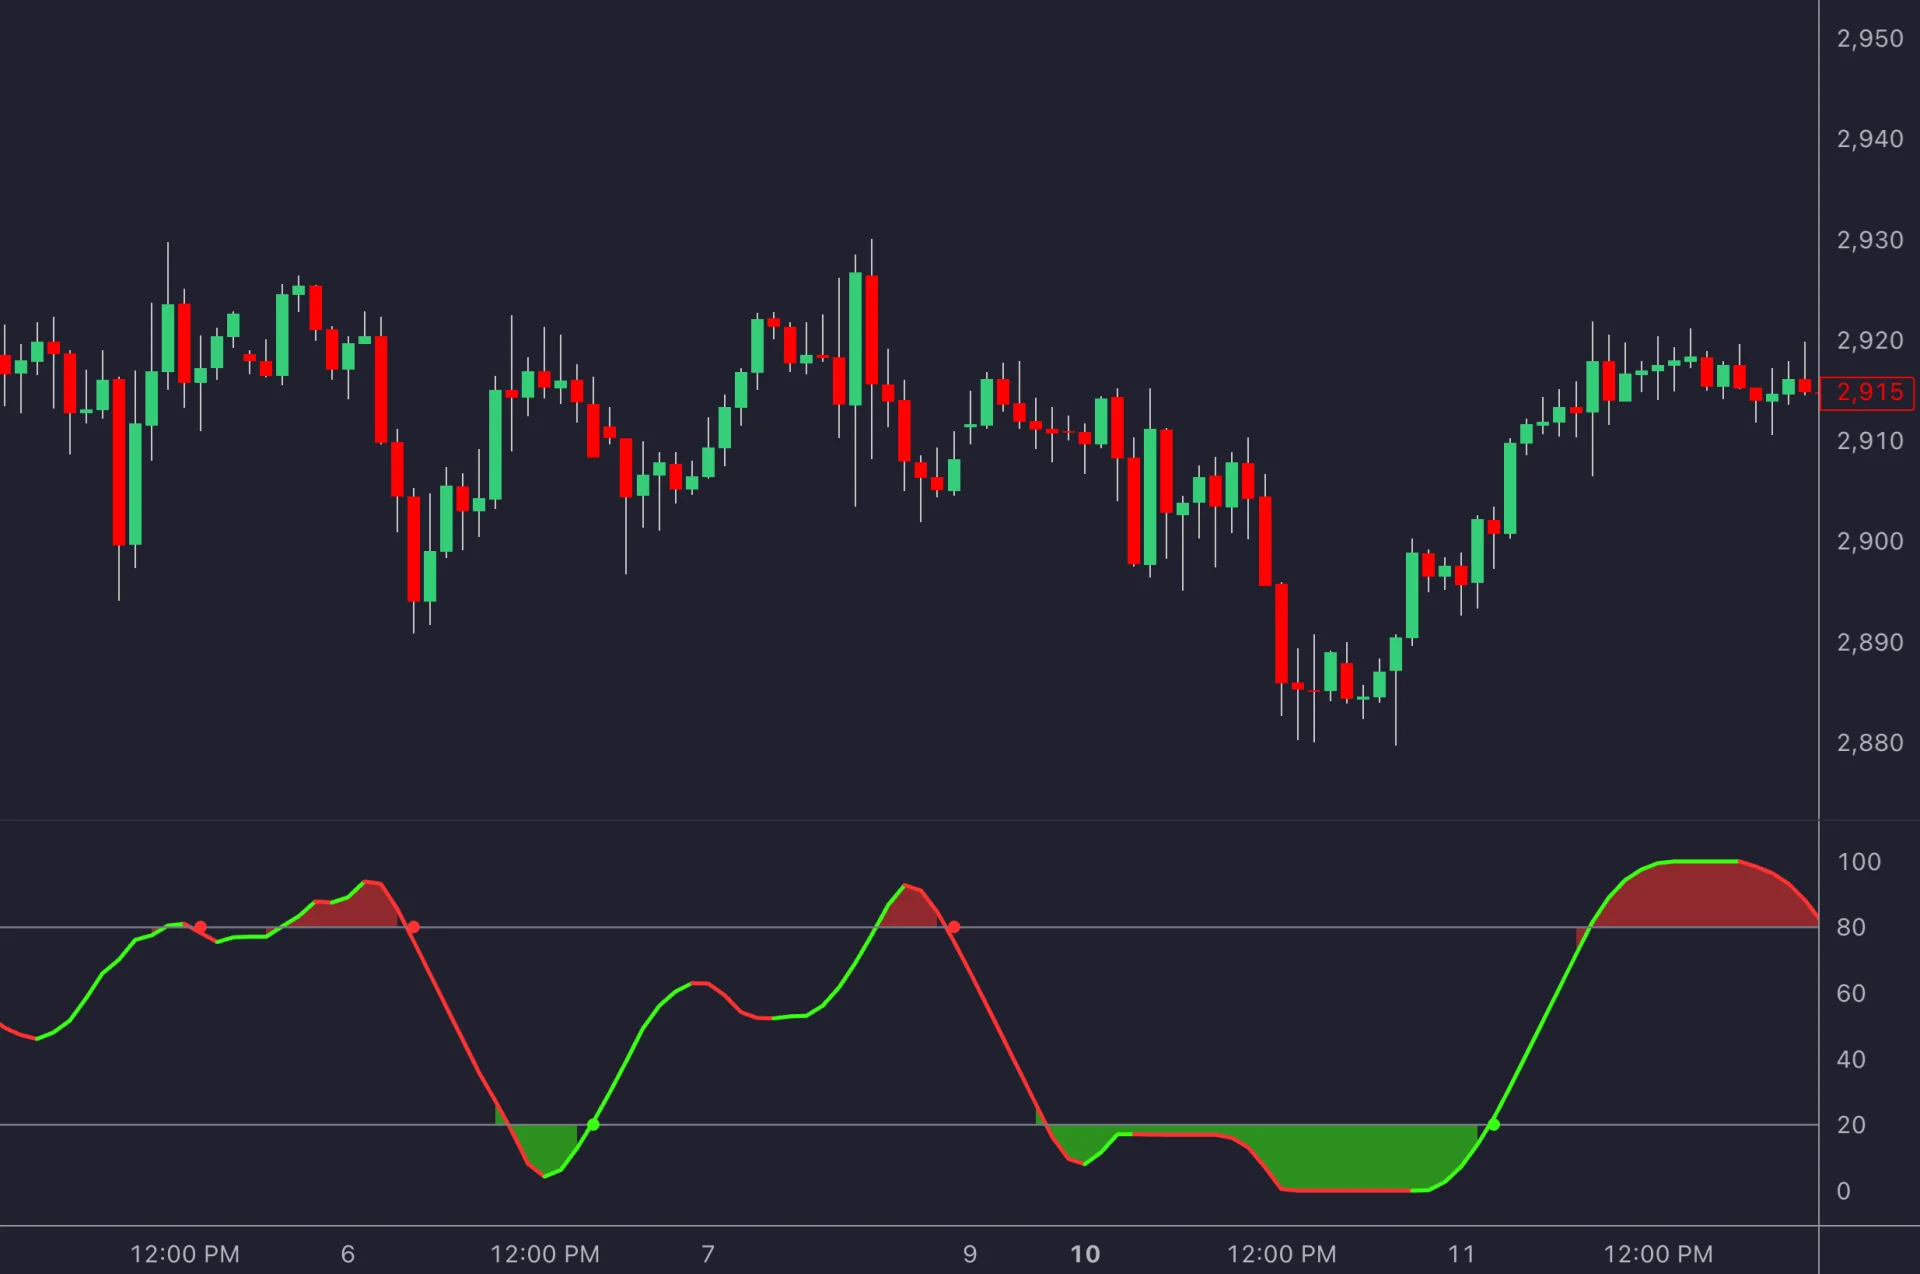
Use the LuxAlgo Journal for recorded trades and notes, and retain a separate log of tested configurations. Choose a timeframe that fits the strategy and your ability to follow it, supported by evaluation rather than a universal settings table.
FAQs
What is the best timeframe for the stochastic oscillator?
There is no universally best timeframe. The interval changes the bars and observation window behind the oscillator. Compare clearly defined strategies with realistic costs, keep parameter changes documented, and evaluate the selected approach on a separate period. Use only higher-timeframe information that was available when each decision was made.
Read next