How to Adjust Stochastic Settings for Scalping Success

Adjust stochastic settings by testing the trade-off between responsiveness, smoothing and trading costs—not by assuming the fastest setting is best. A shorter lookback can react to smaller price changes, but it can also create more signals that fail to develop into useful trades. There is no universally best stochastic configuration for scalping.
Use LuxAlgo’s native charts and Quant, our coding agent, to turn a clearly defined stochastic idea into a strategy you can review and test. Keep the entry and exit rules fixed while comparing settings so you can identify what actually changed.
Understand the Three Settings First
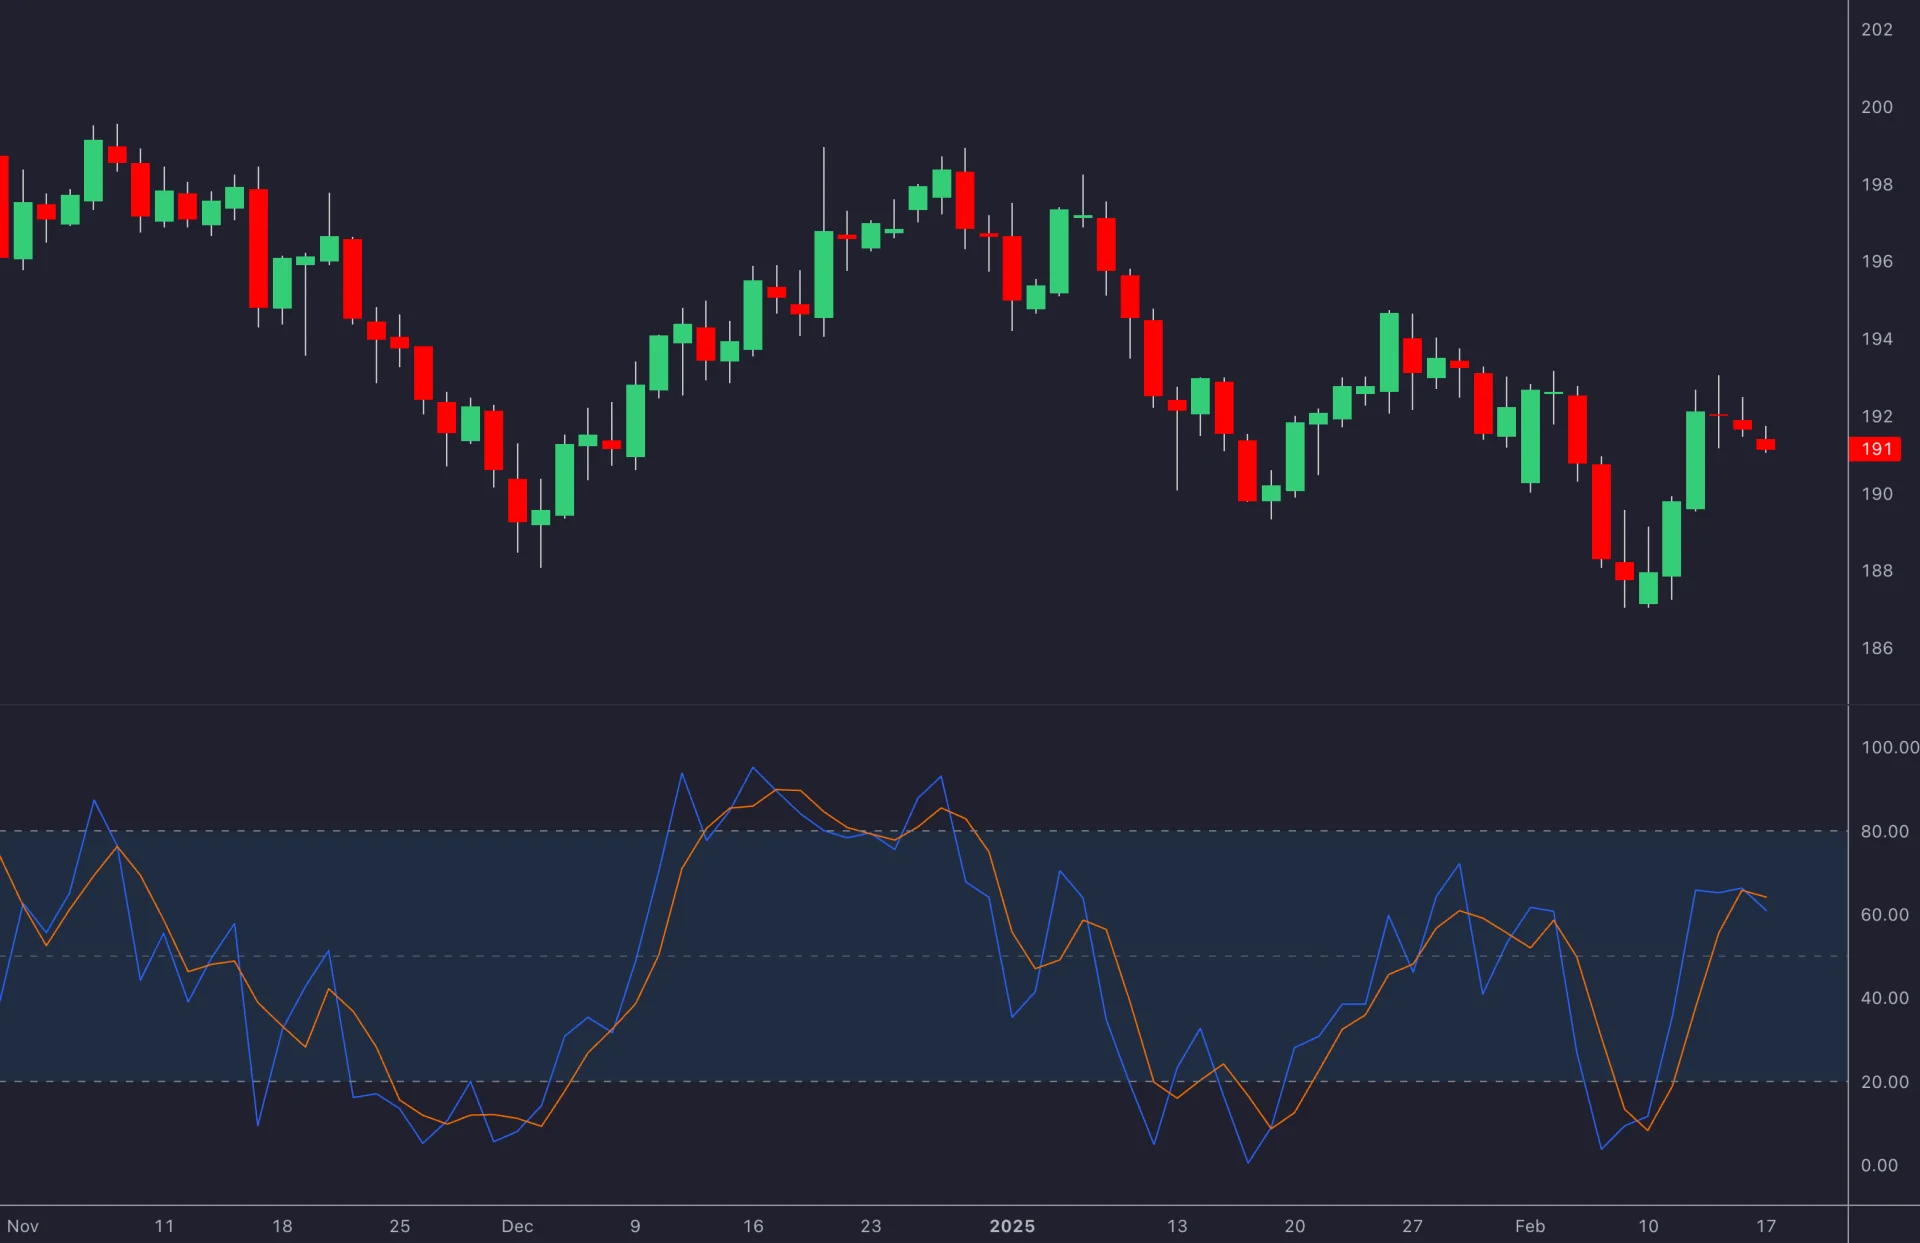
The stochastic oscillator locates the close within a recent high–low range. A common calculation starts with 100 × (close − lowest low) ÷ (highest high − lowest low), smooths that value into %K, and then smooths %K into %D. TradingView’s documented implementation uses simple moving averages for the smoothing steps.
Record the input names as well as the numbers. Different implementations can order their settings differently, so “9,3,1” is ambiguous unless you identify which number controls each step. Also define how a custom implementation handles a zero high–low range.
| Input | What it controls | What to test |
|---|---|---|
| Range lookback | Bars used to find the highest high and lowest low | Whether a shorter range adds useful responsiveness or excessive noise |
| %K smoothing | Smoothing applied to the raw oscillator | How smoothing changes the timing and number of crossings |
| %D length | Smoothing of the %K line | How the comparison line affects a defined crossover rule |
Stochastic and Stochastic RSI are different indicators: the former uses price’s position within a high–low range, while the latter applies a stochastic calculation to RSI values. Confirm that the indicator on your chart matches the strategy you intend to test.
Compare Configurations Without Calling One the Best
The following are illustrative configurations for a controlled comparison. They are not validated recommendations for a particular instrument, session or chart timeframe.
| Test configuration | Range lookback | %K smoothing | %D length | Purpose |
|---|---|---|---|---|
| Baseline | 14 | 3 | 3 | Establish a reference result |
| Shorter range | 5 | 3 | 3 | Change the lookback while retaining smoothing |
| Less-smoothed variant | 9 | 1 | 3 | Explore a shorter range with no additional %K averaging |
A 14-bar range on a one-minute chart and a 14-bar range on a five-minute chart cover different observation windows. Additional smoothing also affects the result. Do not assume that one-minute charts require one setting and five-minute charts require another.
For an initial experiment, change one input at a time. Comparing the baseline directly with the less-smoothed variant changes two inputs, so it does not isolate the contribution of either one. If you change the chart timeframe too, treat that as a separate experiment.
Choose Thresholds and Define the Trigger
Levels such as 80 and 20 describe relatively high and low oscillator readings. They do not mean price must reverse. Fidelity’s stochastic guide discusses adjustable thresholds and several signal types, including a return through a threshold and a crossover between the lines.
Those signal types should not be mixed together without an explicit rule. A %K crossing above 20, a %K crossing above %D while both are below 20, and both lines later moving above 30 are different events that can occur at different times.
- 80/20: a familiar baseline for a threshold experiment.
- 85/15: narrower extreme regions; qualifying observations may become less frequent, but that does not guarantee better trades.
- 70/30: wider extreme regions; more observations may qualify, but a complete entry rule still determines actual trades.
If you want a two-stage trigger, specify its sequence. For example, require %K to have closed below 20 within the preceding five completed bars, then cross above 30 on the current completed bar. Decide whether %D matters, how long the setup stays valid and when it resets. Do not attach an assumed percentage improvement to the rule.
Test Market Context Instead of Assuming It
Price can remain near one end of its recent range during a sustained trend. An overbought reading may accompany continued strength rather than an immediate short opportunity. Evaluate whether your rule is intended to follow trends or trade reversals before deciding how to use an extreme reading.
Session labels are not universal volatility settings. The behavior of an Asian, London or New York trading window depends on the instrument, venue, news and period studied. Record the session boundaries and time zone, then compare results for the market you actually use.
An EMA can be a separate trend filter, but substituting EMA smoothing inside the stochastic calculation creates a different implementation. Confirm that your chosen indicator supports that method, or ask Quant to implement and label the custom version explicitly. Faster reaction is not proof of better net results.
Add Filters Only When They Earn Their Place
A volume condition can be useful to test, but first identify what the feed measures. Exchange volume, tick volume and other proxies are not interchangeable. A rule requiring volume above its recent average should use a defined source, lookback and comparison point.
RSI, MACD and stochastic all derive from price, so agreement does not necessarily provide independent confirmation. Add a filter to answer a specific question and compare the filtered strategy with the original. Record changes in trade count, net results, drawdown and average trade after costs.
Divergence also needs precise timing. If a signal uses a pivot that requires later bars for confirmation, it cannot be treated as available at the earlier pivot bar. Inspect when a divergence actually becomes knowable before using it in a backtest.
Build a Reproducible Test with Quant
- Define the base rule. Specify the market, timeframe, named stochastic parameters and whether signals use completed bars. State the exact entry trigger, exit, position size and trading window.
- Ask Quant to implement it. Request that missing assumptions be identified before coding. A generated strategy must still be reviewed against the written rule.
- Inspect the chart and code. Check crossings, signal timestamps, warm-up behavior and simulated order timing. Ensure the strategy does not use future information.
- Include execution assumptions. Set realistic commission and slippage inputs and inspect individual simulated trades. Small scalping targets are especially sensitive to costs.
- Compare a limited set of variants. Keep a record of every tested configuration rather than only saving the winner. Review net profit, drawdown, profit factor, trade count and average trade.
For example, a research rule might enter long after a completed-bar %K crossover above %D with both lines below 20, then exit at a predefined stop, target or time limit. That description still needs exact sizing and fill assumptions before it becomes a complete strategy. It is a test specification, not a recommendation to trade the crossover.
Evaluate Settings on Data You Did Not Use to Select Them
Separate development from evaluation. Choose settings on an earlier period, then evaluate the frozen rule on a later period. A walk-forward process repeats that sequence using a schedule defined in advance. Combine the evaluation segments without using their outcomes to retroactively choose the settings applied to those same segments.
There is no universally correct six-month training and one-month evaluation schedule. Choose windows that provide sufficient observations for the market and strategy, and examine different conditions. Quant can assist with implementation and review, but do not assume an ordinary backtest automatically performs a complete walk-forward study.
Reserve a final period for evaluation after the development decisions are complete. Paper trading can then test the operating workflow, while recognizing that simulated fills do not reproduce every aspect of live execution.
Make ATR Adjustments Explicit
ATR measures price-range volatility; it does not prescribe the correct stochastic lookback. If you want volatility-dependent settings, define the ATR calculation, threshold, decision timing and specific configuration used in each state. Compare that rule with a fixed configuration.
Avoid changing settings during a losing sequence simply because the chart feels volatile. Dynamic rules add complexity and more opportunities to fit past data. Check whether the implementation supports changing lookbacks and how it handles transitions and warm-up requirements.
Keep a Daily Review Record
Record the strategy version, settings, session, costs and any deviations from the plan. Use the LuxAlgo Journal for recorded trades and notes, with a separate signal log for setups that never became trades.
Define risk limits and invalidation before entering. A stop placed beyond a swing can still fill worse than expected, and its distance must be reflected in position size. Evaluate settings by the whole process and net results, rather than by how attractive a few oscillator crossings look.
FAQs
What is the best stochastic setting for scalping?
There is no universal best setting. Use a named baseline, such as a 14-bar range with three-bar %K smoothing and a three-bar %D average, then test limited alternatives with the same entry, exit and cost assumptions. Select settings using development data and evaluate them on a separate period.
Should stochastic settings change when volatility rises?
Not automatically. A volatility-dependent rule needs explicit thresholds, timing and parameter choices, then a comparison with a fixed configuration. Higher volatility does not prove that either shorter or longer stochastic periods will perform better after costs.
Read next