How to Avoid Bull and Bear Traps in Trading
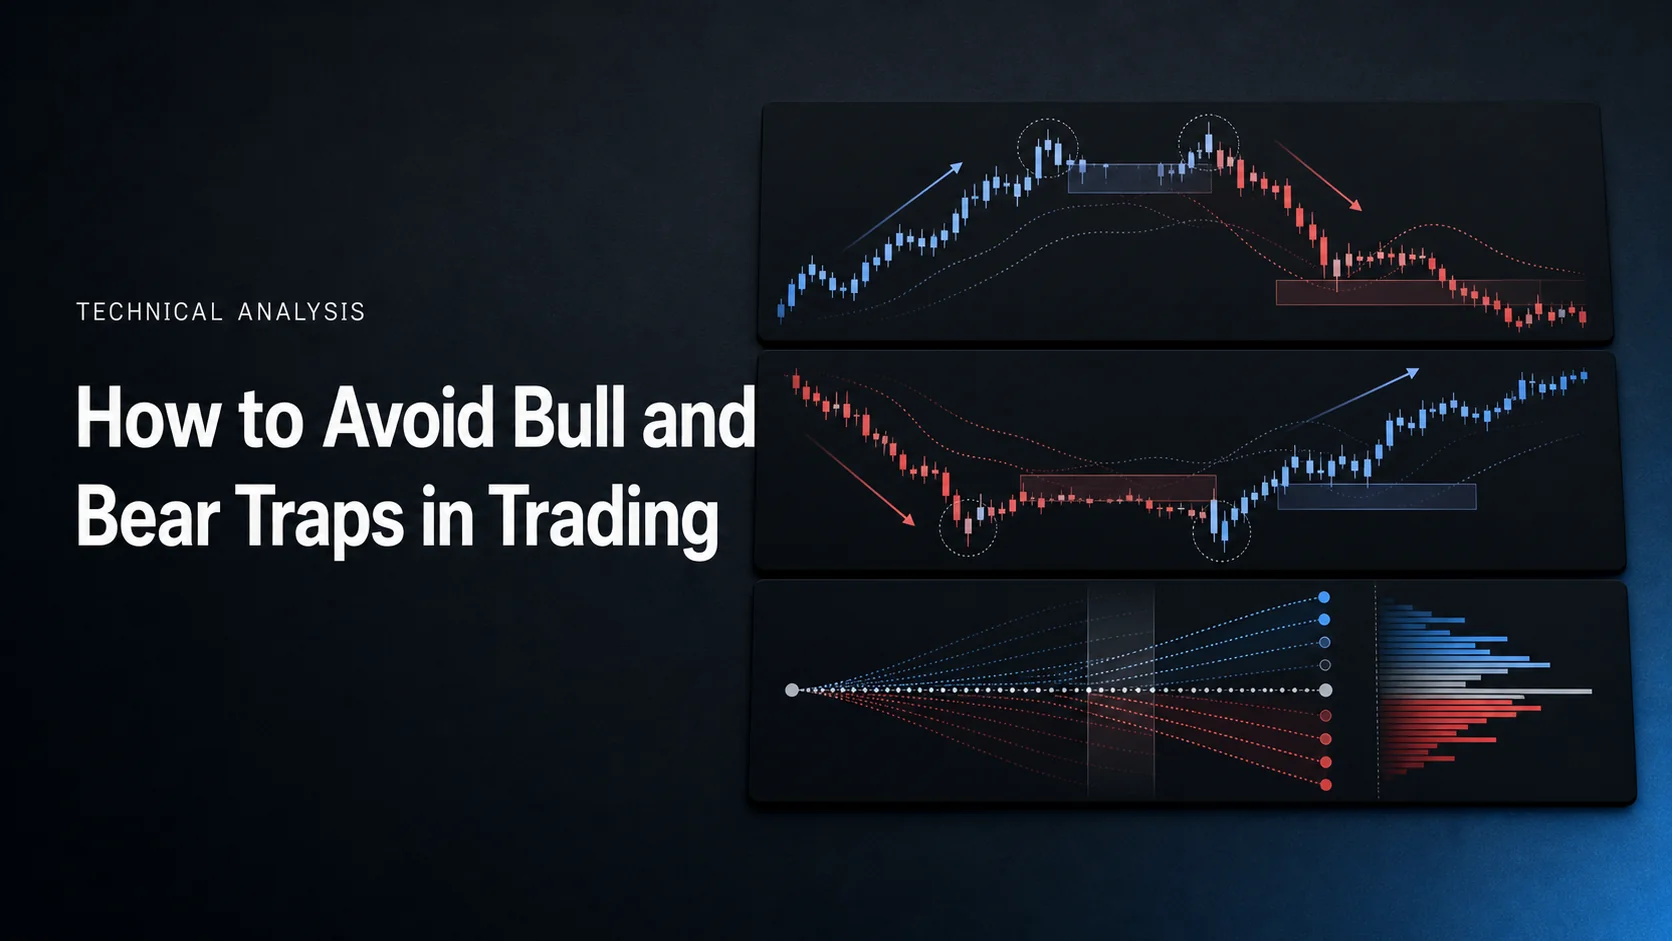
A bull trap is a failed upside breakout that leaves buyers exposed when price reverses; a bear trap is a failed downside break that leaves sellers exposed when price recovers. The important event is the failure to hold beyond a defined level. A wick, low volume, or indicator divergence alone does not prove a trap, and no method can eliminate false signals.
You can reduce impulsive entries by defining the level, the completed-candle trigger, the conditions that reject the trade, and the amount you can lose before placing an order. Start with price behavior, then use volume and momentum as additional evidence. In LuxAlgo, chart the idea first and test explicit rules with Quant rather than assuming that an indicator can identify every future trap.
- Mark the level: specify the resistance or support zone before the break.
- Define confirmation: decide whether you need a completed close, a retest, or a fixed buffer.
- Check context: compare activity with an appropriate baseline and inspect momentum and the higher time frame.
- Plan failure: choose an exit, size the trade, and account for costs and gaps.
What Is a Bull or Bear Trap?
This Krown tutorial explains the difference through chart examples. Treat its commentary as an educational interpretation: a failed breakout does not, by itself, prove that someone deliberately engineered the move. Use the rules below to distinguish an observable failure from a prediction about what happens next.
Common Signs of Bull and Bear Traps
Bull vs Bear Trap Features
| Characteristic | Bull trap | Bear trap |
|---|---|---|
| Initial move | Price breaks above resistance | Price breaks below support |
| Failure event | Price returns beneath the broken resistance | Price recovers above the broken support |
| Exposed trader | A buyer expecting upward continuation | A short seller expecting downward continuation |
| Possible context | An uptrend, downtrend, or range | An uptrend, downtrend, or range |
| What is still uncertain | Whether the reversal will continue | Whether the recovery will continue |
For a hypothetical bull trap, resistance is 100, price trades at 102, and then closes at 99. A trader who bought the break may now be holding a loss. For a bear trap, support is 50, price trades at 48, and then closes at 51. These examples describe a failure relative to the chosen level; they do not establish an automatic opposite-direction trade.
Patterns provide context, but a rising wedge is not inherently a bull trap and a falling wedge is not inherently a bear trap. A failed cup-and-handle breakout can trap buyers; a head-and-shoulders breakdown that reverses above its neckline can trap sellers. You need the attempted break and its subsequent failure, not just the shape. See the traditional chart pattern guide for the underlying structures.
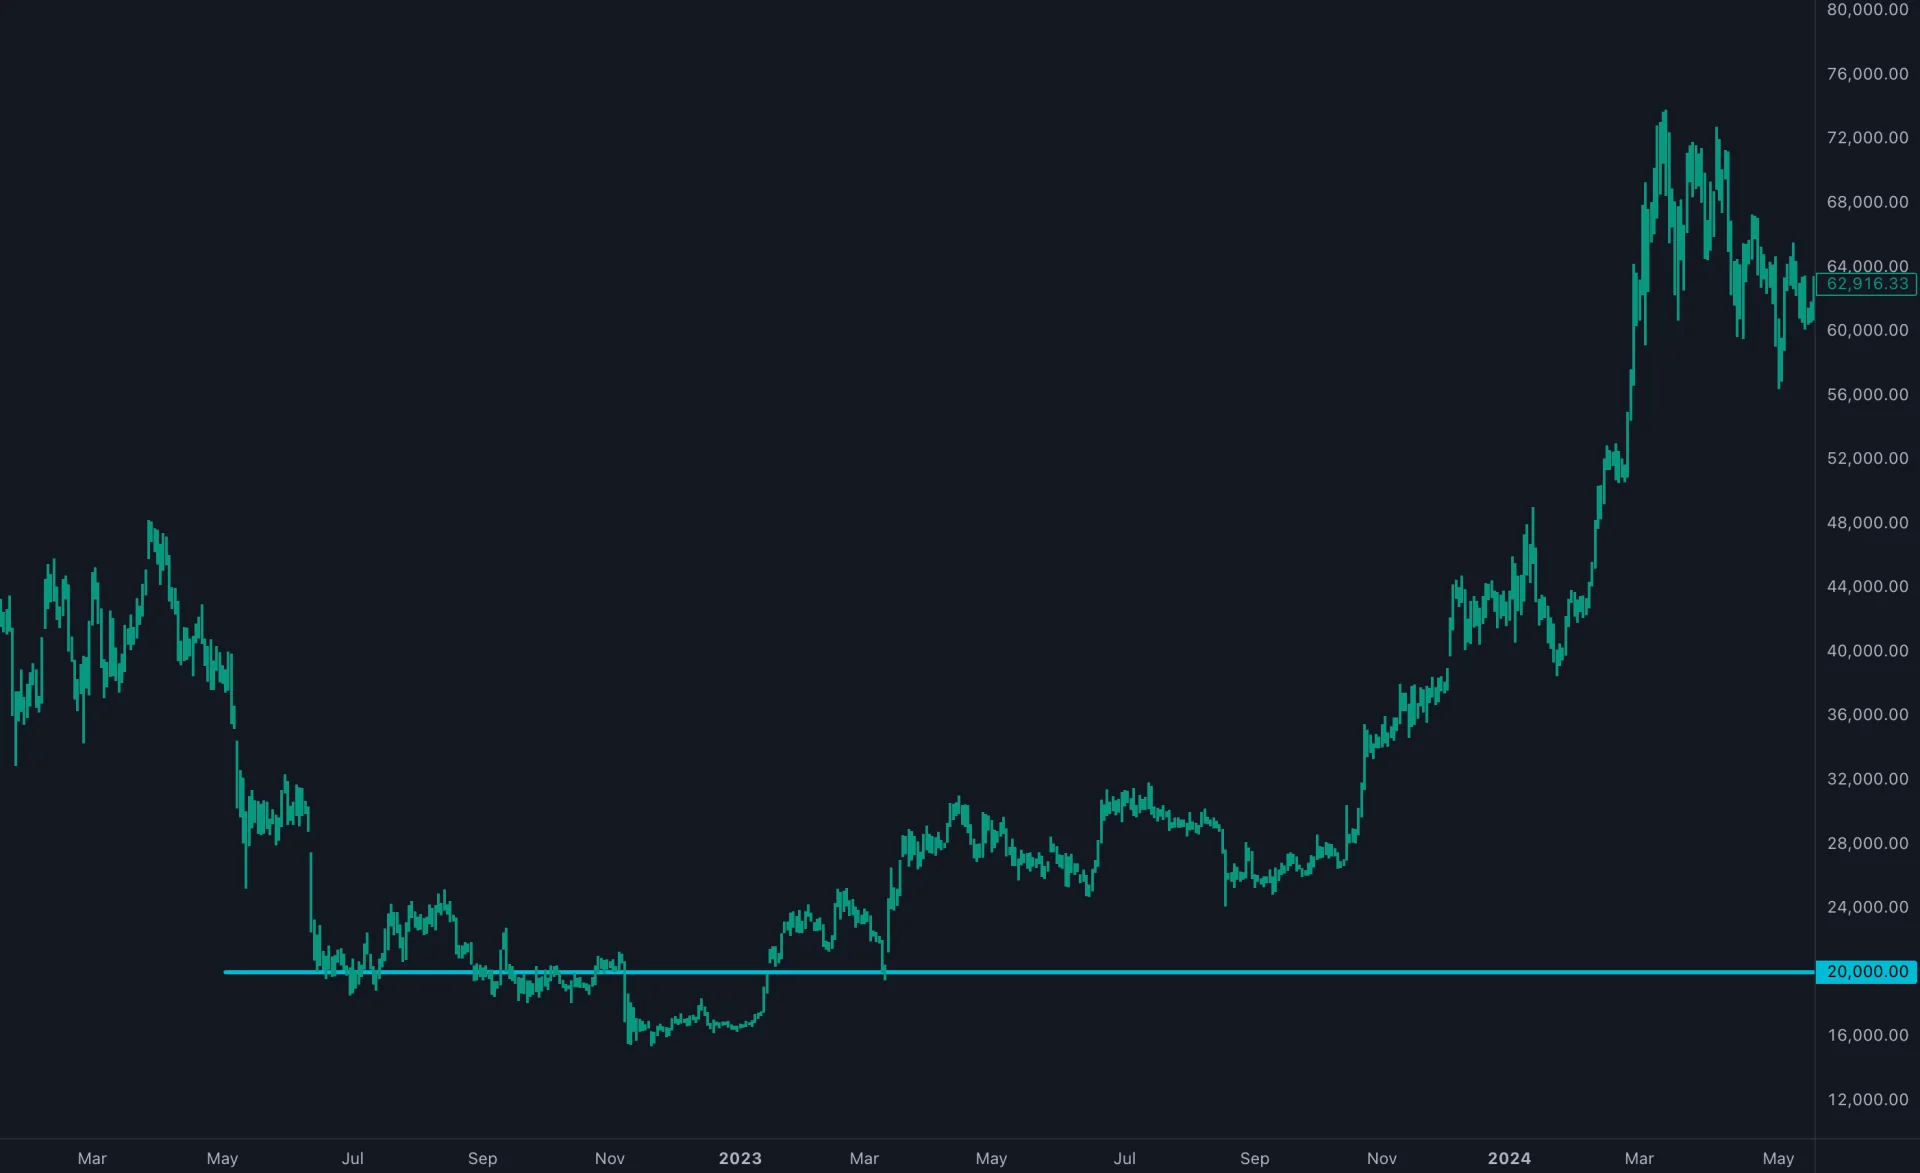
A broad historical chart can make a recovery look obvious after the fact. To assess an actual setup, isolate the relevant bars, confirm the market and feed, and write down what was known when the order would have been placed. A much later recovery does not make an earlier breakdown trade invalid on its own.
Market Psychology in False Breakouts
Fear of missing out can lead to buying an unconfirmed break; panic can lead to selling after a large decline without a plan. Confirmation bias can make a trader dismiss conflicting evidence, while crowd behavior can amplify fast moves. These are possible influences, not motives that can be established from candles alone.
Write the trigger and exit rules before the market reaches the level. Record evidence against the trade as well as evidence for it. If the entry has moved too far from the planned price, recalculate risk or skip the trade instead of chasing it. A checklist is useful only if it is specific enough to change a decision.
Tools for Spotting Trading Traps
Volume Analysis Methods
Compare breakout volume with a defined baseline, such as the preceding 20 completed bars or comparable times of day. A thinly traded break can lack follow-through, but high volume can also accompany a failed move. Neither low nor high activity determines the outcome.
For example, a completed breakout bar with 80,000 units against a 100,000-unit baseline is 20% below that baseline. A 150,000-unit bar is 50% above. These are descriptions of activity, not calibrated probabilities of success. Avoid comparing a partially formed bar with completed bars.
On-Balance Volume (OBV) accumulates volume according to the change in close: add the bar’s volume when the close rises, subtract it when the close falls, and leave the total unchanged for an equal close. It does not identify the aggressor of every transaction. If price makes a higher high while OBV does not, that divergence can motivate closer inspection. The OBV calculation reference explains this close-to-close method.
Volume Weighted Average Price (VWAP) is an average price weighted by volume over a stated window—not an average of trading volume. With prices of 100 and 102 weighted by volumes of 100 and 300, the calculation is (100 × 100 + 102 × 300) ÷ 400 = 101.5. A bar-based implementation uses its selected price source, which may differ from a transaction-level calculation.
In native LuxAlgo, VWAP offers a defined anchor and price source. Price below that average during an upside break may be context worth investigating, but it cannot label the break false. State whether the average restarts daily, weekly, monthly, or from another permitted anchor before comparing results.
Use the volume actually available from the feed. Crypto activity is venue-specific, and forex feeds may provide tick volume rather than consolidated traded quantity. Indicators built from that input inherit its limitations.
Price and Momentum Divergence
Bearish divergence pairs a higher price high with a lower high in a specified RSI or MACD series; bullish divergence pairs a lower price low with a higher indicator low. Choose comparable swings and identify whether you are using the MACD line or histogram. A divergence may persist through several new price extremes and does not provide a guaranteed reversal time.
Indicators calculated from price are not independent votes. Adding RSI, MACD, and moving averages may describe related aspects of the same move. Test whether each condition improves the original entry rule after costs. See the indicator FAQ for their different roles.
Support and Resistance Analysis
| Reference | What to define | Possible failure evidence |
|---|---|---|
| Previous swing high or low | Exact price zone, tolerance, and when the swing was confirmed | Completed close back through the zone after a break |
| Range boundary | Lookback and whether wicks or closes define the range | Return inside the range after an attempted escape |
| Moving average | Period, price source, and smoothing method | Failure to hold beyond the selected average |
| Higher-time-frame zone | Use only information available at the decision time | Lower-time-frame break stalls into that zone |
A 50-day or 200-day EMA is a dynamic reference, not a substitute for every horizontal support or resistance zone. Retests can provide additional information, but a market can move away without retesting or fail after an apparently successful retest. Define what “holding the level” means before judging the outcome.
Four Ways to Limit Trap-Related Losses
1. Choose a Trigger You Can Reproduce
Compare three methods separately: entering as price crosses the level, waiting for a completed close beyond it, or waiting for a breakout and retest. Earlier entries can capture more of a move but include more unconfirmed breaks; later entries can miss moves or worsen the available reward relative to risk. None is universally best.
Use a time frame consistent with the intended holding period. A five-minute close back inside a daily zone is not the same event as a daily close back inside it. Do not use the final value of an unfinished higher-time-frame candle to justify an earlier entry.
2. Set Stops, Position Size, and a Failure Plan
Choose a price or event that makes the trade unacceptable. An ATR buffer can account for recent volatility, but two or three ATR is a parameter to evaluate, not a mandatory safe distance. A wider stop requires a smaller position if the planned loss stays the same. A time-based exit—such as no follow-through after a stated number of bars—also needs testing; there is no universal three-candle or one-ATR rule.
For a hypothetical long entry at 101 with a stop at 99, price risk is 2 per share. If the total planned loss budget is 100 and estimated round-trip costs are 10, size is (100 − 10) ÷ 2 = 45 shares. A stop fill at 99 produces a loss of 90 plus 10 in costs. A gap fill at 98 instead produces a loss of 135 + 10 = 145. The order’s trigger is not a guaranteed execution price.
Understand order types: a stop-market order can fill beyond its trigger, while a stop-limit order can remain unfilled. Short positions also require attention to borrowing, margin, and potentially large losses if price rises. Do not widen a stop or reverse direction solely to recover a loss.
3. Use Chart Tools and Alerts for Defined Events
Start in native LuxAlgo charts. Use drawings to mark the original zone and add relevant indicators to inspect activity or momentum. Keep the decision time, chart type, feed, and time frame with the example. An alert is useful when its condition is precise; it is a prompt to review the event, not proof of a profitable trade.
Chart tools that mark liquidity trendlines, equal highs and lows, and liquidity grabs, such as the Library’s liquidity and structure tools on a Quant Chart, describe their own conditions; they do not certify that every marked event is a tradable trap. Trendlines are often drawn retrospectively, and equal highs/lows need later bars to confirm.
Check when a signal became available instead of assuming a historical label was visible on its marked candle. Keep tool alerts distinct from Strategy Alerts and from native chart research.
4. Test the Rules with Quant and Review the Failures
Quant, our coding agent, can help translate explicit rules into a native strategy script. Specify how a level is constructed, the breakout trigger, confirmation timing, entry execution, stop, time exit, size, and costs. Inspect the generated code and run it manually on the intended chart.
For example, compare an entry following a completed close above the highest high of the preceding 20 bars with a version that adds a volume requirement. Exclude the current bar from that reference. Define a return below the original breakout level as one possible failure event, and state how many later bars are observed. These are illustrative research settings, not a recommended strategy.
Use the strategy viewer to inspect the Trades Log, costs, drawdown, and sample size. Test a later period that was not used to choose settings and keep examples of false positives and missed trades. Standard candle prices are more suitable than averaged synthetic prices for evaluating executable fills.
Avoid optimizing only for the percentage of avoided traps: a filter that removes almost every entry can look selective while producing little useful opportunity. Compare net results, exposure, trade count, and drawdown against the baseline.
Key Points for Trap Prevention
- A failed break is defined relative to a level and time frame; neither a pattern name nor low volume proves it in advance.
- Volume, OBV, VWAP, RSI, and MACD answer different questions and can all give misleading signals.
- Completed-bar rules and retests trade earlier participation for additional information; they cannot eliminate losses.
- Predetermine exits and size, then include costs and adverse execution in the plan.
- Use saved chart examples and reproducible tests to evaluate rules instead of relying on universal accuracy or reversal-time statistics.
The practical objective is to make uncertain decisions consistently. Some breakouts will fail even when the setup meets every rule. A defined loss and a useful review are better evidence of a controlled process than declaring every unfavorable move a trap after it happens.
FAQs
How do you identify a bear trap?
Identify a break below a predefined support zone followed by a recovery above it under a stated time-frame rule. Volume, momentum, and retest behavior can provide context, but none guarantees that the recovery will continue.
Does low breakout volume prove a bull trap?
No. Low activity relative to an appropriate completed-bar baseline can prompt caution, but successful breaks can occur on modest volume and high-volume breaks can fail. Price behavior relative to the original level remains essential.
Is a rising or falling wedge automatically a trap?
No. A wedge describes a price structure. A trap requires an attempted break that fails under the definition being used. Evaluate the breakout and subsequent behavior separately from the pattern name.
Where should a stop go when trading a breakout?
Choose a reference that makes the trade thesis unacceptable and size the position around the resulting distance and costs. ATR buffers and time exits are settings to test, not universal safeguards. Gaps can cause losses beyond the planned amount.
Can LuxAlgo help test a trap-avoidance rule?
Yes. Use native charts to define the setup, then ask Quant to help code explicit conditions. Inspect the code and run it manually, include realistic costs, and evaluate a separate period. No tool guarantees avoidance of traps.
Read next