How to Combine Stochastic Oscillator with Key Levels

Combine the stochastic oscillator with key levels by giving each a distinct job: price levels define the location, an oscillator rule defines the trigger, and risk rules define the trade. An oversold reading near support is a setup to investigate, not a confirmed bounce.
In LuxAlgo’s native charts and Quant, our coding agent, you can mark a price zone, inspect stochastic behavior and turn an explicit setup into a strategy to test. The aim is to evaluate whether the combination improves your decisions after costs, rather than assume that several indicators agreeing makes a trade high probability.
Set Up the Oscillator and Define the Level
The stochastic oscillator describes the close’s position within a recent high–low range. In a smoothed implementation, %K is a smoothed version of that calculation and %D averages %K. TradingView documents the range period, %K smoothing and %D period separately.
| Named input | Example baseline | What it controls |
|---|---|---|
| Range lookback | 14 bars | The high–low window used in the raw calculation |
| %K smoothing | 3 bars, simple average | Smoothing of the raw oscillator |
| %D period | 3 bars, simple average | The average of the displayed %K |
This is a baseline, not a best setting for every market. Fast, slow and full stochastic refer to constructions and available controls, not simply to numerical presets such as 5,3,3 or 21,5,5. Record the implementation as well as the values.
For comparison, a day-trading test might examine a 5–10 bar lookback against 14; a swing-trading test might examine 21–28. Keep the chart interval and other inputs fixed when isolating a parameter change. Thresholds of 70/30 are less extreme than 80/20, but neither pair establishes a reversal probability. Test threshold changes separately from lookback changes.
Before looking for a trigger, define how support and resistance are identified. Examples include the prior session’s high and low, a previously confirmed swing, or the boundary of a pre-defined range. Support is an area where buying previously interrupted a decline; resistance is an area where selling interrupted an advance. Both can fail.
Specify whether a level is a single price or a zone, its width, and when it expires. A swing that needs later candles for confirmation cannot be treated as known on its original turning-point candle. Marking only the levels that worked afterward introduces hindsight into the test.
Mark Key Levels on Native LuxAlgo Charts
Use the drawing tools in the left toolbar to mark your chosen levels. A horizontal line takes one anchor; boxes can represent zones. Native drawings are anchored to time and price and saved with the workspace. Record the original level before the setup so a later edit does not change the evidence behind your decision.
Separate Location, Trigger and Invalidation
A reading below 20 is commonly called oversold; above 80 is commonly called overbought. Price can continue lower or higher while the oscillator stays extreme. A crossover near a level is another observable event, not proof that the level will hold.
| Component | Example long setup | Example short setup |
|---|---|---|
| Location | Price tests a support zone identified beforehand | Price tests a resistance zone identified beforehand |
| Oscillator condition | %K was below 20 on the preceding completed bar | %K was above 80 on the preceding completed bar |
| Completed-bar trigger | Previous %K ≤ %D; current %K > %D | Previous %K ≥ %D; current %K < %D |
| Invalidation and exit plan | Predefined stop below support; possible target before the next resistance | Predefined stop above resistance; possible target before the next support |
These are example rules to evaluate. Decide whether the crossover must also remain inside the extreme zone, whether price must close back above support or below resistance, and how close price must be to qualify as a test. Entering on the next bar differs from assuming a fill at the signal candle’s closing price.
Divergence is a separate candidate condition. Price making a higher high while the oscillator makes a lower high is bearish divergence; the opposite relationship at lows is bullish divergence. Specify the paired swings and confirmation delay. Divergence can persist while price continues in the same direction.
Trend direction, volume and higher-timeframe context can be additional filters. Define each one, use only information available at the decision time, and compare the strategy with and without it. Price-derived filters may overlap rather than provide independent evidence.
A Worked 15-Minute Trading Example
Suppose a hypothetical stock has a support zone of $99.80–$100.00, marked before the current setup, and resistance at $102.00. The 15-minute chart uses a 14-bar range lookback, 3-bar %K smoothing and 3-bar %D average.
- Price trades into the support zone without invalidating the setup’s predefined rules.
- The preceding completed bar had %K below 20. On the signal bar, %K crosses above %D and price closes back above $100.00.
- The strategy allows an entry on the next bar, subject to a maximum acceptable price. Assume an actual entry of $100.20 for this calculation.
- A planned stop at $99.70 creates $0.50 of price risk per share. A target at $101.80 offers $1.60 per share before costs, or 3.2 times that planned price risk.
- A hypothetical $50 price-risk budget permits 100 shares before costs and execution allowances. Fees, slippage, account buying power and gap risk may require a smaller size.
The target is an order level, not an expected profit, and a stop is not a guaranteed fill at $99.70. If the next bar gaps beyond the permitted entry, skip according to the rule rather than assume the original reward-to-risk relationship still applies.
The short-side version uses resistance and the opposite trigger, but borrowing, short-sale restrictions and instrument-specific costs also matter. Stocks, forex and crypto differ in sessions, spreads, liquidity and available volume data. The first two hours after an equity market opens are a session to test, not a universally best trading window or a rule that transfers directly to a continuously traded market.
Test the Combination with Quant
Ask Quant to implement your written level rule and stochastic trigger, then review the generated logic and inspect its plotted entries. Include how levels become available, how long they remain valid, the maximum entry distance and the complete exit policy. A hand-drawn chart annotation should not be assumed to become an executable strategy rule automatically.
Compare three versions under the same dates and cost assumptions: the level rule alone, the oscillator rule alone, and the combined rule. Inspect trade count, average net trade, drawdown and the individual trades. Fewer signals or a higher win rate alone does not establish an improvement.
Use realistic commission and slippage settings, then evaluate the selected configuration on another period. Quant helps build and review a test; it does not make a subjective level objective unless its definition is supplied, guarantee performance, or automatically place broker orders.
Using Multi-Length Stochastic Average Around Levels
The Multi-Length Stochastic Average averages stochastic calculations from length 4 through a selected maximum. These are multiple lookbacks on the input series, not multiple chart timeframes.
Pre-smoothing affects the source before calculation; post-smoothing affects the resulting oscillator. Available methods include simple, triangular and least-squares moving averages, plus no smoothing. Least-squares post-smoothing can overshoot, so the final output is not unconditionally confined to 0–100.
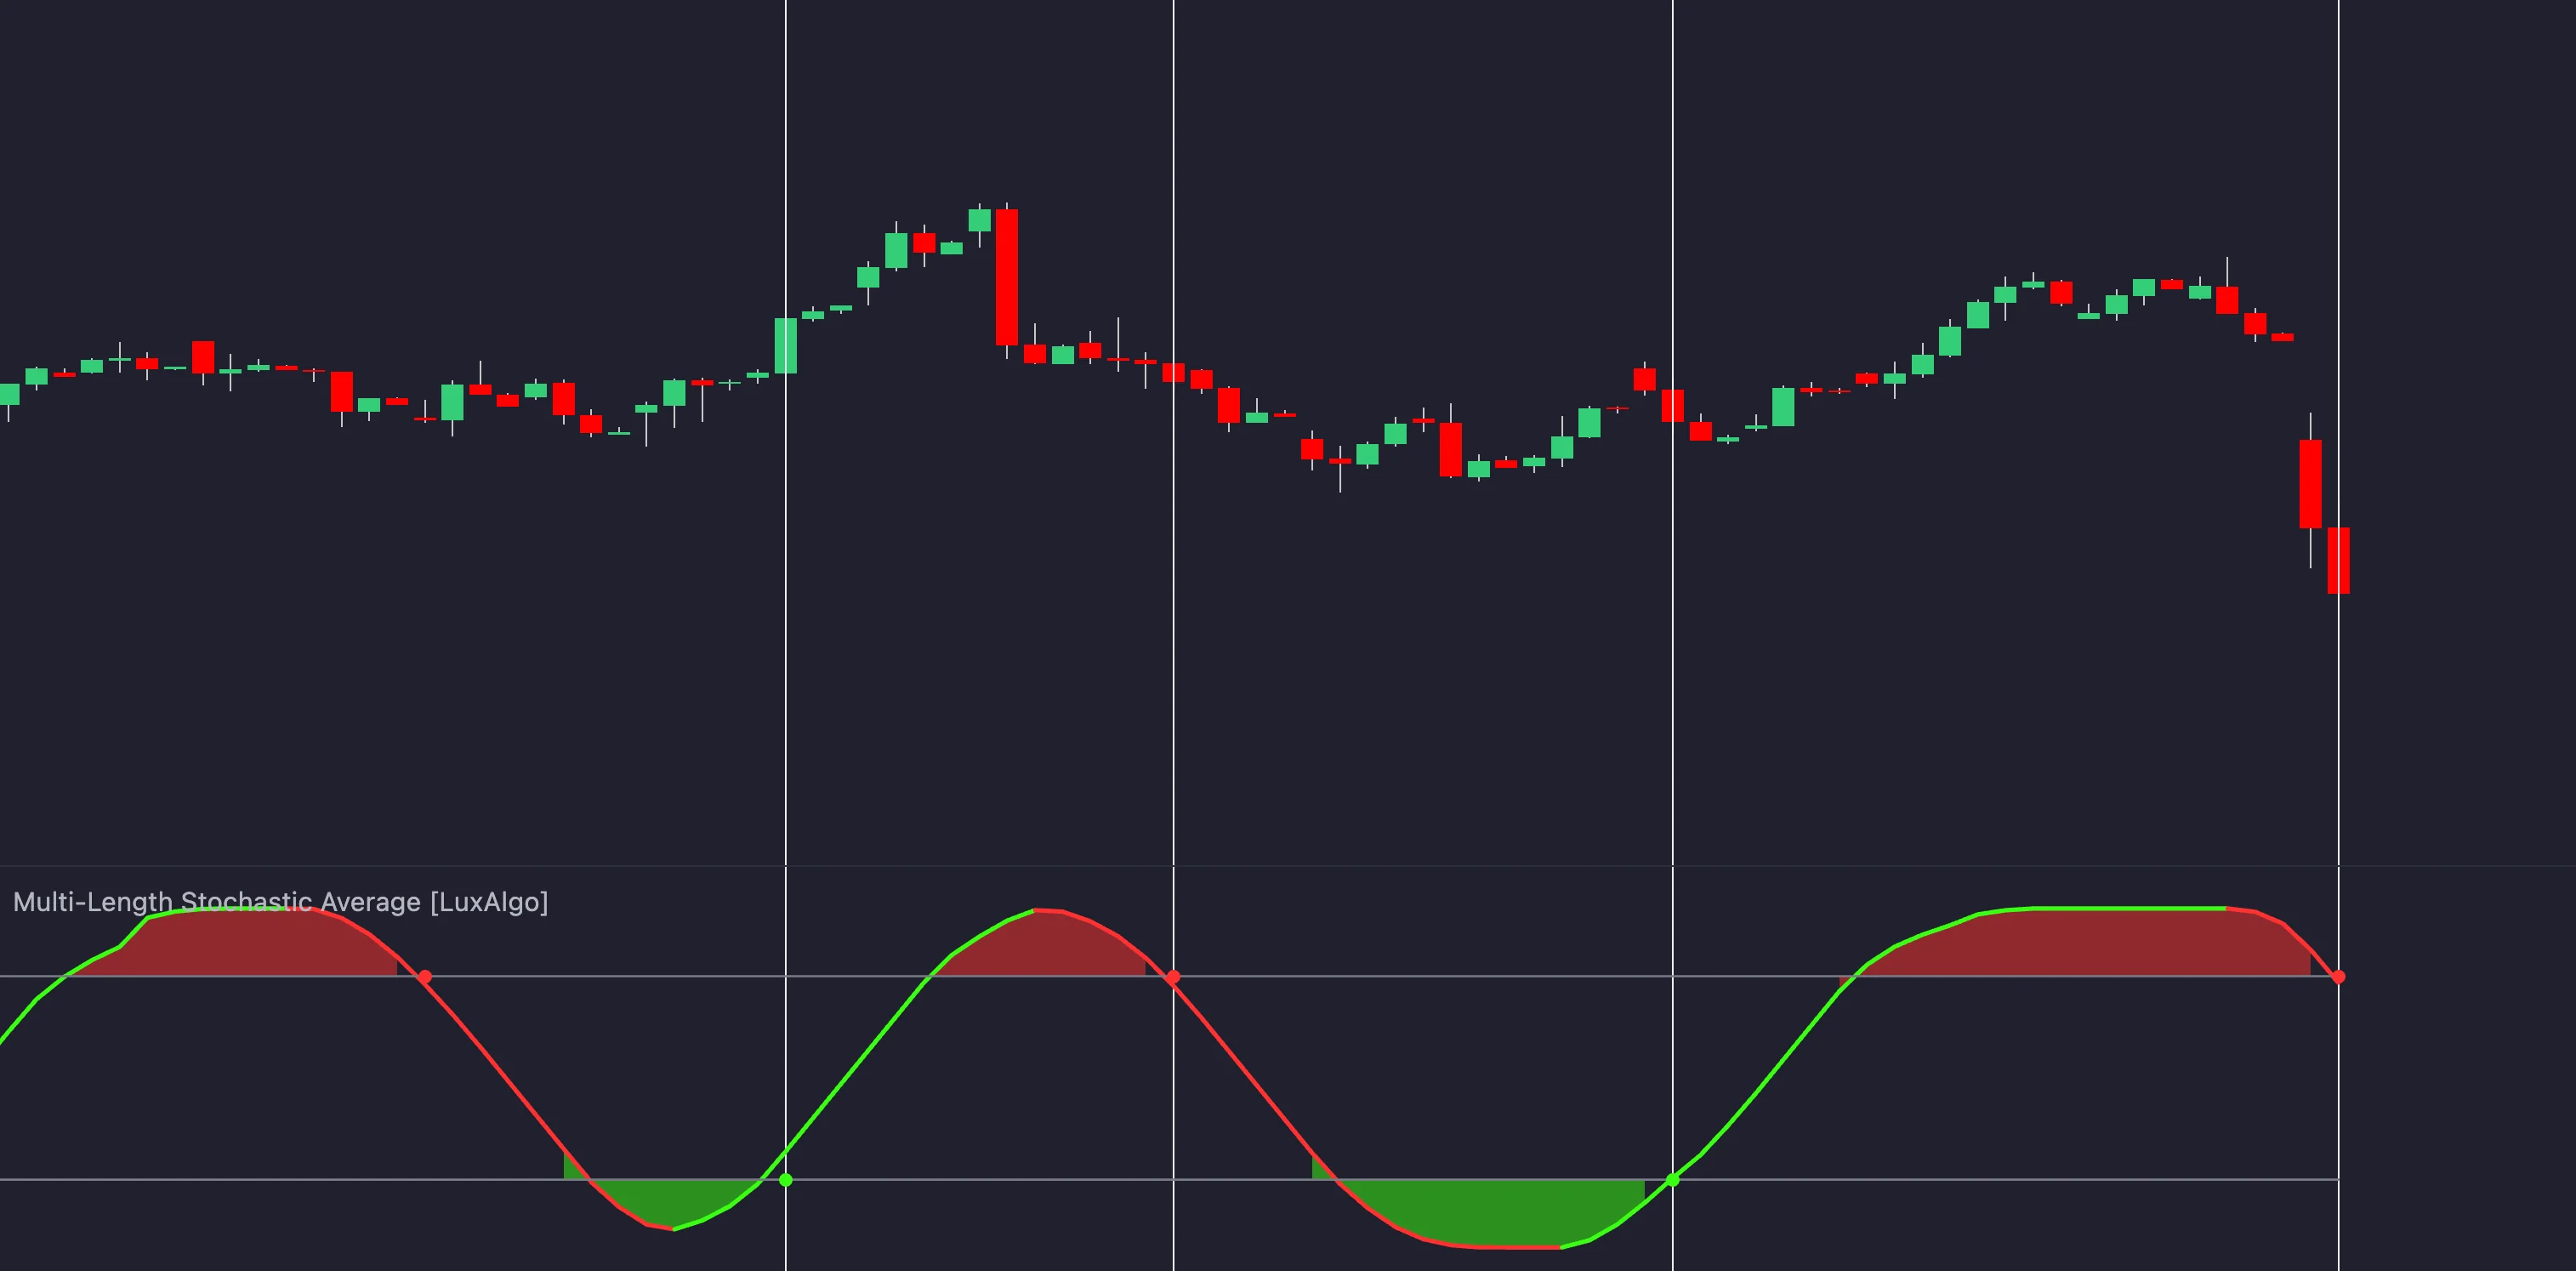
Test its threshold crossings as their own rule rather than assuming they are standard %K/%D crossovers. Smoothing changes timing; it does not guarantee fewer false breakouts or preserve every turning point.
The Library’s market-structure and price-action tools detect structures and zones automatically on a Quant Chart. Evaluate them under their own definitions and timing; they are not identical to manually drawn support.
Keep screenshots and notes on both successful and failed level tests. The LuxAlgo Journal can help review recorded trades, while a separate experiment log tracks configurations you tested but did not trade.
FAQs
What are the ideal settings for a stochastic oscillator?
There is no universally ideal preset. Record the range lookback, %K smoothing, %D period and chart interval. A 14,3,3 configuration can be a baseline, but compare changes with realistic costs and a separate evaluation period. Fast, slow and full stochastic are not names for three particular numerical presets.
How can I confirm signals using key levels?
Define the level before the setup, then specify a completed-bar oscillator trigger, entry timing and invalidation. Oversold near support or overbought near resistance identifies a condition to test; it does not confirm that price will reverse.
Are there advanced tools to improve this strategy?
Quant can help implement explicit rules for testing on native LuxAlgo charts. Multi-Length Stochastic Average offers a different oscillator construction with configurable smoothing. Evaluate whether either changes the results of your workflow rather than assuming an improvement from adding tools.
What’s a common mistake to avoid?
Drawing a level after seeing a reversal and treating it as a level known before the trade introduces hindsight. Preserve the level’s original definition and include failed tests as well as successful examples.
How often should I tweak my settings?
Use a planned review schedule and a documented reason for each change. Repeatedly adjusting parameters after a few losing trades can fit noise. Compare limited alternatives, include costs and evaluate the selected rules on data not used to choose them.
Read next