How to Use Moving Averages with Support and Resistance
Moving averages can help organize support and resistance analysis by providing a changing reference for trend and price location. A horizontal level marks a fixed area from earlier price action; a moving average updates as new observations arrive. When the two are close, you have a location to investigate, not a guarantee that price will reverse.
Use LuxAlgo’s charting and AI platform to compare these conditions on Quant Charts, then define a repeatable test with Quant, our coding agent. The useful question is what price does near a specified average under a stated rule, including the times that the level fails.
Key Takeaways
- SMA and EMA differ in weighting, not in a universal assignment to swing trading or day trading.
- Specify type, length, source, timeframe and session before comparing charts.
- A bounce, a price crossing and a two-average crossover are separate events.
- Treat support and resistance as hypotheses with explicit invalidation and sizing.
- More averages can add complexity without adding independent evidence.
Setting Up Moving Averages
SMA vs. EMA
A simple moving average is the arithmetic mean of the selected observations. For closing prices of $98, $100 and $102, a three-bar SMA is $100. At the next $104 close, the window becomes $100, $102 and $104, so the average rises to $102.
An exponential moving average uses a recursive weighting: new EMA = previous EMA + α × (new price − previous EMA), with α = 2 ÷ (length + 1) for the standard formula. Its initialization and available history can affect early values. Both methods lag price; an EMA’s greater emphasis on recent observations does not eliminate false signals.
| Feature | SMA | EMA |
|---|---|---|
| Weighting | Equal weight within the selected window. | Greater weight on recent observations, with older influence decaying. |
| Response | Can be smoother for the same length, with changes as old observations leave the window. | Usually responds more strongly to recent changes. |
| Possible use | Trend reference, pullback location or crossover study. | The same roles with different responsiveness. |
| Limitation | Lag and repeated crossings in sideways conditions. | Lag remains, and greater responsiveness can increase turnover. |
StockCharts’ moving-average guide explains these calculations and the trade-off between responsiveness and lag. Neither type is inherently more dependable across all assets.
Choosing Time Periods
A length counts chart bars. A 50-period average on a five-minute chart is not a 50-day average. Session breaks, extended-hours settings, missing observations and adjusted price data can also affect comparisons.
| Research horizon | Example lengths | Decision to define |
|---|---|---|
| Intraday | 9 or 10, 21 and 50 bars. | Which average defines context and which, if any, triggers an entry. |
| Daily swing study | 20 or 21, 50, and 200 or 250 bars. | Whether the method requires price location, slope, a crossover or a pullback. |
| Higher-timeframe context | A chosen daily or weekly average. | Whether the condition uses a developing bar or only the last completed bar. |
These are common starting points, not recommended optimal settings. A short EMA can be used on a daily chart, and an SMA can be used intraday. Choose a small number of hypotheses and keep a record of every variation tested.
Platform Setup on LuxAlgo
The LuxAlgo Moving Average Library tool supports standard average types and an optional second average. Its documented defaults are a 20-bar SMA on close for MA 1, with a 50-bar SMA on close for MA 2; the second plot is initially hidden.
- Open the tool on Quant Charts and select the symbol and timeframe for the study.
- Set the calculation type, length and source explicitly. Enable the second plot when comparing two averages.
- Distinguish the curves visually and record their roles, such as context versus trigger.
- Mark horizontal levels from information available before the entry; keep their recognition dates.
- Save the settings with the strategy run so later comparisons use the same inputs.
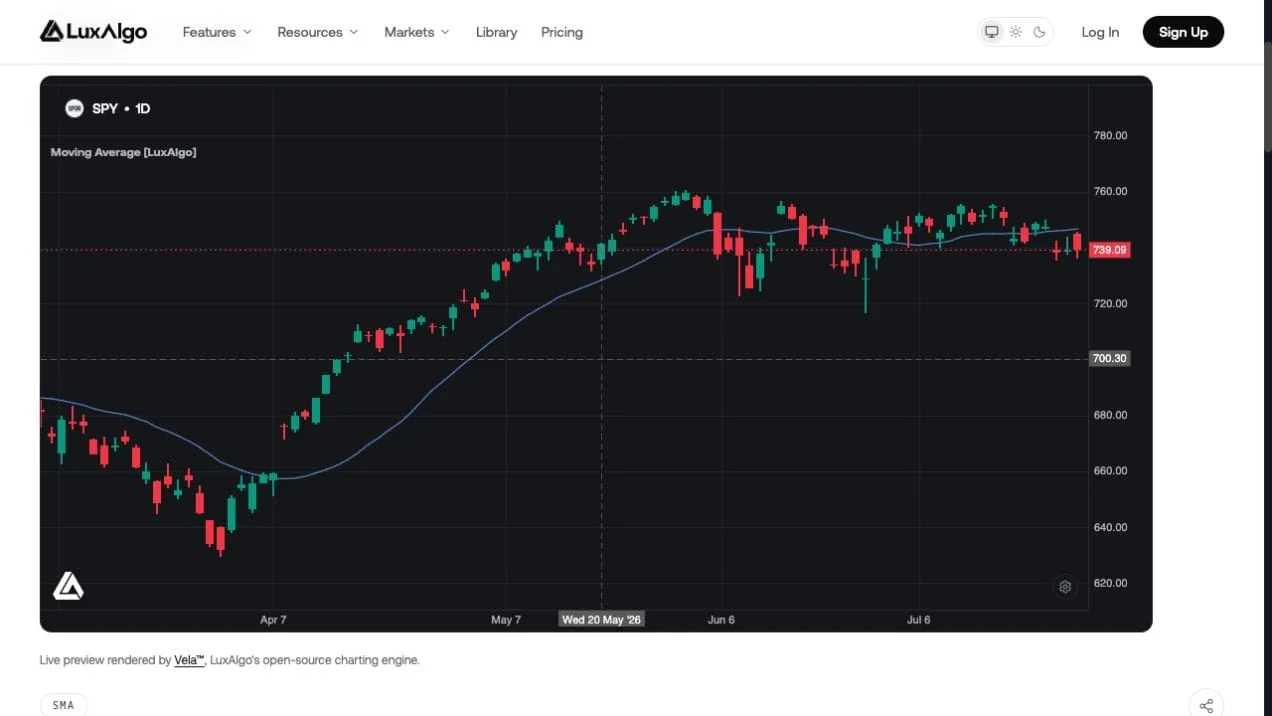
The tool documents price-to-average and average-to-average cross alerts. The latter can evaluate even while the second plot is hidden, so display visibility should not be treated as disabling the underlying condition. Check the chosen alert workflow and timing separately from a strategy’s simulated entries.
Creating Support and Resistance Zones
A moving average is calculated from price; it is not a visible stack of buy or sell orders. Calling it dynamic support means price has reacted near it under a particular interpretation. The same curve can be crossed repeatedly when the market lacks a sustained trend.
Define a tolerance instead of deciding afterward whether a candle was “close enough.” For example, a research band might extend 0.5% on each side of an average. At an MA value of $100, that spans $99.50–$100.50. An ATR-based distance is a different rule and should be evaluated separately.
Compare that band with previously identified horizontal support or resistance. If a confirmed support area spans $99–$101 and the average is $100, the overlap is easy to describe. It does not establish that buyers must defend the area, and a broken support zone may become a later resistance reference only if subsequent behavior supports that interpretation.
Diagonal trendlines depend on which anchors were chosen. Pivot-based levels also require time to confirm. A chart that displays the level back at a prior pivot does not mean the completed level was known on that earlier bar.
The 200-day average is widely followed, but the percentage of days an index spends above it is not a trade win rate. Historical claims need a specified index series, dates, adjustments and rule. Likewise, an oil example described as exiting at $65 and re-entering at $40 cannot validate a strategy without the contract, roll treatment, timing and fills. Treat such price pairs as incomplete illustrations rather than an audited result.
Price Action Near Moving Averages
Reading Bounces and Breakouts
| Event | Example rule to investigate | Main limitation |
|---|---|---|
| Bounce near an average | Price enters a predefined band, then closes above the average while a trend filter remains positive. | The average and band can move during the bar; define which values are used. |
| Price crosses an average | The prior close was at or below its contemporaneous average and the current completed close is above its own. | A crossing around a flat average may be quickly reversed. |
| Two averages cross | The fast average moves from at or below the slow average to above it. | The event follows earlier price changes and can arrive late. |
| Price clears horizontal resistance | A completed close exceeds a level that was fixed before the signal. | A level break and an MA cross are different conditions. |
Waiting for a completed candle removes uncertainty about that candle’s final values; it does not eliminate failed breakouts. For daily rules this means the daily close, while an intraday strategy uses its own bar interval. A close-based signal normally needs a subsequent executable fill rather than an assumed entry earlier in the same candle.
Volume can be an additional filter if its baseline and feed are defined. A volume spike does not prove a level will hold. Use the same session and source when comparing activity, and check Quant Charts data coverage before interpreting exchange-specific volume as total market activity.
Moving-Average Crossover Signals
Golden cross and death cross commonly refer to the 50-day average crossing above or below the 200-day average, respectively. Other fast/slow combinations should be named explicitly. Price moving through one average is a price crossover, not a two-average cross.
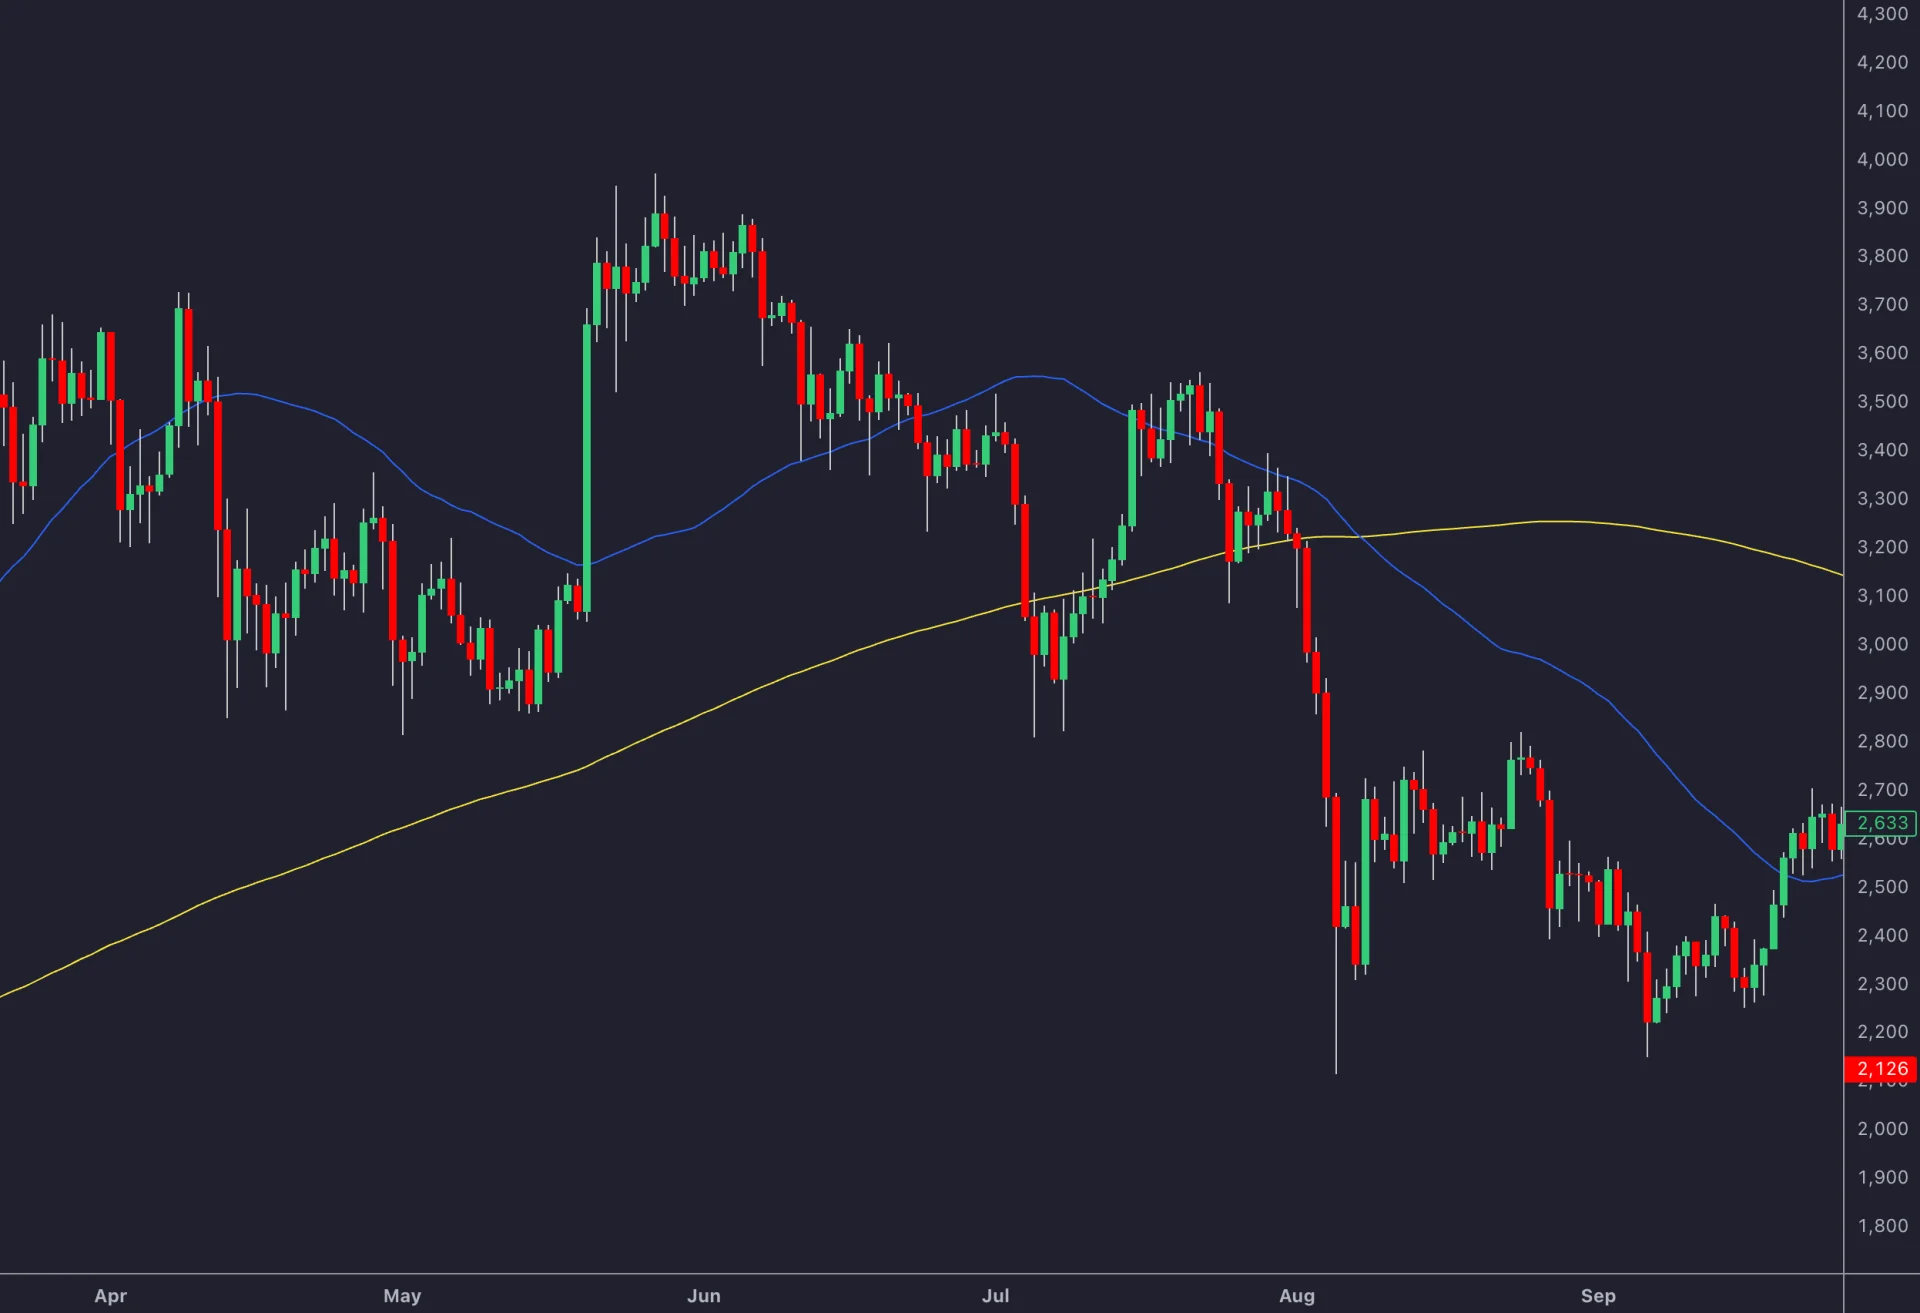
An average’s slope and price’s location relative to it are separate conditions. Price can close above an average that is still falling. Define slope, for example, by comparing today’s value with its value five completed bars earlier.
Several moving averages often converge during consolidation because they summarize overlapping price history. That does not automatically make the area stronger. MACD also derives from moving averages, so adding it may restate related information rather than independently confirm a cross.
Trading Strategy Development
Entry and Exit Rules
Turn the visual idea into an auditable example. For a daily long-only study, you might require the 50-day SMA above the 200-day SMA, a pullback near the 50-day average and a previously confirmed horizontal support level. Specify the distance and recovery trigger instead of labeling any upward candle a valid bounce.
A request to Quant, our coding agent, could be:
Create a daily long-only study using standard closing prices. Require the 50-day SMA above the 200-day SMA. Use support levels only after their recorded confirmation dates. Trigger when a completed bar trades into a 0.5% band around the prior bar’s 50-day SMA, that band overlaps an active support zone, and the bar closes above the prior MA value. Enter at the next open, allow one position at a time and reject entries beyond a configurable maximum stop distance. Keep the support-zone and MA values used for each decision in the trade record.
This deliberately uses the prior average to define a fixed band for the signal bar. A rule using the current average is a different test. If you want automatic support detection, specify pivot left/right lengths, confirmation delay, invalidation and which of several levels is eligible.
Inspect the generated code and run it manually, following Making Strategies with Quant. Check several accepted and rejected signals against the chart. Set a stop, target or time exit before evaluating results; the entry description alone is not a complete strategy.
Risk-Management Guidelines
A blanket stop “3–5 points below the average” ignores instrument price, tick value and volatility. Use the chosen invalidation level and calculate exposure from the actual entry-to-stop distance. Include contract multipliers and currency conversion where applicable.
For a hypothetical share trade entered at $102 with a $99 stop, planned risk is $3 per share. A selected $150 risk budget permits 50 shares before costs. A $108 target offers $6 per share, or 2R. That objective does not guarantee positive expectancy; realized win rate, losses and costs still matter.
If a gap changes entry to $105 while the stop remains $99, the same budget permits 25 shares. Keeping 50 shares would double planned price risk to $300. A subsequent gap through the stop to $97 would lose $200 on 25 shares entered at $105, before costs.
If the plan trails a stop behind an average, state when it updates and whether it may only tighten. Letting a falling average move a long stop farther away can increase the loss allowance. A fixed initial stop is also a legitimate rule to test.
Strategy Testing Methods
The native strategy viewer provides backtest summaries and trade-level results. Set commission, slippage and sizing, save the run and compare the complete distribution of trades. Review net expectancy, profit factor, drawdown, holding time and losing streaks, not just a win-rate headline.
Test trending, sideways and volatile periods without choosing the best parameters separately after seeing each outcome. Keep an evaluation sample untouched during development. Record failed bounces, missed entries and whipsaws as well as attractive examples.
Troubleshooting and Tips
Reducing False Signals
A price buffer, a persistence requirement or a trend filter may reduce some crossings while delaying entries or excluding good trades. Compare each change with the same baseline. Adding RSI, MACD and several averages does not ensure reliability; ATR describes volatility, not bullish or bearish direction.
For repeated crossings near a flat average, consider whether the method should pause rather than automatically shortening the period. Faster settings may create more activity in a range. In high volatility, check stop distances, fill assumptions and exposure before changing the indicators.
Market-Condition Adjustments
Define any adjustment in advance, including the condition that turns it on and off. A rule that changes parameters after each loss can fit the recent past without improving future decisions. Higher-timeframe context can simplify a chart, but its developing candles still change until they close.
For an instrument such as Microsoft, inspect a specified historical period and count both reactions and failures near the 50-day or 200-day average. Do not infer repeated successful support from a few selected charts.
Tools and Platform Distinctions
Quant Charts and Library studies support native chart analysis, while Quant helps develop and revise explicit code. Check each tool’s documented fields rather than assuming it scans every custom MA/support condition used here.
Native strategy results, chart alerts and live broker execution are different things.
Do Moving Averages Actually Work as Support and Resistance?
Putting the Method Together
Choose the average, define the surrounding zone and identify horizontal levels without hindsight. Decide what counts as a bounce or break, how the order fills and what ends the trade. Use LuxAlgo to inspect and test that process, including its failures. A clear rule makes a result interpretable; it does not make the market predictable.
Frequently Asked Questions
Are moving averages guaranteed support or resistance?
No. They are calculated references that price can cross repeatedly. Define the zone, trigger and invalidation and evaluate both reactions and failures.
Is an EMA always better for day trading?
No. EMA and SMA differ in weighting. Their usefulness depends on the length, timeframe, market and complete strategy.
What is the difference between a price cross and a golden cross?
A price cross moves through one average. A golden cross commonly means the 50-day average crosses above the 200-day average; name other combinations explicitly.
Should I place a stop a fixed number of points below the average?
Only if that is a justified and tested rule for the instrument. Account for volatility, tick or contract value, actual fill and the chosen risk budget.
Does combining more averages improve accuracy?
Not necessarily. Their inputs overlap, so additional averages can add complexity and correlated signals. Compare each addition with a consistent baseline.
How can Quant help test this method?
Specify average settings, support recognition, trigger, order timing and exits. Inspect the generated code, run it manually and review full results with realistic costs.
References
LuxAlgo Resources
- Moving Average Library Tool
- LuxAlgo Quant
- Making Strategies with Quant
- Native Strategy Backtests
- Quant Charts Data
External Resources
Read next