How To Use Price Channel Filters For Trend Analysis
Price channels can organize trend analysis, but first define which channel you mean. A hand-drawn parallel channel follows selected swing points. A rolling high–low channel calculates extremes over a fixed lookback. They do not use the same construction, and a breakout rule must match the channel being tested.
This guide explains both approaches, how to separate breakout and reversal hypotheses, and how to turn a chart observation into a repeatable filter. A channel boundary is a reference, not a barrier that price must respect.
Choose the Channel Construction
| Channel | How it is formed | What to specify |
|---|---|---|
| Parallel drawing | A baseline through selected points and a parallel offset | Anchors, scale, offset and when the drawing becomes available |
| Rolling high–low channel | Highest high and lowest low over a lookback | Bar interval, lookback and whether the current bar is excluded |
| Other calculated bands | A formula such as an average plus volatility-based distances | Exact implementation; do not assume every band is a high–low channel |
Recognize Ascending, Descending and Horizontal Channels
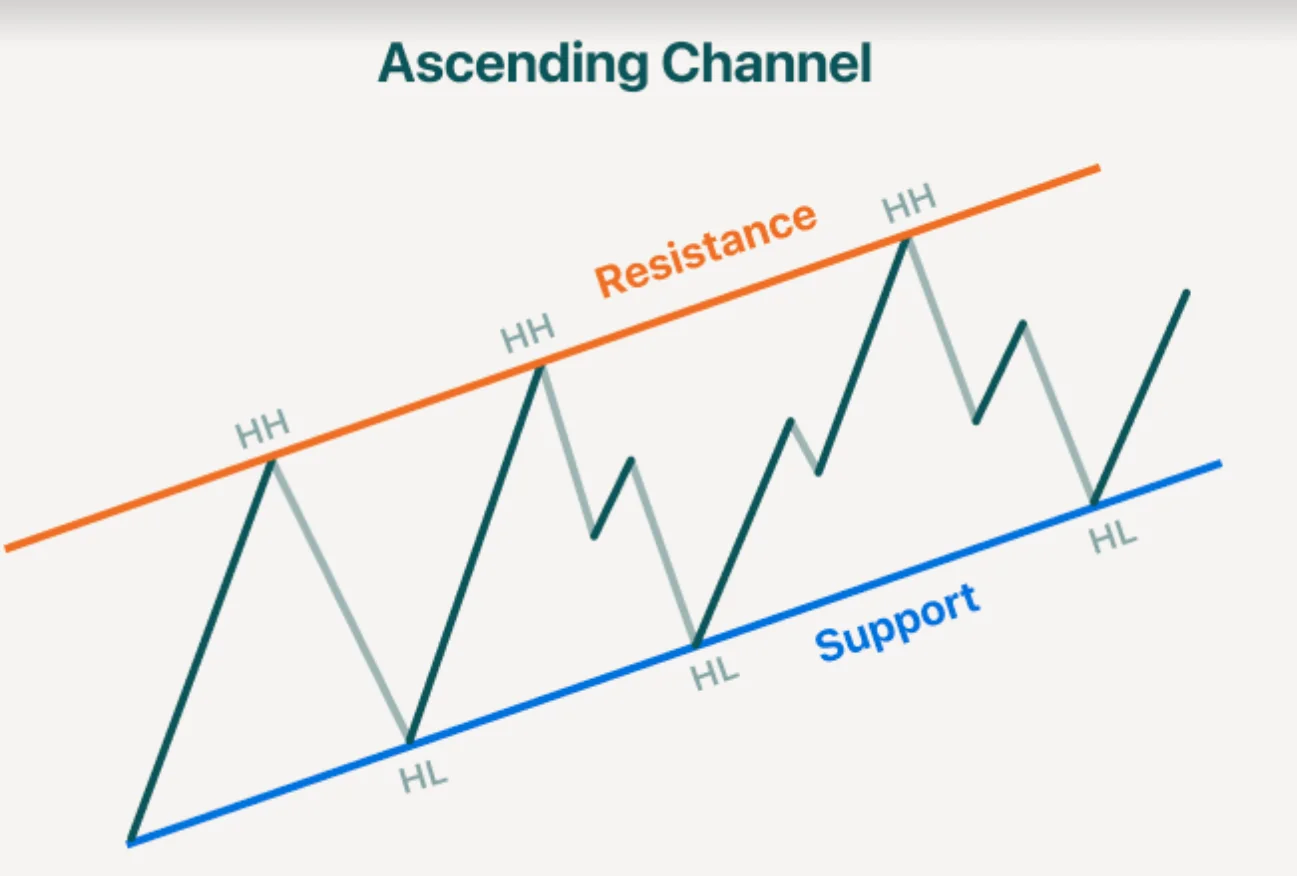
An ascending parallel channel has upward-sloping boundaries and can describe rising swing structure. It does not mean every lower-boundary touch should be bought. The price can break below the drawing or advance without returning to its lower edge.
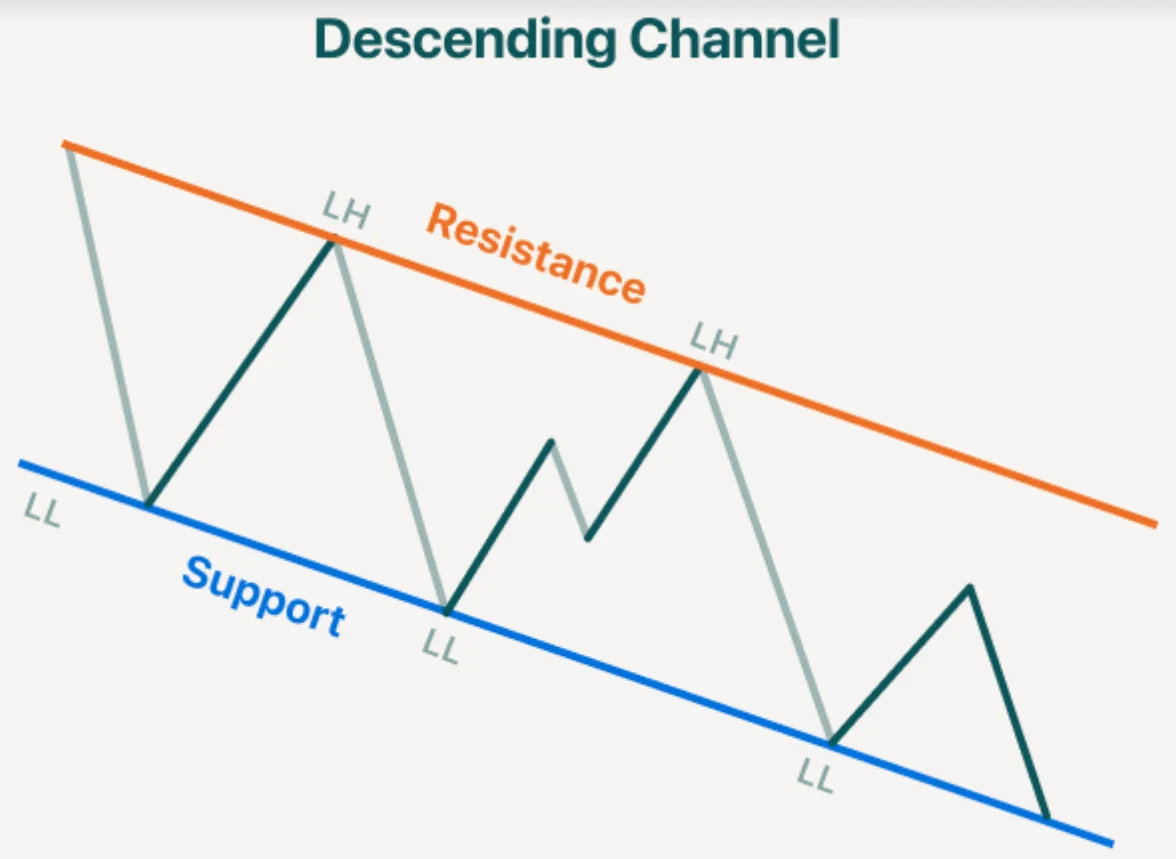
A descending channel has downward-sloping boundaries. Lower highs and lower lows can organize a bearish trend description, but neither a touch nor an upper-boundary break establishes a profitable short or reversal trade.
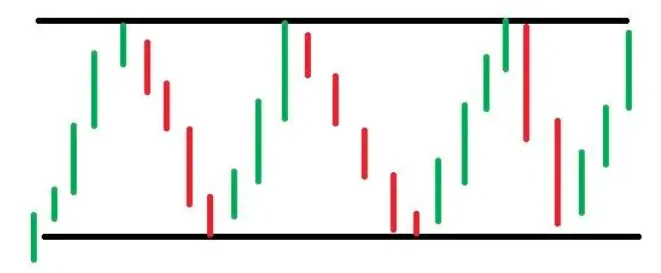
A horizontal channel describes a selected range. Its upper and lower levels can frame a range hypothesis or a breakout hypothesis. A quiet range does not specify when or in which direction price will leave it.
Draw a Parallel Channel Consistently
- Choose a chart interval and price scale. A straight line on a logarithmic chart represents different price geometry from one on a linear chart.
- Select two meaningful points for a baseline, such as two rising lows. Place a parallel copy through a relevant opposing extreme.
- Check other interactions without forcing all highs and lows onto the drawing. Two independently connected sets of points will not necessarily produce parallel lines.
- Use a consistent wick or body convention. Specify when each anchor is confirmed and how later breaks cause the drawing to be retired or updated.
A swing confirmed by later candles was not available at the earlier candle where it is plotted. Keep the original drawing in the evaluation record rather than repeatedly shifting it to explain subsequent price action. More historical touches do not by themselves prove better future reliability.
Calculate a Rolling Price Channel
A rolling channel takes the highest high and lowest low over a selected number of bars, with their midpoint as an optional centerline. The StockCharts Price Channels implementation excludes the current period when comparing price with its channel. Verify the convention in your own tool.
For a prior-bar breakout rule, compare the current close with the maximum high or minimum low of the preceding N completed bars. If you include the current high in the upper boundary, the current close cannot strictly exceed that maximum. An apparent breakout may instead reflect an offset, a different price source or an intrabar comparison.
For example, if the prior 20 bars have a maximum high of 105 and a minimum low of 95, the channel is 95–105 and its midpoint is 100. A completed close at 106 is above the prior upper boundary. A high of 106 followed by a close at 104 is not a close-based breakout. These examples describe a condition, not its expected return.
Twenty daily bars and twenty hourly bars are different windows. Changing lookback is not the same as changing timeframe. For the same ending point, a longer high–low lookback cannot have a narrower extreme-to-extreme range than a shorter nested lookback. That mathematical property does not tell you which setting will trade better.
Separate Breakout and Reversal Rules
| Hypothesis | Possible rule to investigate | Important limitation |
|---|---|---|
| Breakout continuation | A completed close beyond the previously known boundary | Can reverse immediately; define fill timing and adverse exit |
| Breakout then retest | A later revisit followed by a specified reaction | The revisit may never happen or may fail |
| Within-channel reversal | A boundary interaction plus an explicit reversal trigger | Fading a strong trend can produce repeated losses |
A decisive close needs a measurable definition: any close outside, a fixed distance, or a volatility-based buffer are different rules. Volume can be an additional condition, but high volume does not guarantee continuation or reveal institutional intent. Verify the venue and volume measurement.
For reversal research, RSI divergence, a defined engulfing pattern or a momentum change can supply a separate trigger. Neither an overbought reading nor a wider channel automatically makes the setup more reliable. Define how swings are recognized and when the signal becomes known.
Adding RSI, Stochastic and moving averages can duplicate information already present in price. Stochastic explicitly compares the close with a high–low range, so it is closely related to rolling channels. Compare the base rule with each added filter on later data instead of treating agreement as independent confirmation.
Screen Candidates, Then Verify the Chart
A screener can help find candidates only if it supports the exact condition. Check the formula, interval, data delay and available universe. Do not assume a platform’s generic trend filter measures distance from your hand-drawn channel. TradingView and Finviz features must be checked in the particular screener being used.
StockCharts documents scans based on its calculated Price Channel values. By contrast, the thinkorswim SimpleTrendChannelFilter uses moving-average comparisons; its name is not evidence of a LuxAlgo channel screener or a geometric channel scan.
If you define distance from a boundary as a percentage, state the denominator and which boundary is used. The original suggestions of 2–3% proximity and 5–15% width are not universal quality thresholds. A stock, currency pair and intraday futures contract can require very different assumptions.
- Open each candidate on the intended source and interval.
- Verify the drawing or calculated boundary as it existed at the decision time.
- Check whether the event was a wick, close, retest or later-confirmed pivot.
- Inspect liquidity, spread, scheduled events and the volume field.
- Keep failed candidates in the record rather than collecting only clean historical bounces.
Manage Risk and Parameter Changes
Channel width describes the chosen construction. A rolling high–low width is a range measure; the fixed offset of a drawn parallel channel is geometry. Neither is a complete risk estimate. Set position size from the planned adverse distance, instrument value and loss allowance, then account for costs and worse-than-planned fills.
For a simple hypothetical instrument worth $1 per point per unit, a $100 loss allowance and a five-point adverse distance imply 20 units before costs. Increasing the distance to ten points implies ten units under the same assumptions. A channel target is not a guaranteed exit price, and contract specifications can change the calculation.
There is no general rule that high volatility requires shorter channels, low volatility requires longer ones, or trends require narrower boundaries. Changing settings after each loss can fit the past. Define update rules in advance and evaluate unchanged rules on data excluded from tuning.
Research Channels in LuxAlgo’s Native Platform
Use the Library and native chart workflow to inspect supported channel implementations. Keep the market, data source, interval and calculation convention consistent. Check native data coverage before assuming every symbol offers identical history or analytics.
Ask Quant, our coding agent to express a supported rule with explicit prior-bar boundaries, entry timing, exits and costs. Inspect the generated code and run it manually. Review strategy settings and individual trades using standard candle prices, then evaluate later data not used for parameter selection.
Frequently Asked Questions
Are all price channels calculated from recent highs and lows?
No. Rolling high–low channels use a lookback calculation; hand-drawn parallel channels use selected anchors and an offset. Other bands use different formulas.
Why use the previous channel boundary for a breakout?
Including the current high in the upper boundary makes a strict current-close breakout above that maximum impossible. A prior-bar boundary defines a reference available before the current bar.
Does a wider channel produce more reliable trades?
Not necessarily. Width depends on the construction and sample. Reliability must be evaluated for the complete rule after costs.
Do RSI and Stochastic guarantee confirmation?
No. Both depend on price history, and Stochastic is closely related to a rolling high–low range. Agreement is not independent proof of a successful trade.
Can a screener replace chart verification?
No. Verify the screener’s calculation, interval and data, then inspect the candidate and its signal timing on the intended chart.
Read next